
Weekly Fundamental Analysis Report
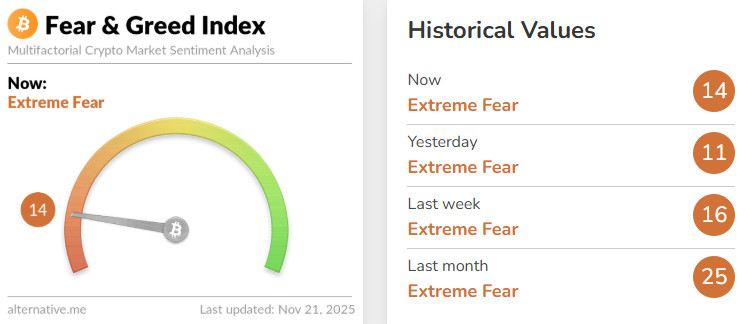
Fear & Greed Index
Source: Alternative.me
Change in Fear and Greed Value: -2
Last Week’s Level: 16
This Week’s Level: 14
This week in the crypto market, outflows from US spot BTC and ETH ETFs played a major role in the Fear and Greed Index falling from 16 to 14. With over $1 billion in outflows from BTC and ETH ETFs on a weekly basis and approaching $3 billion in November overall, the institutional side strengthened the narrative of selling, pushing sentiment permanently into the Extreme Fear band. The announcement of a record single-day outflow of $523 million from BlackRock’s IBIT product on November 19 reinforced this picture, positioning the ETF channel as the main trigger for the index’s downward movement. On the macro front, the ongoing data blackout following the government shutdown and the Fed officials’ cautious rhetoric emphasizing the stubborn course of inflation, coupled with the delayed September non-farm payrolls data showing employment growth exceeding expectations at 119k but the unemployment rate rising to 4.4%, and the decline in Michigan consumer confidence, dampened risk appetite rather than supporting it. Positive news from the XRP ETF and Circle fronts, while feeding the sector’s medium-term narrative, remained limited in the face of the week’s dominant themes of ETF-driven net outflows and Fed uncertainty.
Fund Flows
Source: CoinShares
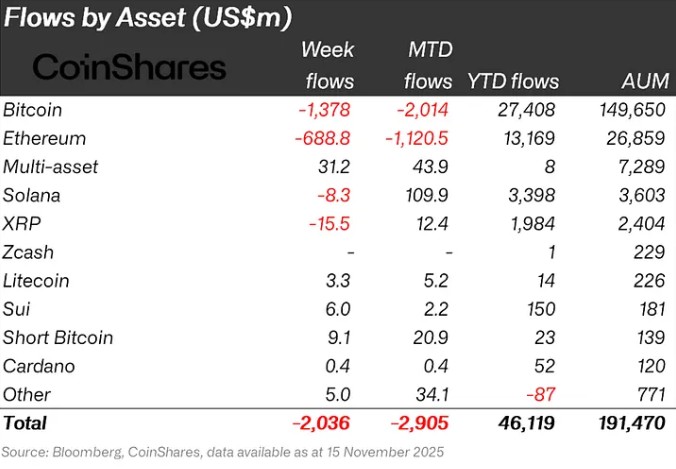
Overview: Cryptocurrency markets continued the week with significant declines. The week continued with declines amid negative statements from Fed members. As a result of these developments, Bitcoin lost approximately 25% of its value throughout the week.
SUI: New stablecoin updates are being discussed on Sui. This situation continued on Sui with $6.0 million in inflows ( ).
Litecoin (LTC): LTC saw an inflow of $3.3 million.
Cardano (ADA): Cardano saw an inflow of $0.4 million this week.
Multi-asset: Inflows were observed in the multi-asset group.
Other: Sector-specific and project-based increases in altcoins, along with the general market sentiment, brought about a $5.0 million inflow in fund flow data.
Fund Outflows:
Ethereum (ETH): Along with spot ETH outflows, there was a $688.8 million outflow from Ethereum this week.
Bitcoin (BTC): Bitcoin continues to see outflows from investors this week. Bitcoin-focused funds saw outflows of $1.378 billion.
Solana (SOL): Solana saw an outflow of $8.3 million.
Ripple (XRP): XRP saw $15.5 million in fund outflows this week.
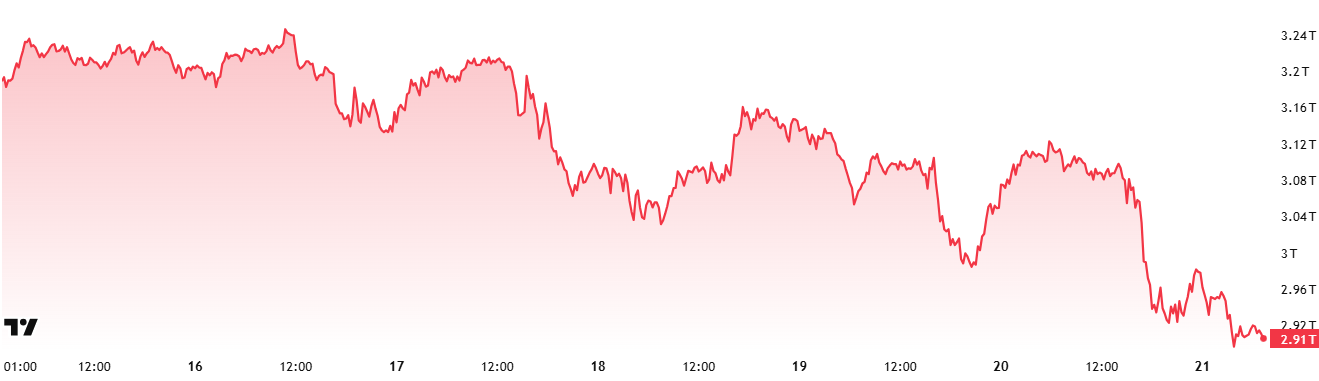
Total MarketCap
Source: Tradingview
- Market Value Last Week: $3.16 Trillion
- This Week’s Market Value: $2.91 Trillion
This week, the cryptocurrency market lost approximately $256 billion in value, declining by 8.12% and bringing the total market value down to $2.91 trillion. The weekly high was recorded at $3.23 trillion, while the lowest level was $2.89 trillion. Thus, the market was observed to move within a band of approximately $340 billion. This indicates a volatility of approximately 11% on a period basis. Although a narrower band formed compared to the 15% movement range seen last week, the crypto market still exhibited quite high volatility, equivalent to the average weekly candle size.
Total 2
Starting the week with a market value of $1.28 trillion, the Total 2 index retreated by 6.7% during the week, resulting in a loss of approximately $85.8 billion in value, falling to $1.19 trillion. The highest level during the week was recorded at $1.32 trillion, while the lowest level was $1.19 trillion. Thus, the index moved within a total band of $128 billion. This outlook shows that Total 2 traded within a range of 10.82% for the period and performed with less volatility compared to the previous week and relative to the Total index. Following the pullback during this period, the Total 2 index is now in a position where it can only reach its all-time high with increases of around 50%.
Total 3
Starting the week with a market value of $0.906 trillion, Total 3 fell by approximately $52 billion during the week, a decline of 5.75%, bringing the period to $0.854 trillion. There was an 8.78% difference between the highest and lowest values during the week. According to this calculation, Total 3 was the most stable index this week, creating a rather interesting picture that has been going on for two weeks.
While the crypto market presents a completely negative outlook, the fact that the strongest performance surprisingly came from the Total 3 index may signal hope for the start of the expected altcoin season once the current pullback ends. The volatility relationship among the indices, which follows the pattern Total > Total 2 > Total 3, actually indicates that the largest movement among the majors occurred in Bitcoin, followed by Ethereum.
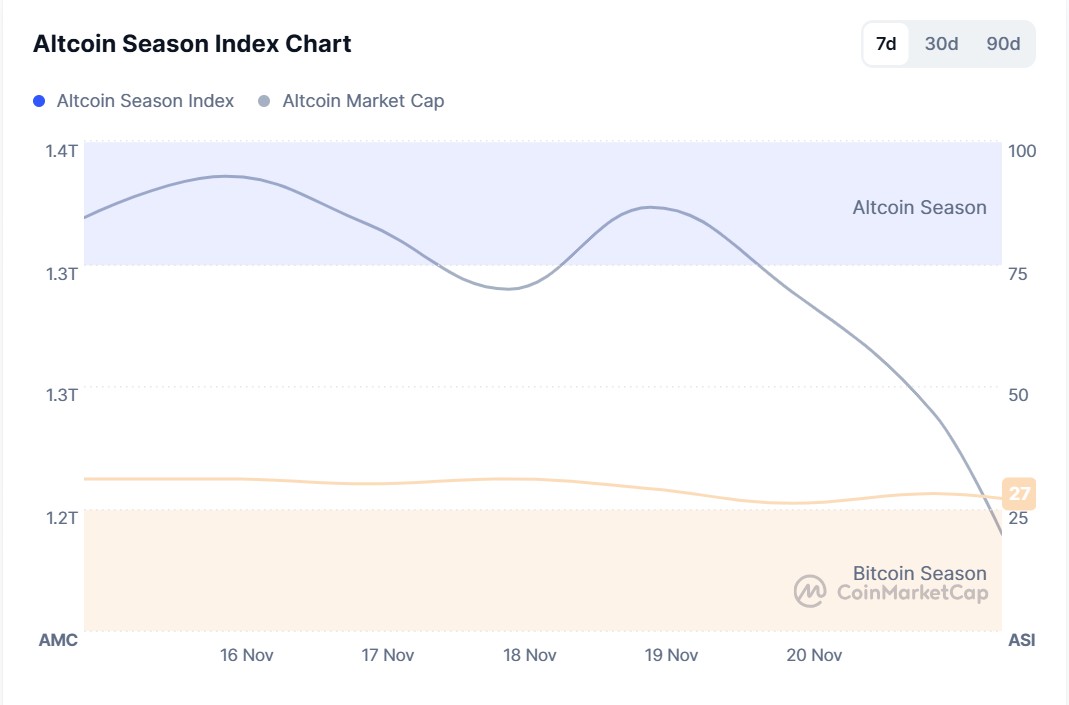
Altcoin Season Index
Source: Coinmarketcap
- Last Week’s Index Value: 33/100
- This Week’s Index Value: 27/100
Between November 14 and November 21, 2025, there was a slight decline in the correlation between altcoin market dominance (Altcoin Market Cap) and the Altcoin Season Index. The chart shows that the index peaked at 31 on November 16 this week, indicating that the Altcoin Market Cap reached 1.32T. When the index rose this week, the top 5 coins leading the rise were Zec, Aster, M, Merl, and Dash. On November 21, the index fell from 31 to 26, indicating a potential decline in the altcoin season.
Bitcoin Dominance
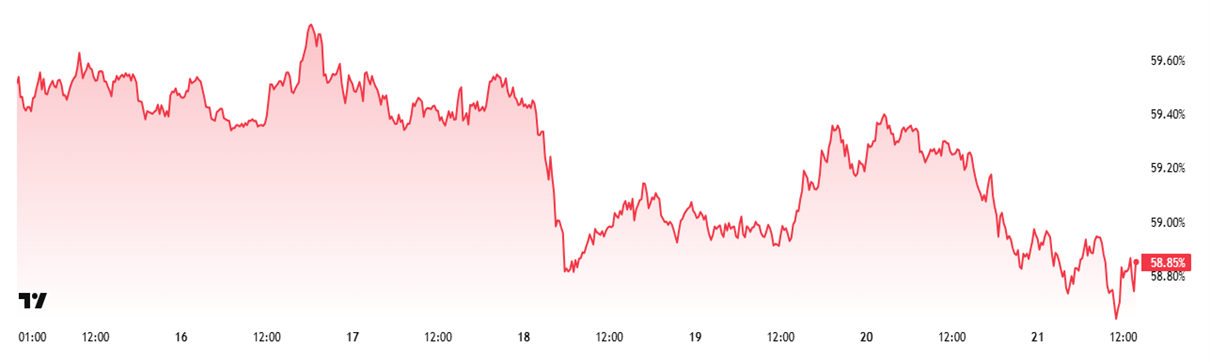
Bitcoin dominance, which started the week at 59.40%, showed several rebound rallies towards the 59.55% – 59.60% range during the week, but the overall outlook shows a downward trend. Following the selling pressure that became apparent after the 17th, dominance fell to around 58.70% and is currently attempting to stabilize at around 58.79%.
As a natural consequence of this entire process, retail investors trading through ETFs have been observed to take more sell positions during this period. The persistence of macro uncertainties is suppressing inflows into crypto assets and limiting the buying momentum in Bitcoin. Weak flows in ETFs are also among the factors supporting the short-term pullback in dominance.
Ethereum Dominance
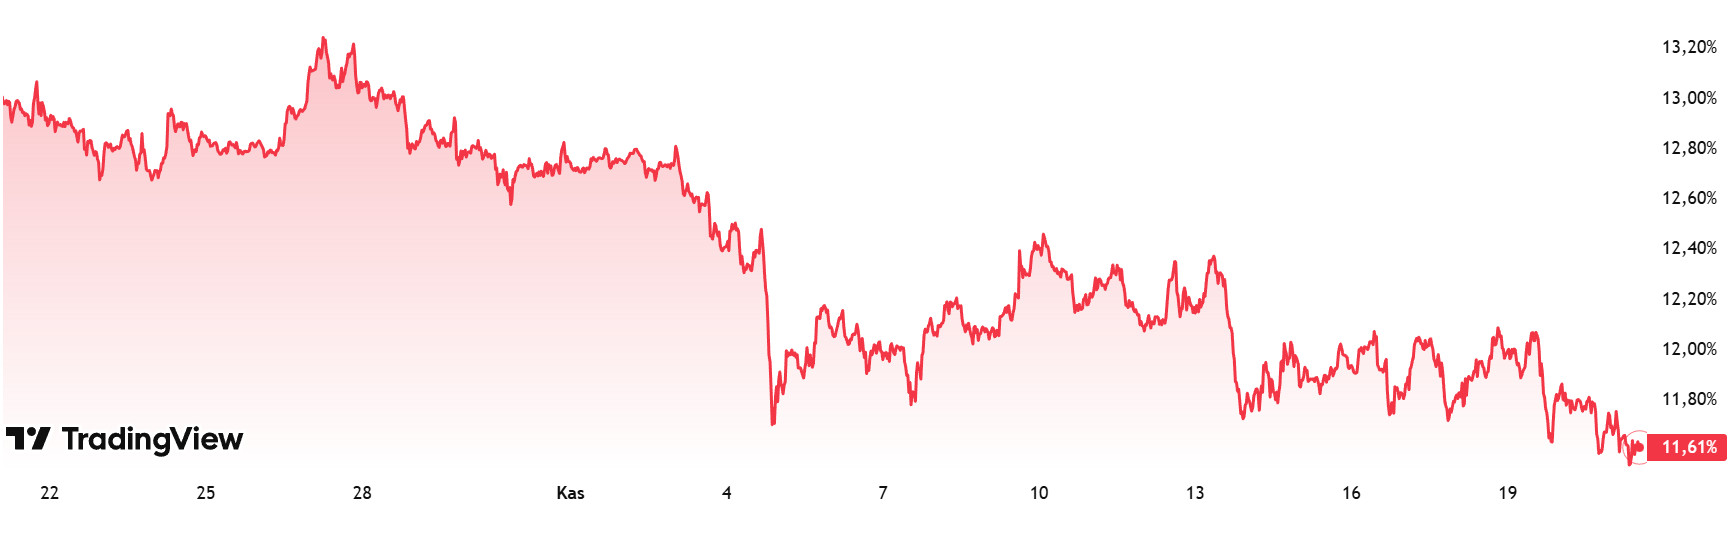
Source: Tradingview
Weekly Change:
- Last Week’s Level: 11.82%
- This Week’s Level: 11. 61%
Ethereum dominance, which rose to 15% levels in mid-August, lost momentum and entered a downward trend. This negative outlook continues as of this week.
Accordingly, Ethereum dominance ended last week at 11.82% and is currently trading at around 11.61% based on the latest data. During the same period, Bitcoin dominance also followed a negative trend similar to Ethereum.
The key developments affecting Ethereum dominance are as follows:
Arthur Hayes, co-founder of BitMEX, sold a total of 1,480 ETH over the last two days, executing a transaction worth approximately $4.7 million. Hayes, who made his previous sale on August 1, appears to have made some of his recent sales when the ETH price was at low levels. Past transactions indicate that Hayes frequently buys back at bottom levels.
The Ethereum Foundation has published a draft of the Interop Layer, which aims to transform Layer-2 networks into a single unified user experience. Based on ERC-4337, this structure enables cross-chain transactions to be reliably completed with a single signature.
Ethereum Foundation Co-Executive Director Hsiao-Wei Wang stated that reliability, flexibility, and protective responsibility are critical in Ethereum’s transition to the Fusaka phase. Wang highlighted that Ethereum has managed to maintain 100% block production with every upgrade and stated that this stability will be preserved. Comparing the ecosystem’s development to a “compound interest effect,” Wang also emphasized that decentralization and neutrality are indisputable.
Bitcoin Spot ETF
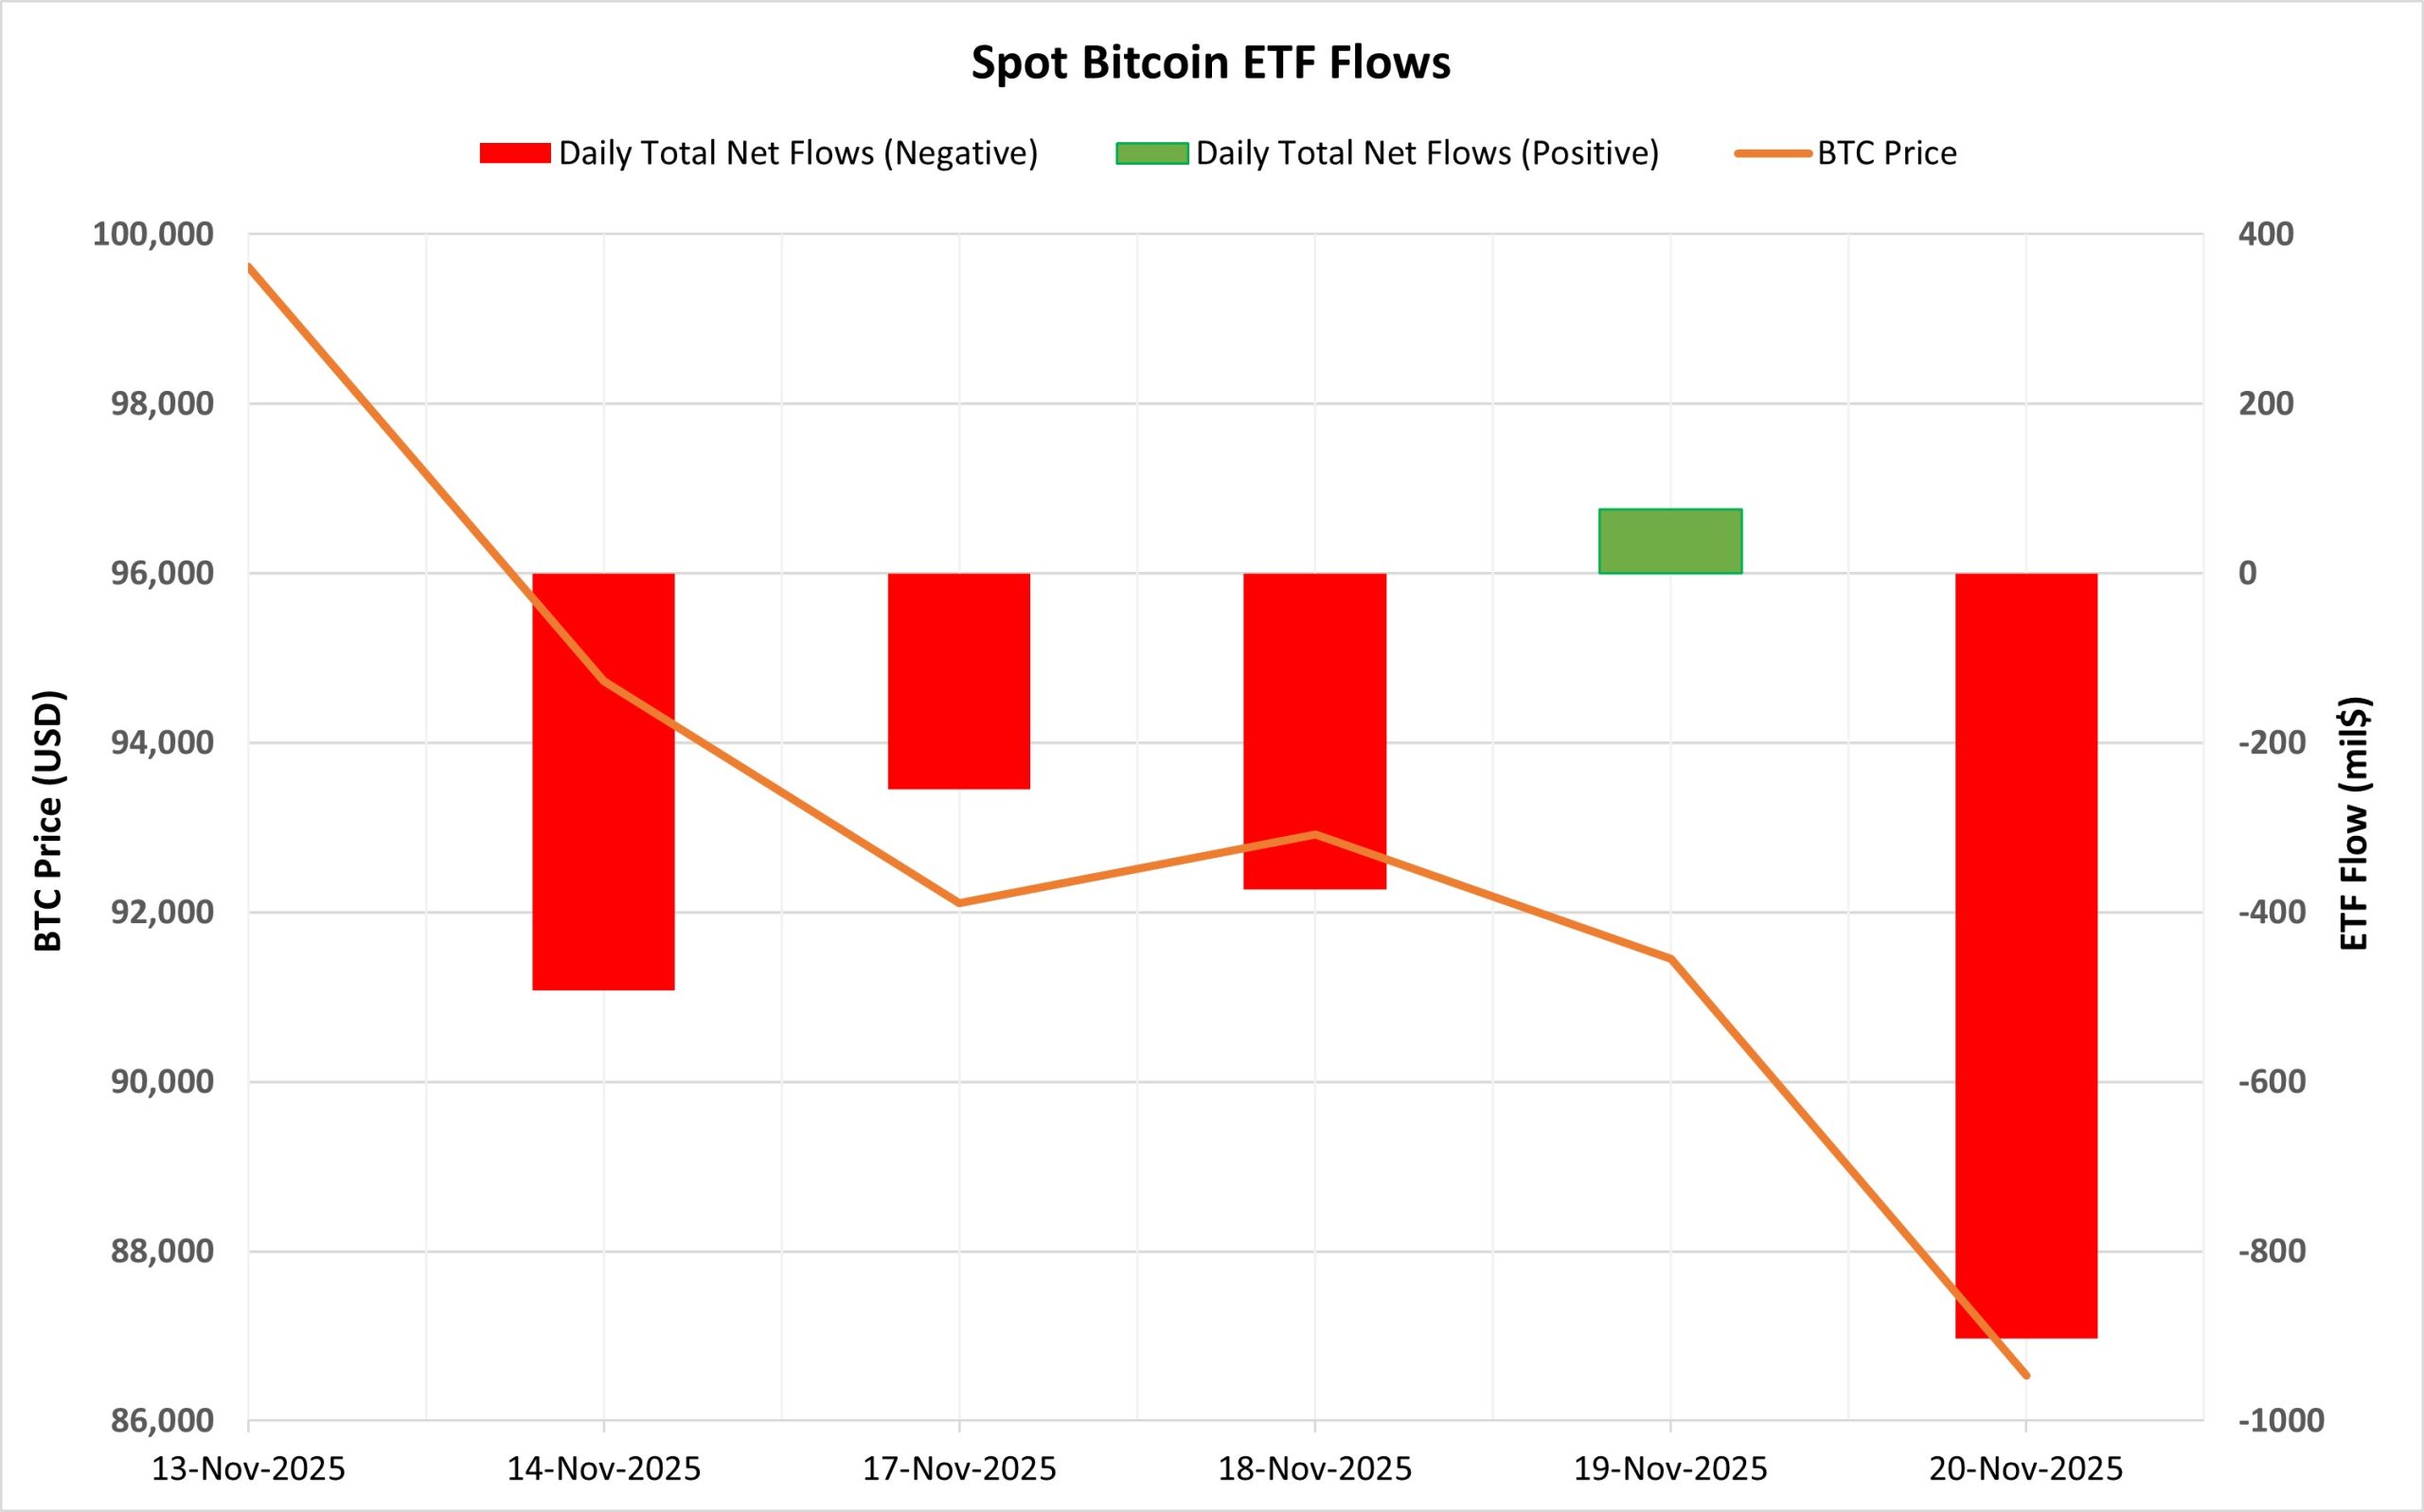
Source: Darkex Research Department
Netflow Status: Between November 14-20, there was a total net outflow of $1.947 billion in Spot Bitcoin ETFs. The overall flow picture during this period was strongly negative. Two major outflows stood out, particularly on November 14 with $492.1 million and on November 20 with $903.2 million. During this period, only a $75.4 million inflow was observed on November 19, ending the five-day negative flow series. The most significant outflows by fund were from BlackRock IBIT, Fidelity FBTC, and Ark ARKB.
Bitcoin Price: Bitcoin opened at $99,618 on November 14 and closed at $86,534 on November 20. During this period, the BTC price lost 13.13% of its value. The sharpest decline in prices was seen on November 20, while price pressure increased at the same rate during the days when ETF outflows accelerated. This picture revealed that the weakness on the institutional side was directly reflected in prices.
Cumulative Net Inflow: By the end of the 468th trading day, the cumulative total net inflow into Spot Bitcoin ETFs had declined to $57.38 billion.
| DATE | COIN | OPEN | CLOSE | CHANGE % | ETF Flow (mil$) |
|---|---|---|---|---|---|
| 14-Nov-2025 | BTC | 99,618 | 94,731 | -4.90% | -492.1 |
| 17-Nov-2025 | BTC | 94,445 | 92,108 | -2.47% | -254.6 |
| 18-Nov-2025 | BTC | 92,108 | 92,914 | 0.87% | -372.8 |
| 19-Nov-2025 | BTC | 92,914 | 91,455 | -1.57% | 75.4 |
| 20-Nov-2025 | BTC | 91,455 | 86,534 | -5.38% | -903.2 |
| Total for November 14–20, 2025 | -13.13% | -1,947.3 | |||
The period between November 14 and 20 stood out as one of the most severe outflow periods in recent months. Increasing uncertainty and risk aversion on the macro side, in particular, accelerated outflows from Spot Bitcoin ETFs. While the limited inflows on November 19 signaled a slight easing of selling pressure, the record outflow of $903.2 million the following day showed that the market is not yet ready to stabilize. In the short term, stronger inflows into ETFs could create a recovery ground for Bitcoin. However, if the current outflow trend continues, selling pressure and volatility on the price could increase.
Ethereum spot ETF
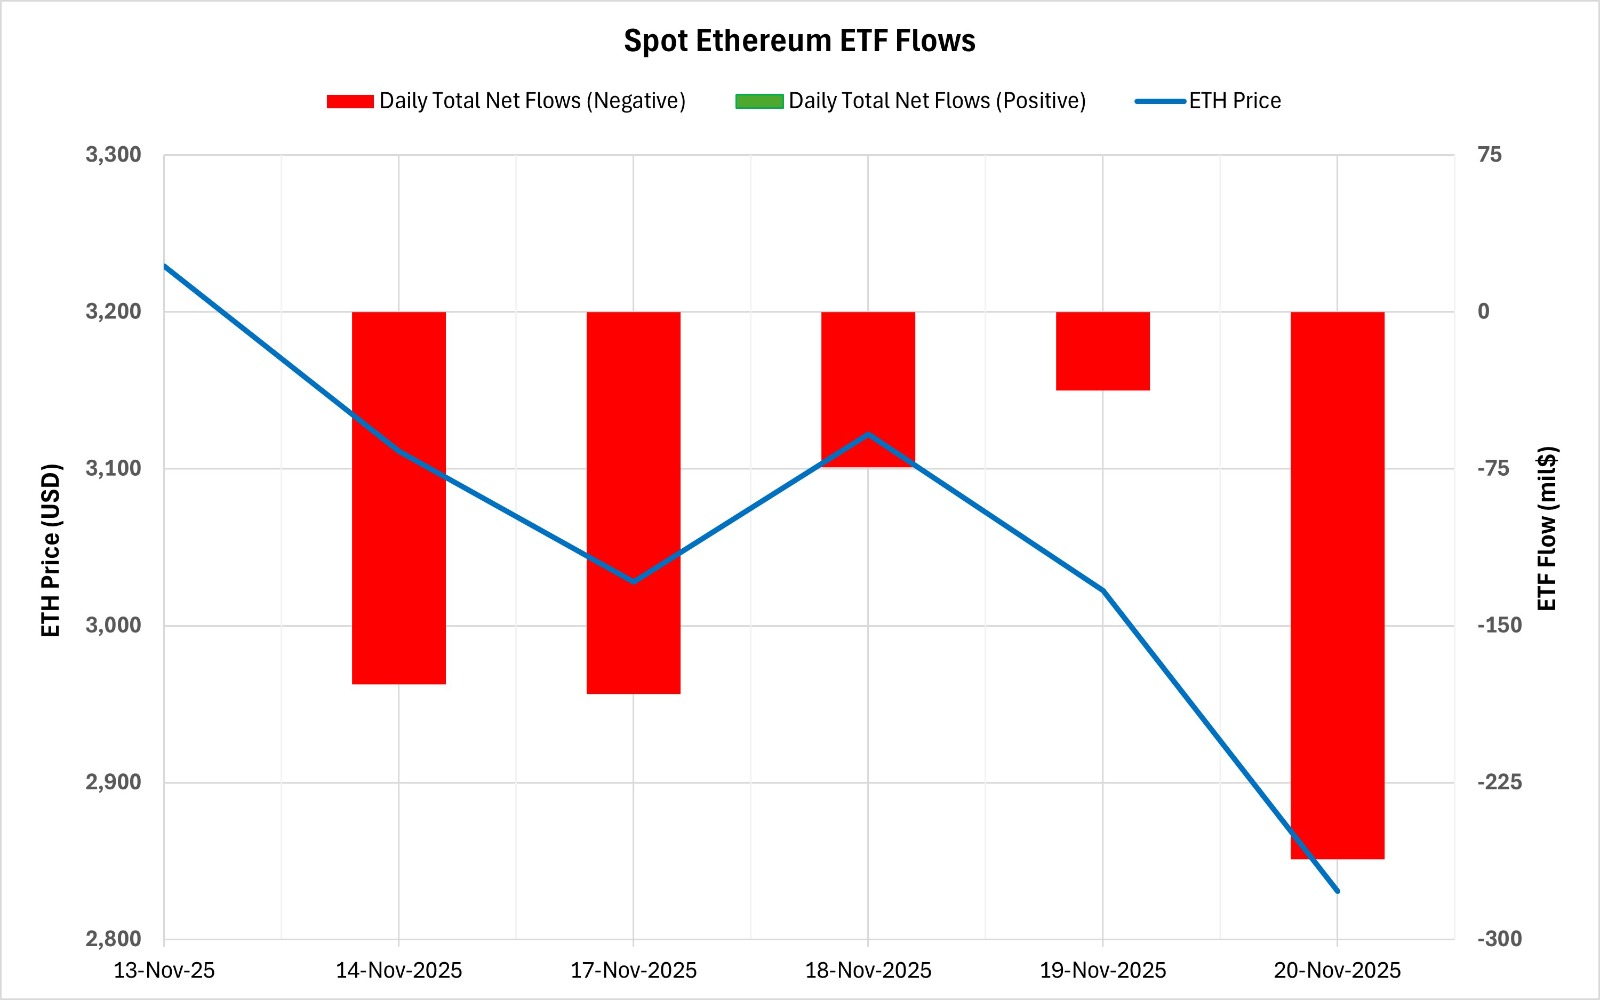
Source: Darkex Research Department
Between November 14-20, 2025, Spot Ethereum ETFs saw a total net outflow of $733.8 million. There were no positive flows during this period, and the series of negative flows rose to eight trading days, making it one of the weakest periods of the year. The highest outflows by fund were from BlackRock ETHA and Fidelity FETH. As of the 336th trading day, the cumulative total net inflow for Spot Ethereum ETFs declined to 12.595 billion dollars.
| DATE | COIN | OPEN | CLOSE | CHANGE % | ETF Flow (mil$) |
|---|---|---|---|---|---|
| 14-Nov-2025 | ETH | 3,229 | 3,111 | -3.65% | -177.9 |
| 17-Nov-2025 | ETH | 3,101 | 3,028 | -2.36% | -182.7 |
| 18-Nov-2025 | ETH | 3,028 | 3,122 | 3.12% | -74.2 |
| 19-Nov-2025 | ETH | 3,122 | 3,022 | -3.20% | -37.4 |
| 20-Nov-2025 | ETH | 3,022 | 2,831 | -6.34% | -261.6 |
| Total for Nov 14–20, 2025 | -12.34% | -733.8 | |||
Ethereum opened at $3,229 on November 14 and closed at $2,831 on November 20. During this period, ETH lost 12.34% of its value. The acceleration of the price decline in tandem with ETF outflows indicated a strengthening risk-averse stance among institutional investors. A distinctly cautious stance persists in investor behavior. If fund flows rebalance in the coming days and inflows begin to be seen, the ETF side could create ground for a short-term recovery for Ethereum. However, if the outflow trend continues, selling pressure on Ethereum could intensify further.
Bitcoin Options Distribution
Source: Laevitas
BTC: Notional: $3.33B | Put/Call: 0.63 | Max Pain: $99K
Deribit Data: Deribit data shows that BTC option contracts with a notional value of approximately $3.33 billion expire today. At the same time, looking at the risk transformation over the next week based on the last 24 hours’ data, put options are dominating over call options in terms of risk hedging. When examining expected volatility (IV), it is below realized volatility (RV). On the other hand, the negative spread metric indicates low risk appetite in the market and shows that put options are expensive. Skew values are also pointing downward today and for the coming week.
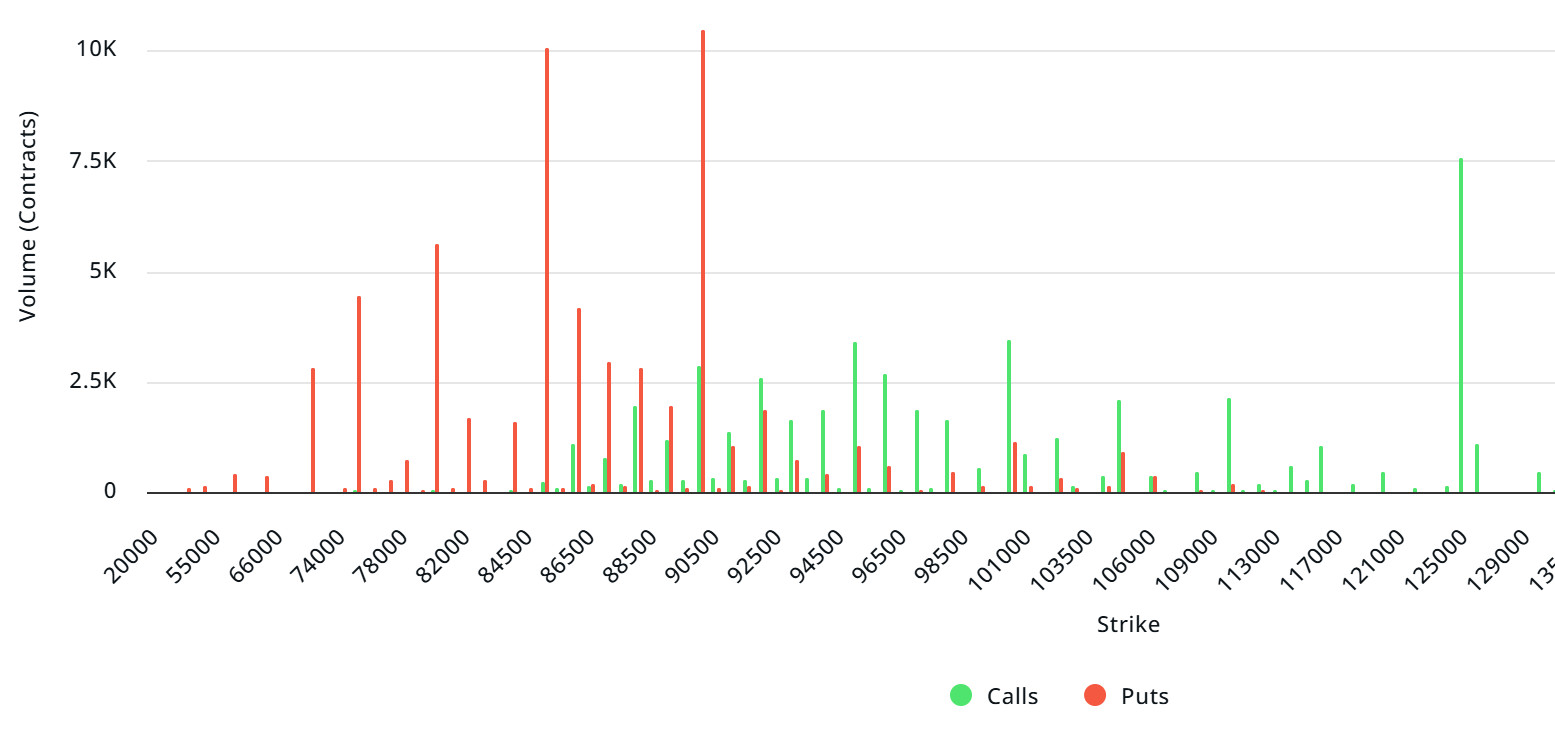
Laevitas Data: Examining the chart, we see that put options are concentrated in a wide band between $70,000 and $90,000. Call options, on the other hand, are spread across a wide base between $95,000 and $125,000. At the same time, the $90,000 level appears to be resistance, while the $85,000 level ( ) appears to be support. On the other hand, there are 10.49K put options at the $90,000 level, peaking here and showing a decrease in put volume after this level. Furthermore, 7.57K call option contracts peak at the $125,000 level. Looking at the options market, we see that put contracts dominate on a daily and weekly basis.
Option Maturity:
Call/Put Ratio and Maximum Pain Point: Looking at options based on the latest 7-day data from Laevitas, the number of call options increased by approximately 2% compared to last week, reaching 159.27K. In contrast, the number of put options increased by 23% compared to last week, reaching 168.71K. The put/call ratio for options is set at 0.63. This indicates that there is less demand for call options than put options among investors. Bitcoin’s maximum pain point is seen at $99,000. BTC is currently priced at $85,500, and if it fails to break above the pain point of $99,000, a continued decline is foreseeable.
Ethereum Options Distribution
Source: Laevitas
ETH: $0.53 B notional | Put/Call: 0.77 | Max Pain: $3,200
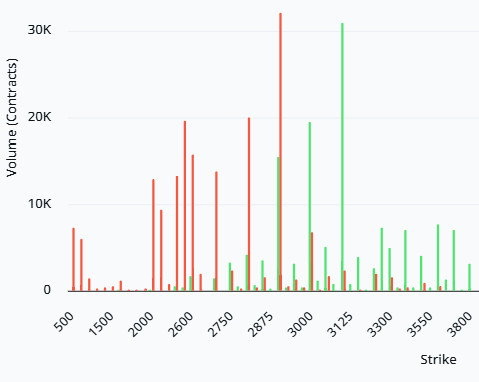
Laevitas Data: Looking at the data in the chart, we see that put options are concentrated in a fairly wide band, particularly between the $2,500 and $3,000 price levels. The highest put volume is at the $2,900 level, with approximately 33K contracts. On the other hand, a notable concentration in call options is found at the $3,000 to $3,600 levels. The $3,100 level stands out in particular, with a high call volume of approximately 31K contracts.
Deribit Data: First, we see that ATM volatility has risen to 117.57, marking an increase of over 51% on a daily basis. Therefore, we can say that uncertainty has increased significantly. The 25-delta risk- -reversal falling to -7.52 and declining by over 17.5% on a daily basis also supports this picture. We clearly see that the market is paying much higher premiums for put options rather than call options. This strongly reflects the expectation that “downside risk is increasing” in pricing.
Looking at volume, call volume shows a limited increase, while put volume has surged by over 253%. We generally attribute volume expansion of this scale to two reasons: either traders have strengthened their bearish expectations, or existing long positions have begun to be aggressively hedged. However, in both cases, it strongly signals that risk appetite has decreased and that pricing is likely to be neutral-negative.
Option Expiration:
Ethereum options with a nominal value of $0.53 billion expired on November 21. The Max Pain level was calculated at $3,200, while the put/call ratio stood at 0.77.
Legal Notice
The investment information, comments, and recommendations contained in this document do not constitute investment advisory services. Investment advisory services are provided by authorized institutions on a personal basis, taking into account the risk and return preferences of individuals. The comments and recommendations contained in this document are of a general nature. These recommendations may not be suitable for your financial situation and risk and return preferences. Therefore, making an investment decision based solely on the information contained in this document may not result in outcomes that align with your expectations.
