Active Addresses
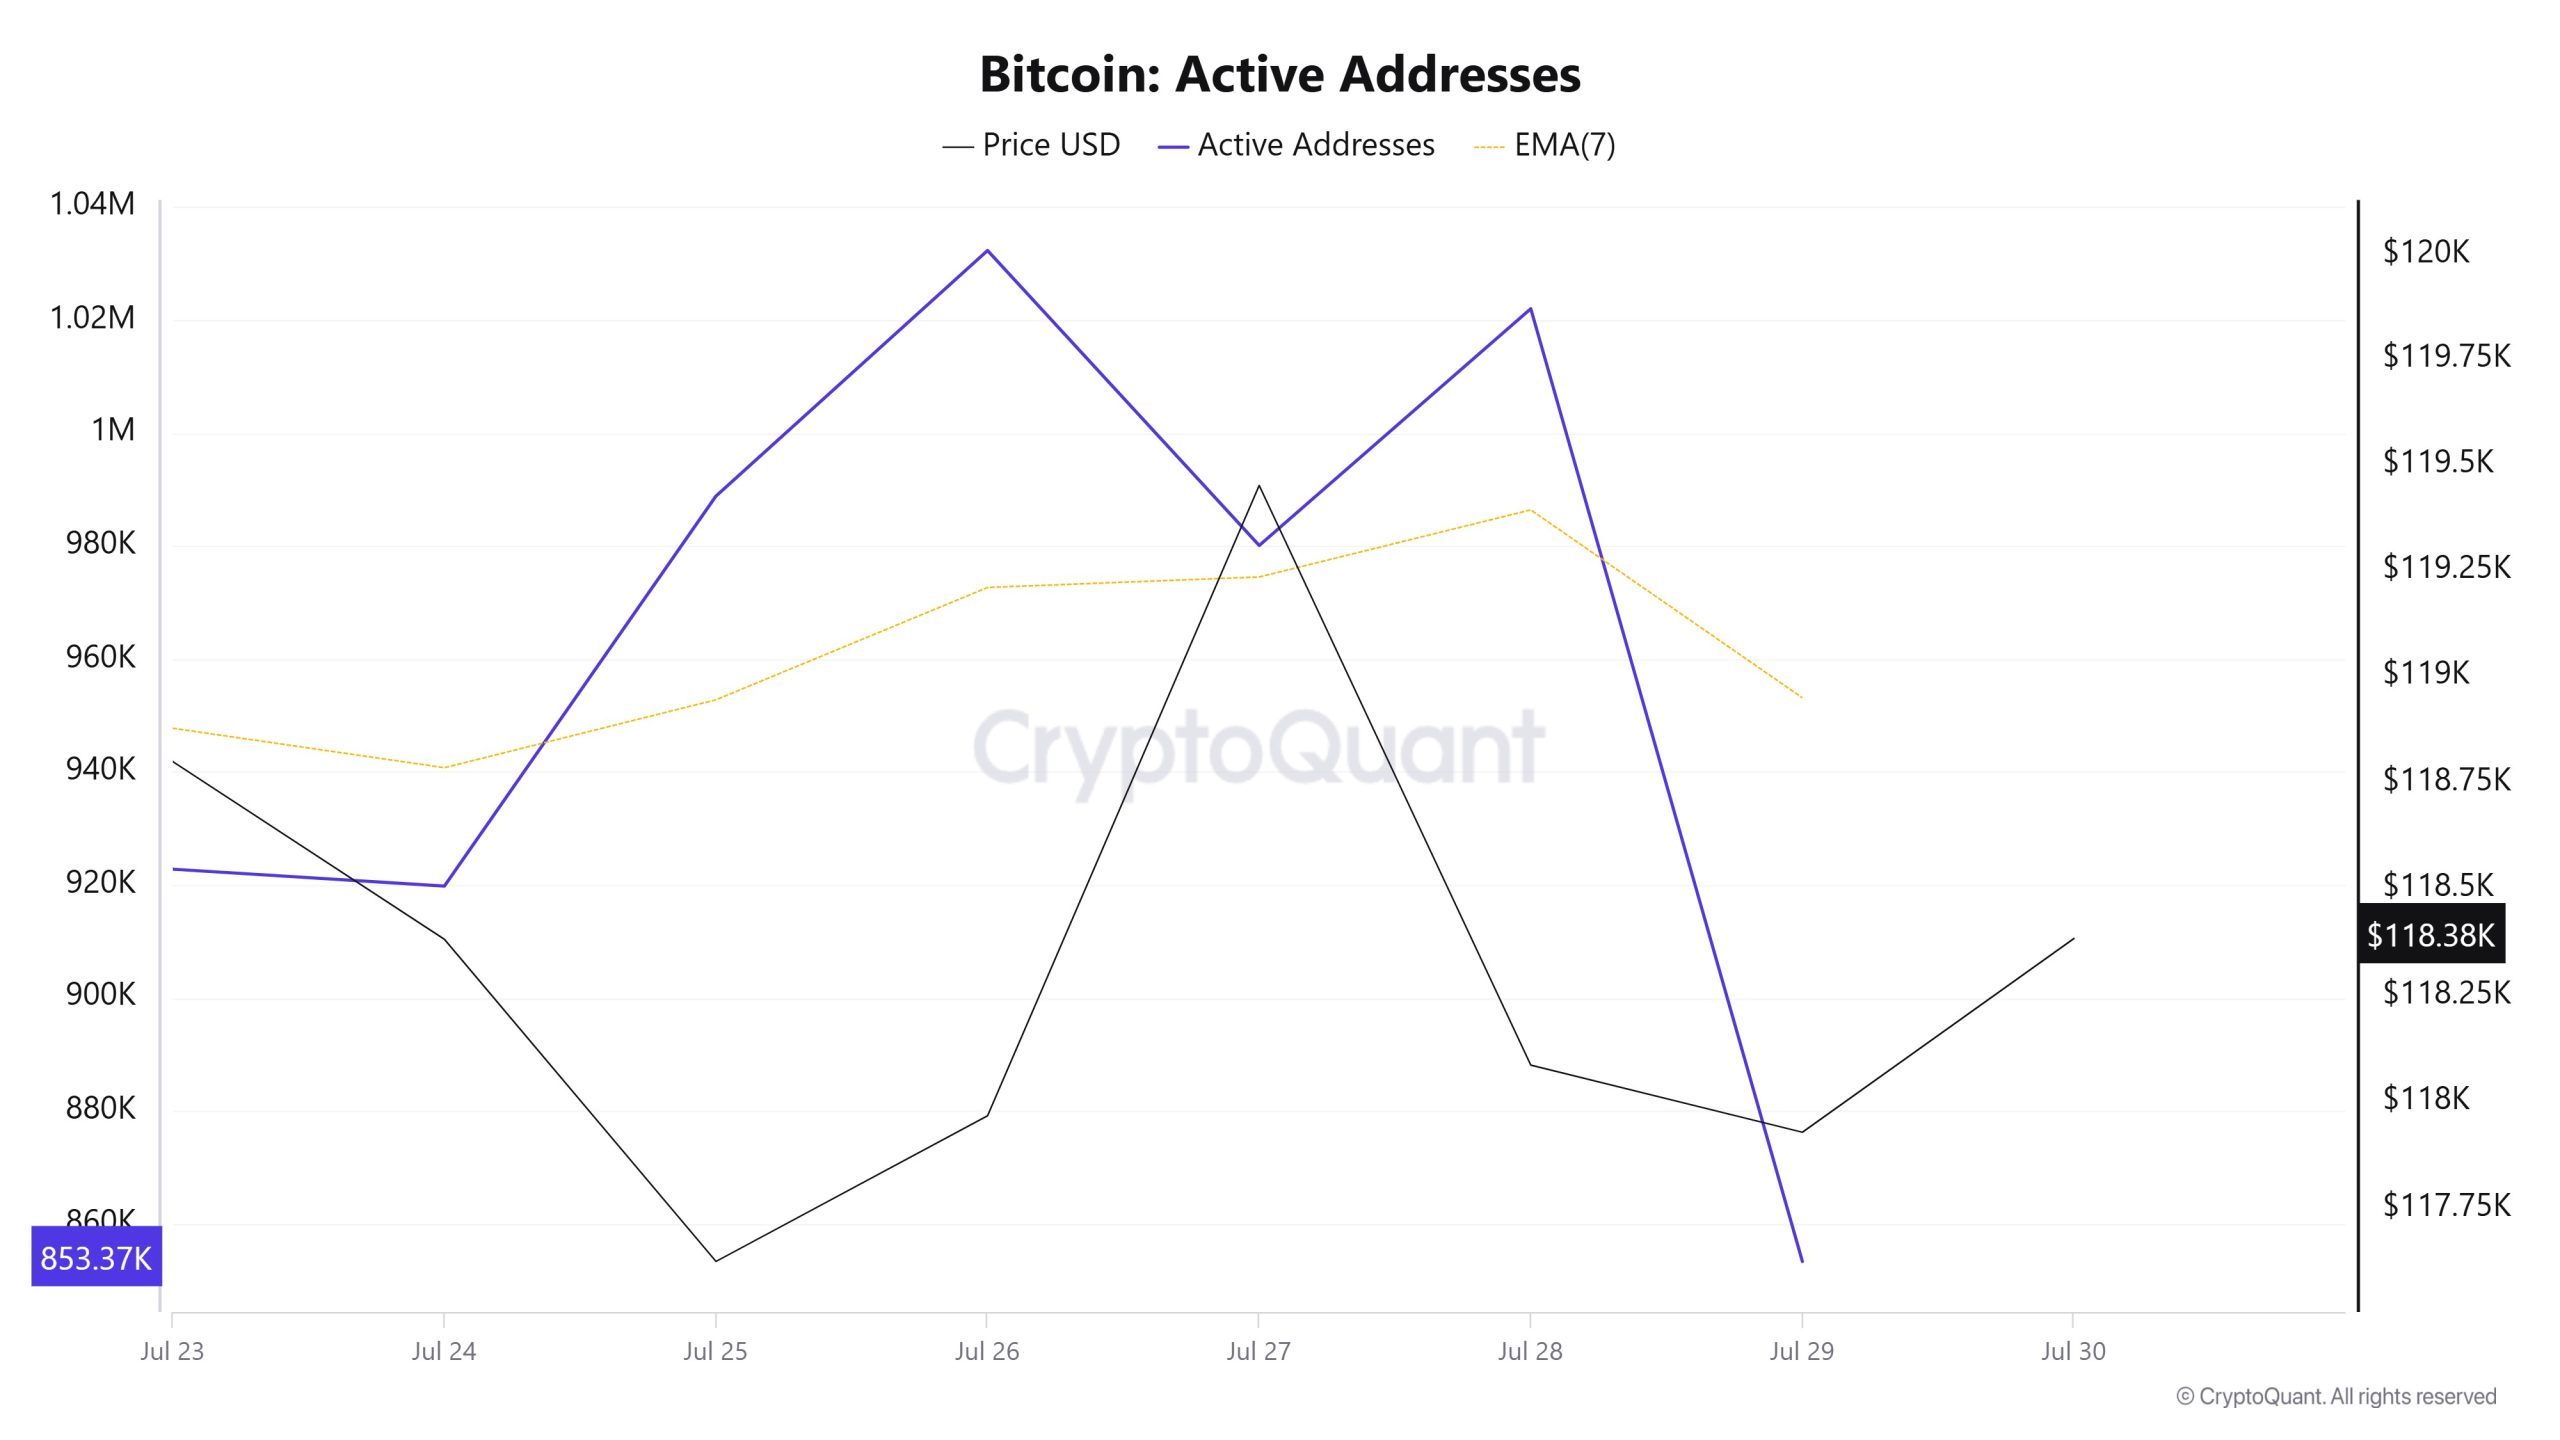
Between July 23-30, 1,032,280 active addresses entered the Bitcoin network. In this process, the Bitcoin price rose up to $118,000. It was observed that the rise in the number of active addresses, especially on July 27, moved the price towards $118,000. From a technical perspective, it is noteworthy that downward movements were experienced at the point where the 7-day simple moving average (SMA) intersected the price on July 26. This technical signal indicates selling pressure on the market.
Active Sending Addresses
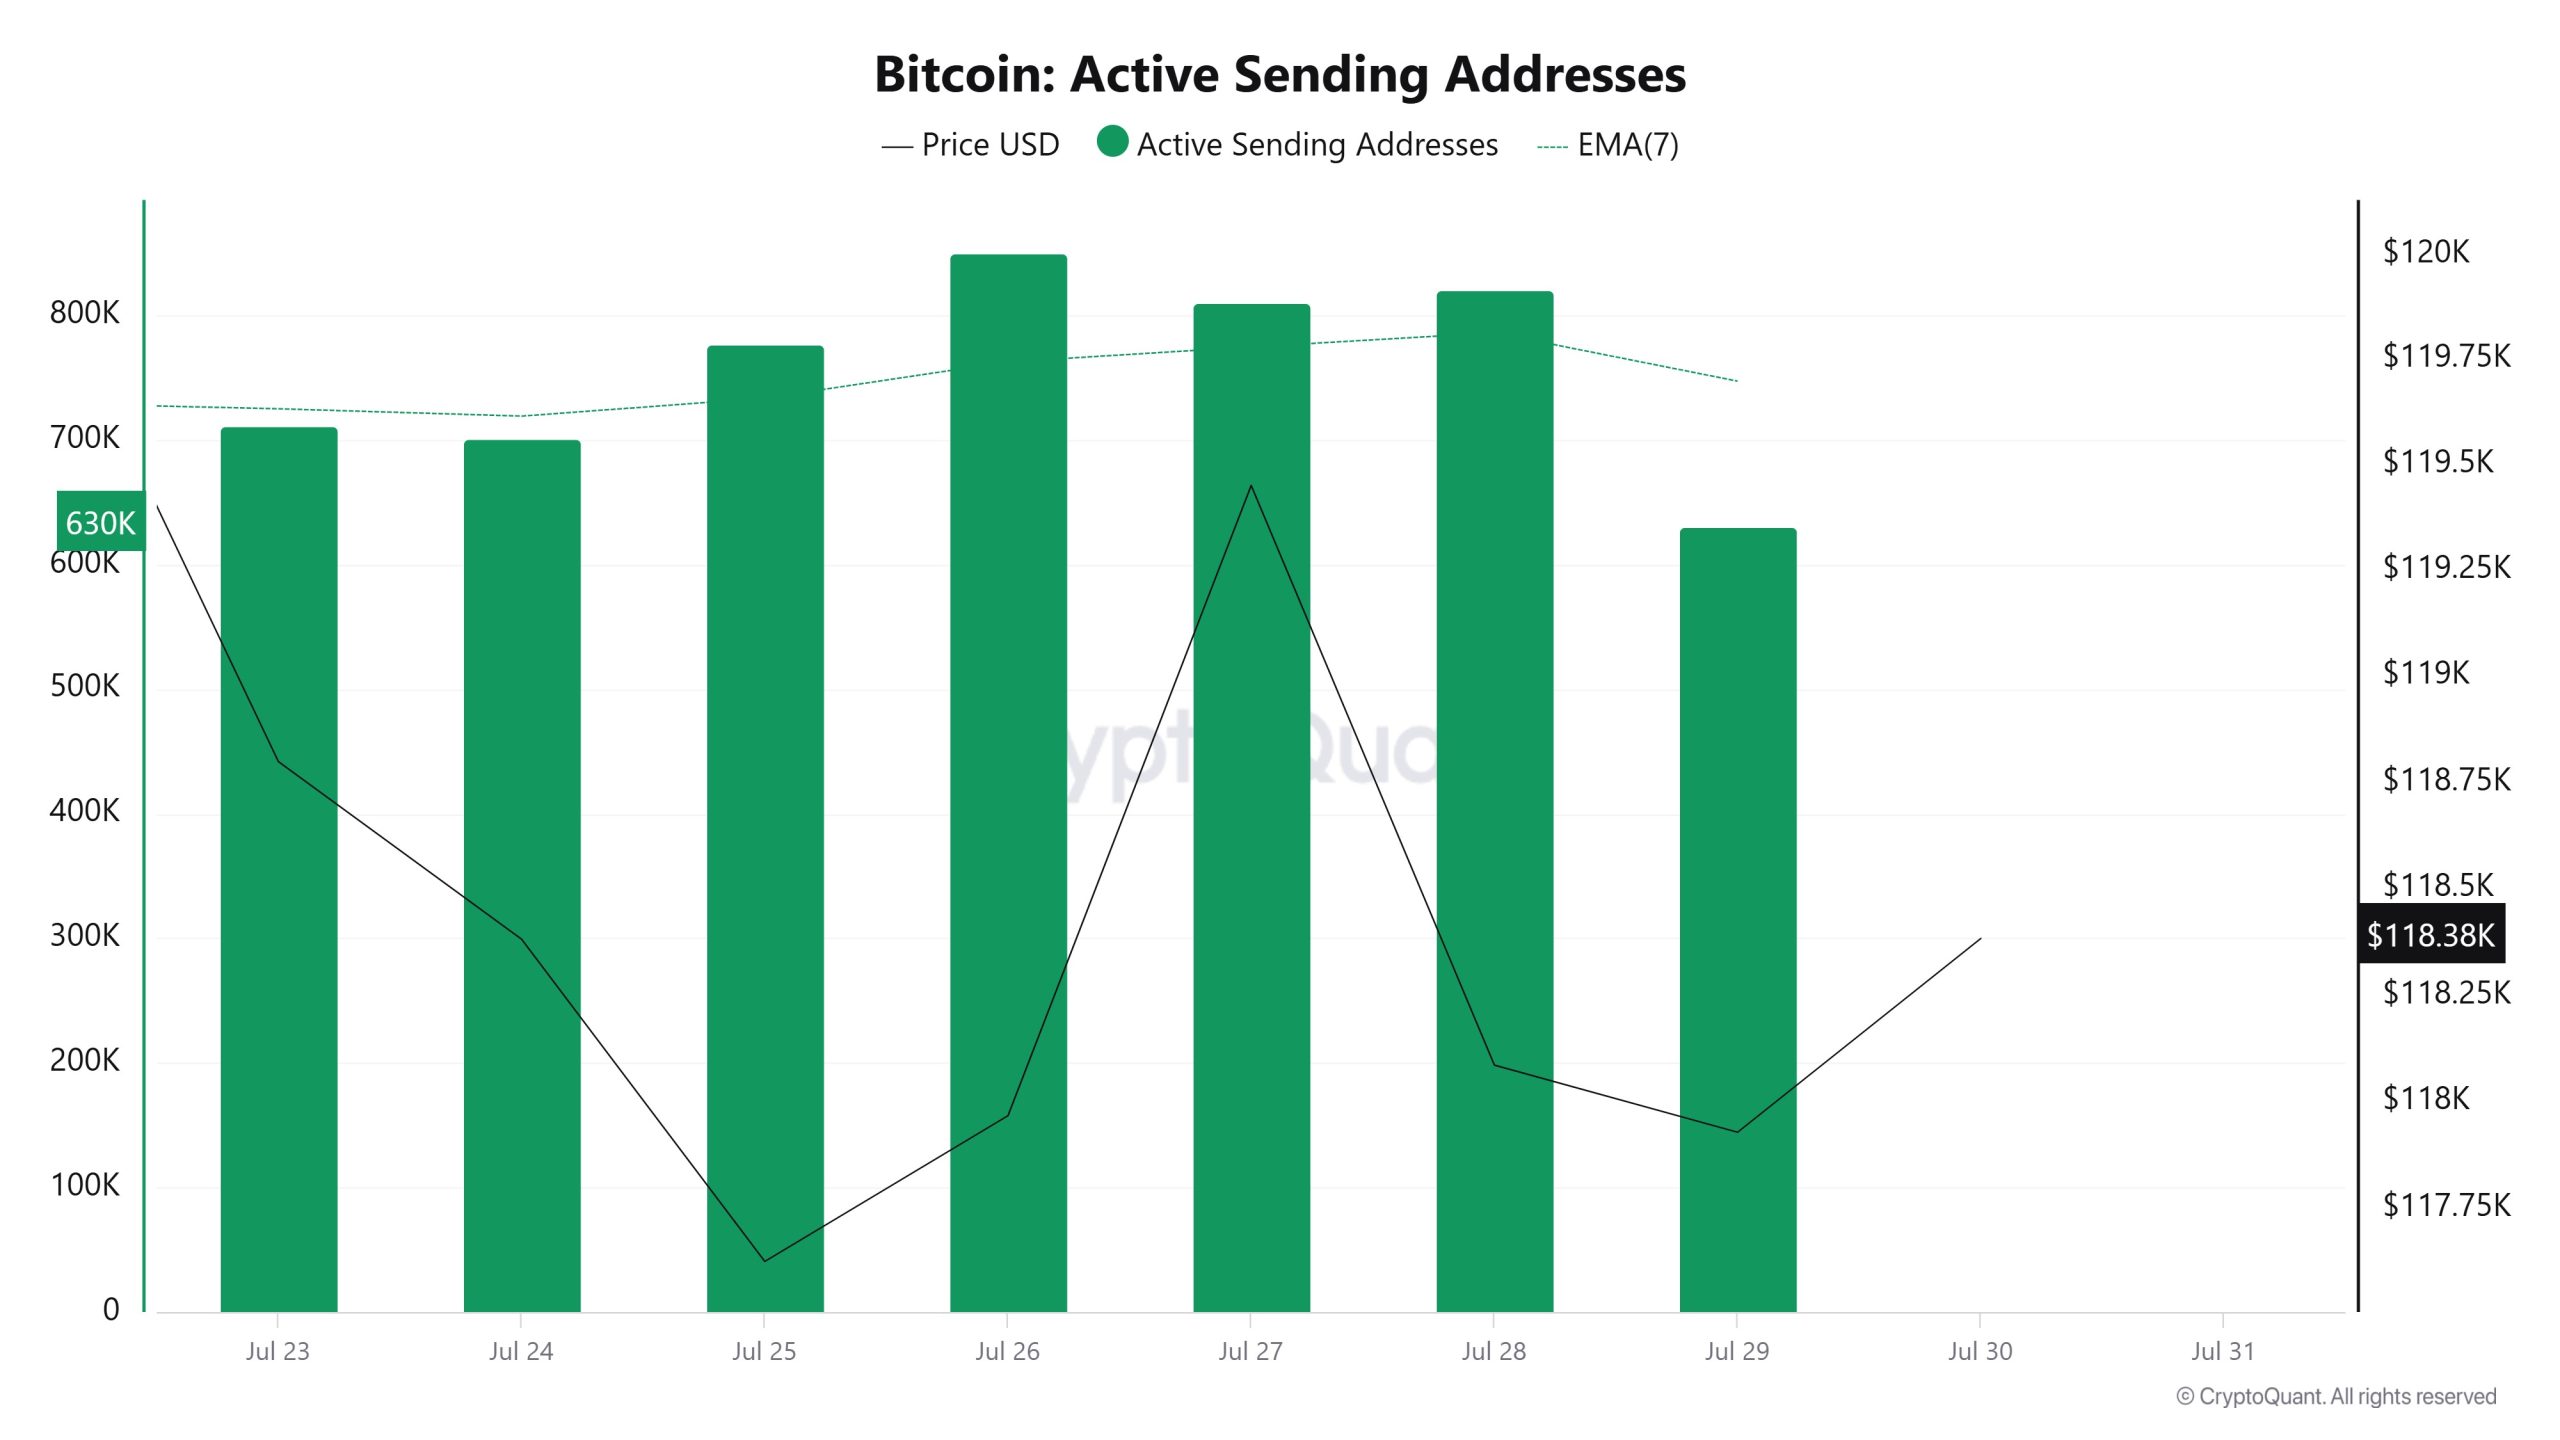
Between July 23 and 30, an upward trend was observed in the “Active Sending Addresses” metric. On the day of the price peak, this metric rose as high as 850,321, indicating that user activity on the Bitcoin network is increasing in parallel with the price.
This data suggests that the $117,000 peak is supported not only by price, but also by on-chain address activity. Overall, the Active Sending Addresses metric trended up and down during this period.
Active Receiving Addresses
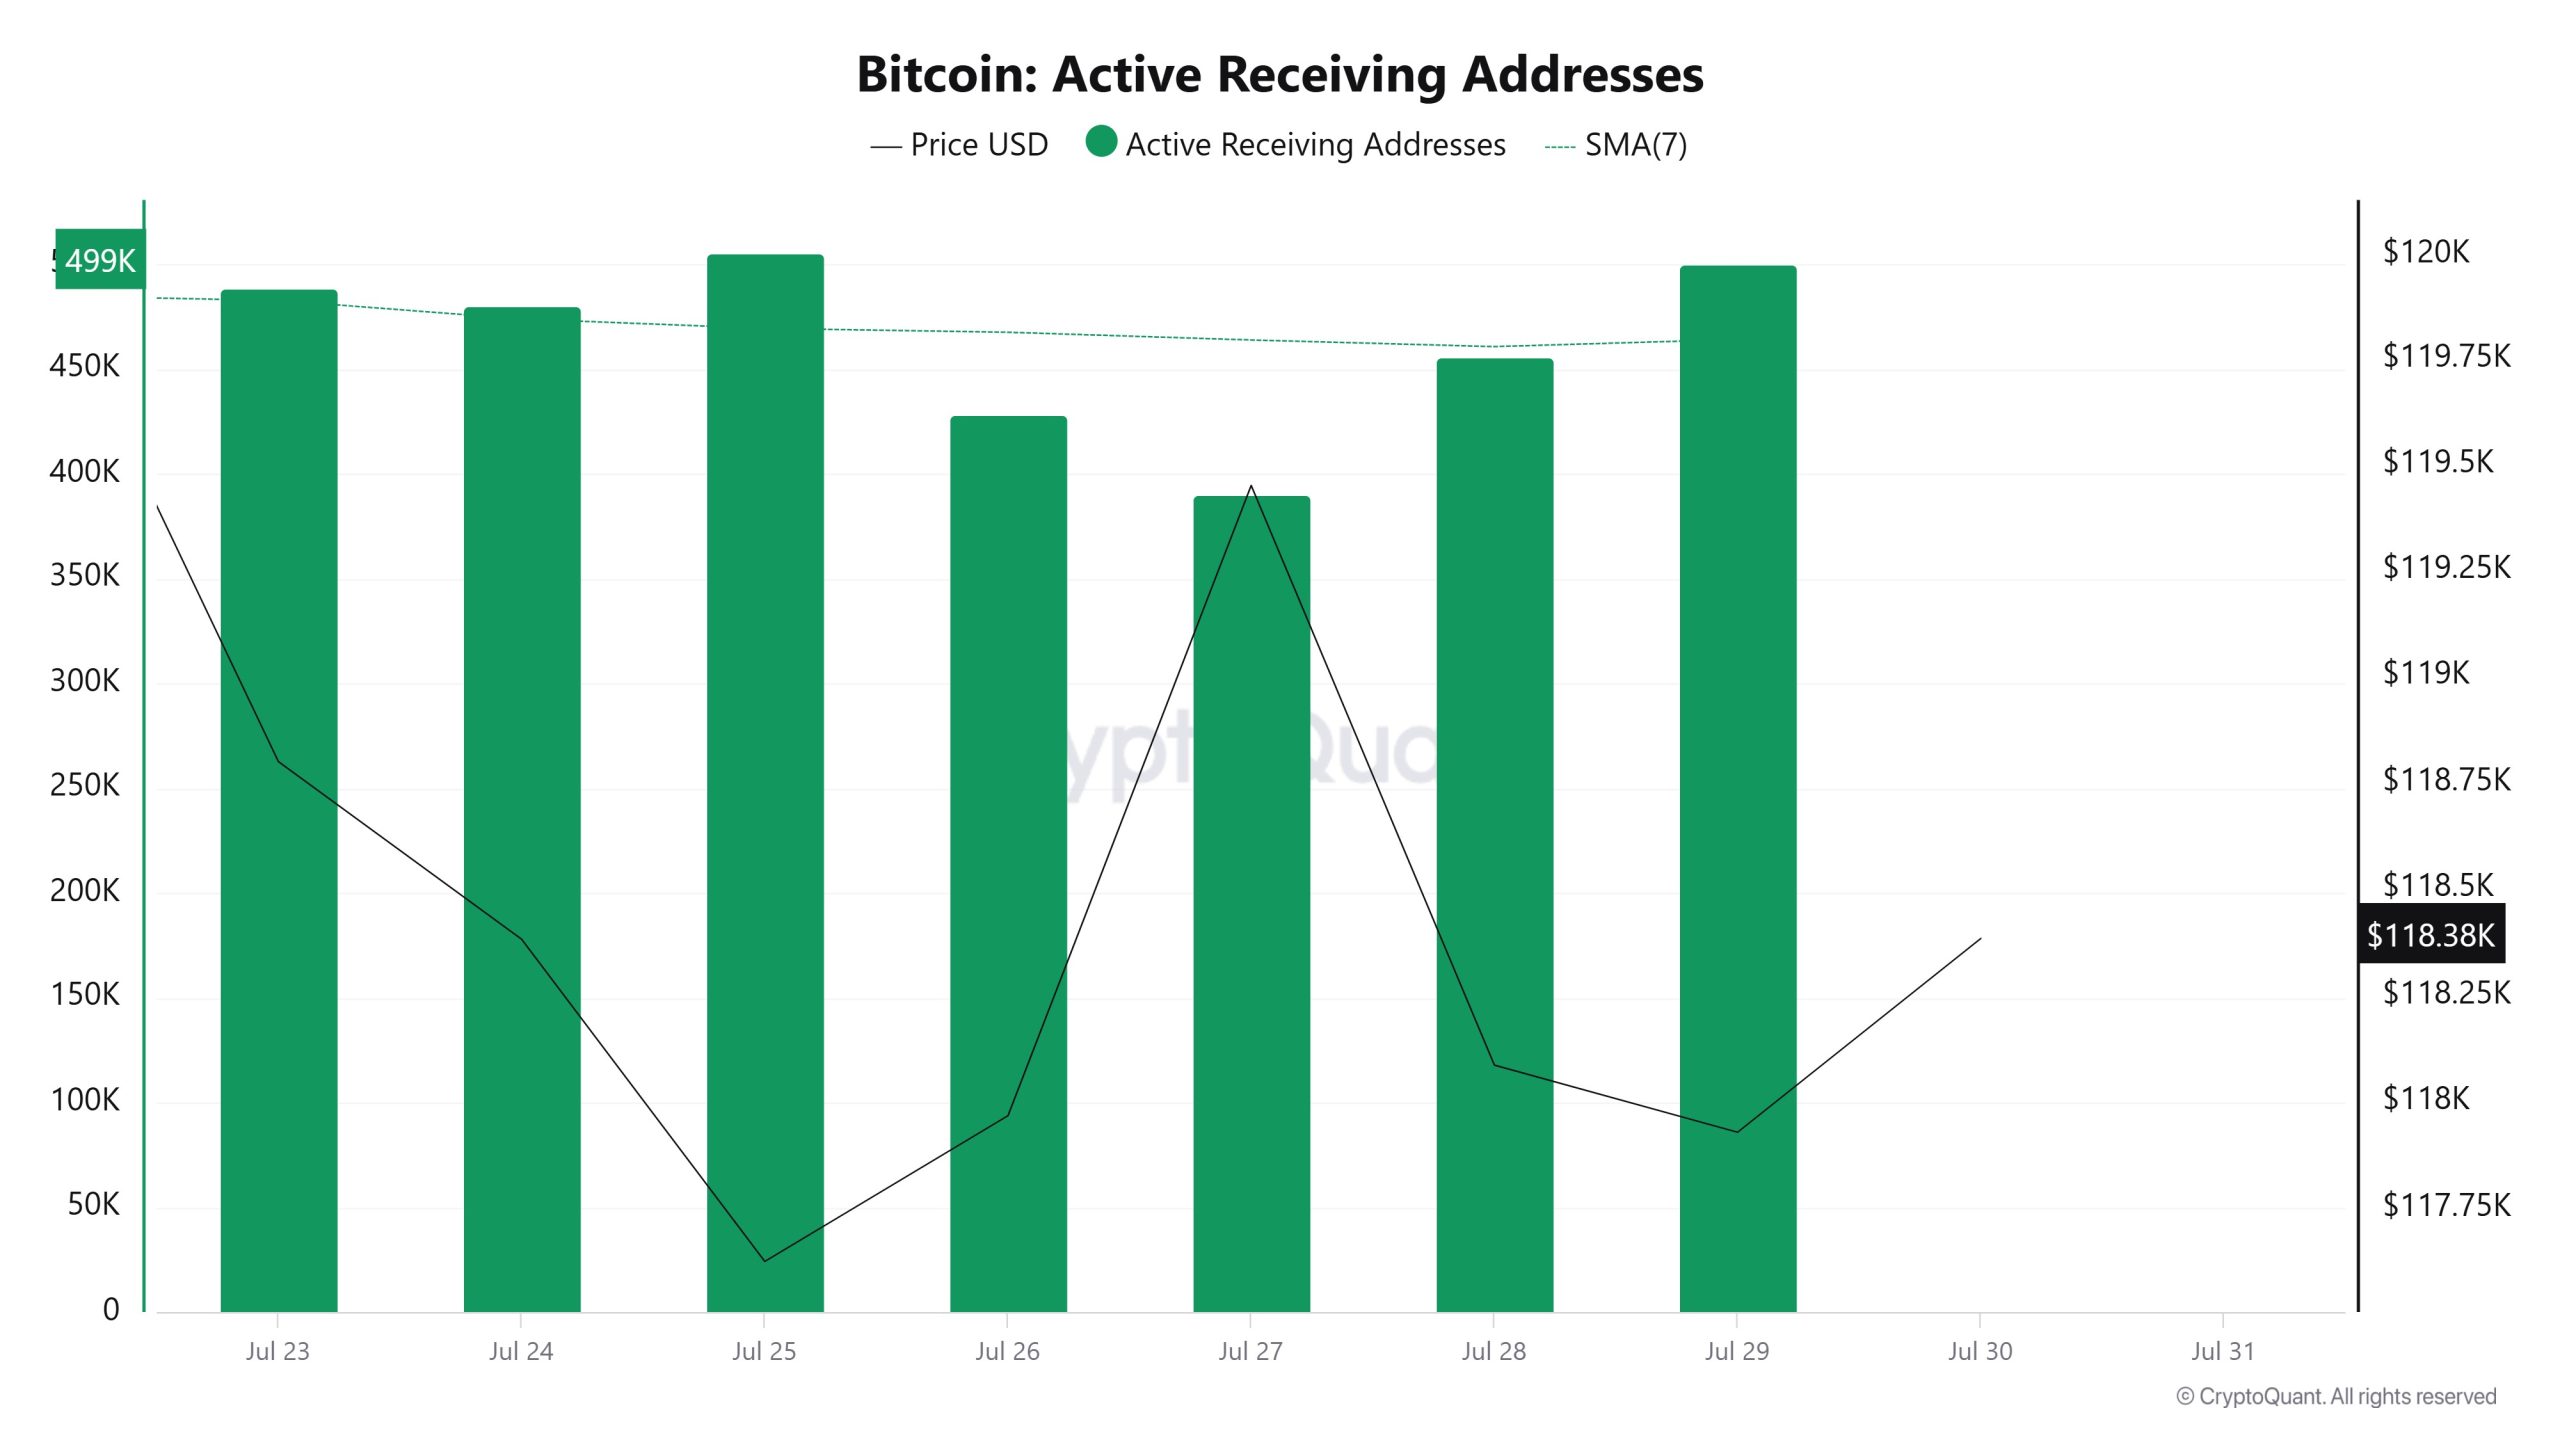
Between July 23rd and July 30th, there was a regular decline in active buy addresses with the Black Line (price line). On the day the price reached its low, active receiving addresses rose as high as 505,315, indicating that buyers were selling Bitcoin at $119,000.
Breakdowns
MRVR
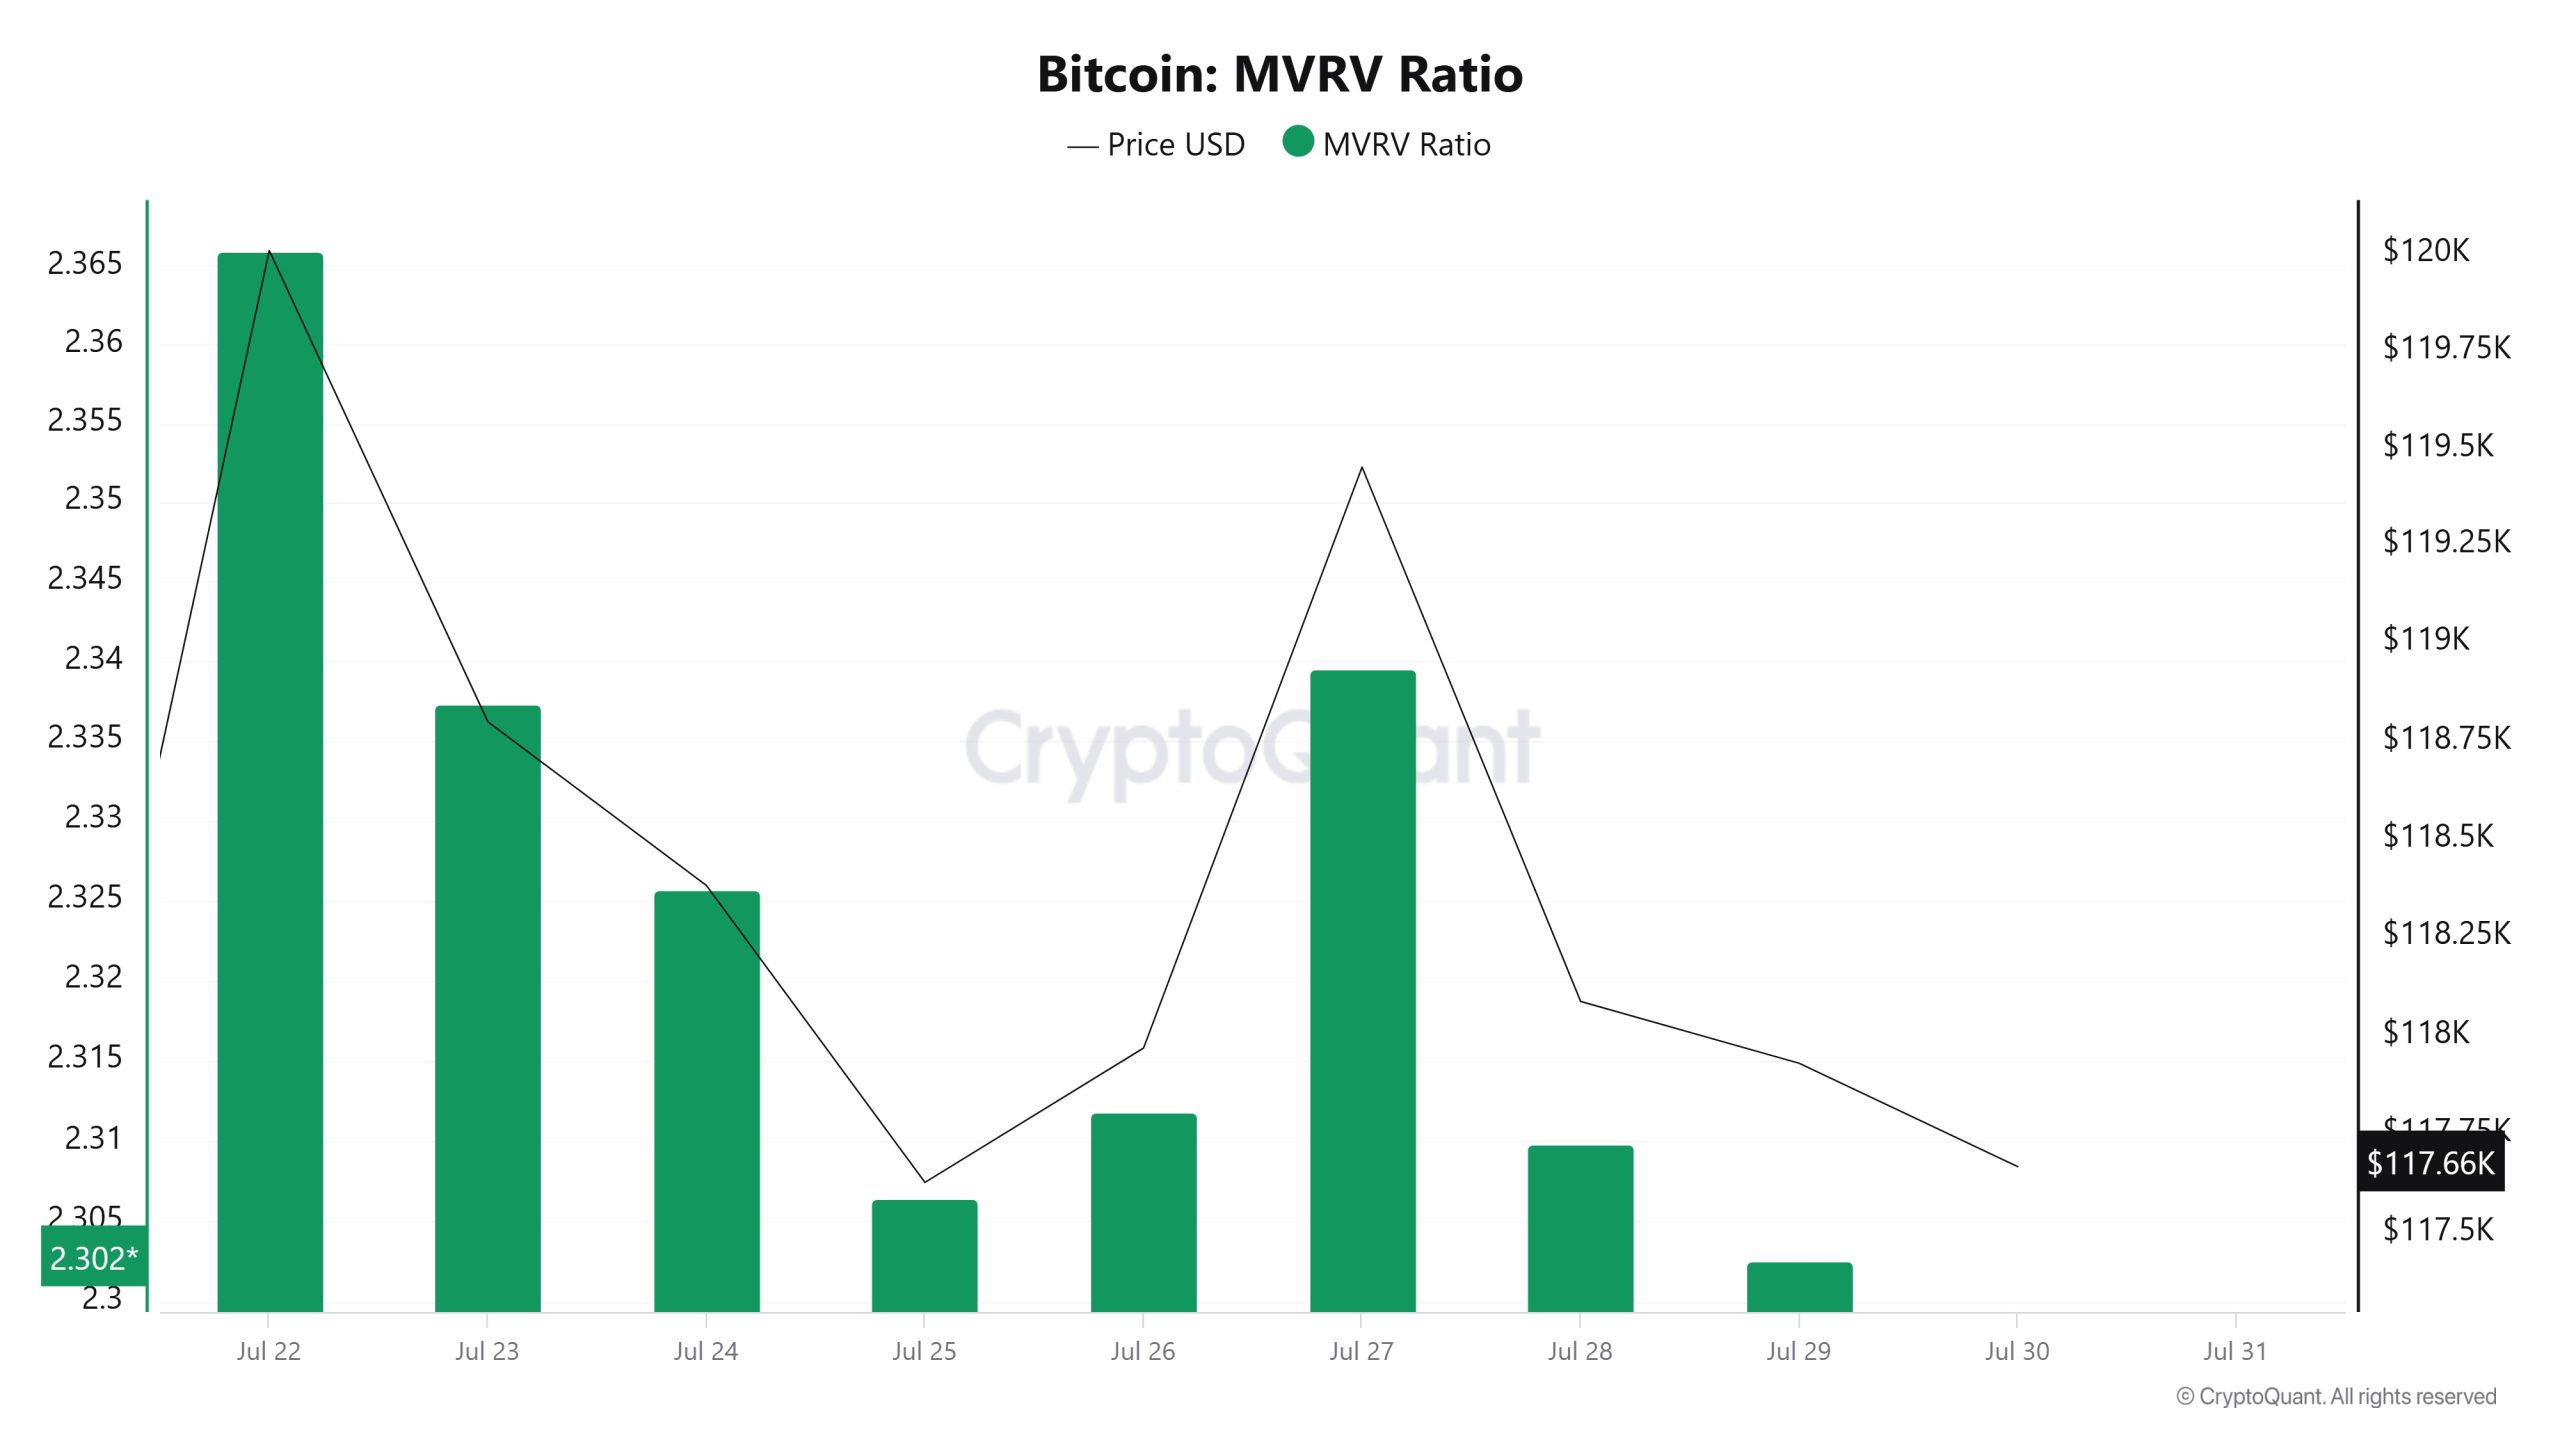
On July 23rd, the Bitcoin price was at 118,798 while the MVRV Ratio was 2.337. As of July 29, the Bitcoin price fell 0.73% to 117,928, while the MVRV Ratio fell 1.50% to 2,302.
Realized Price
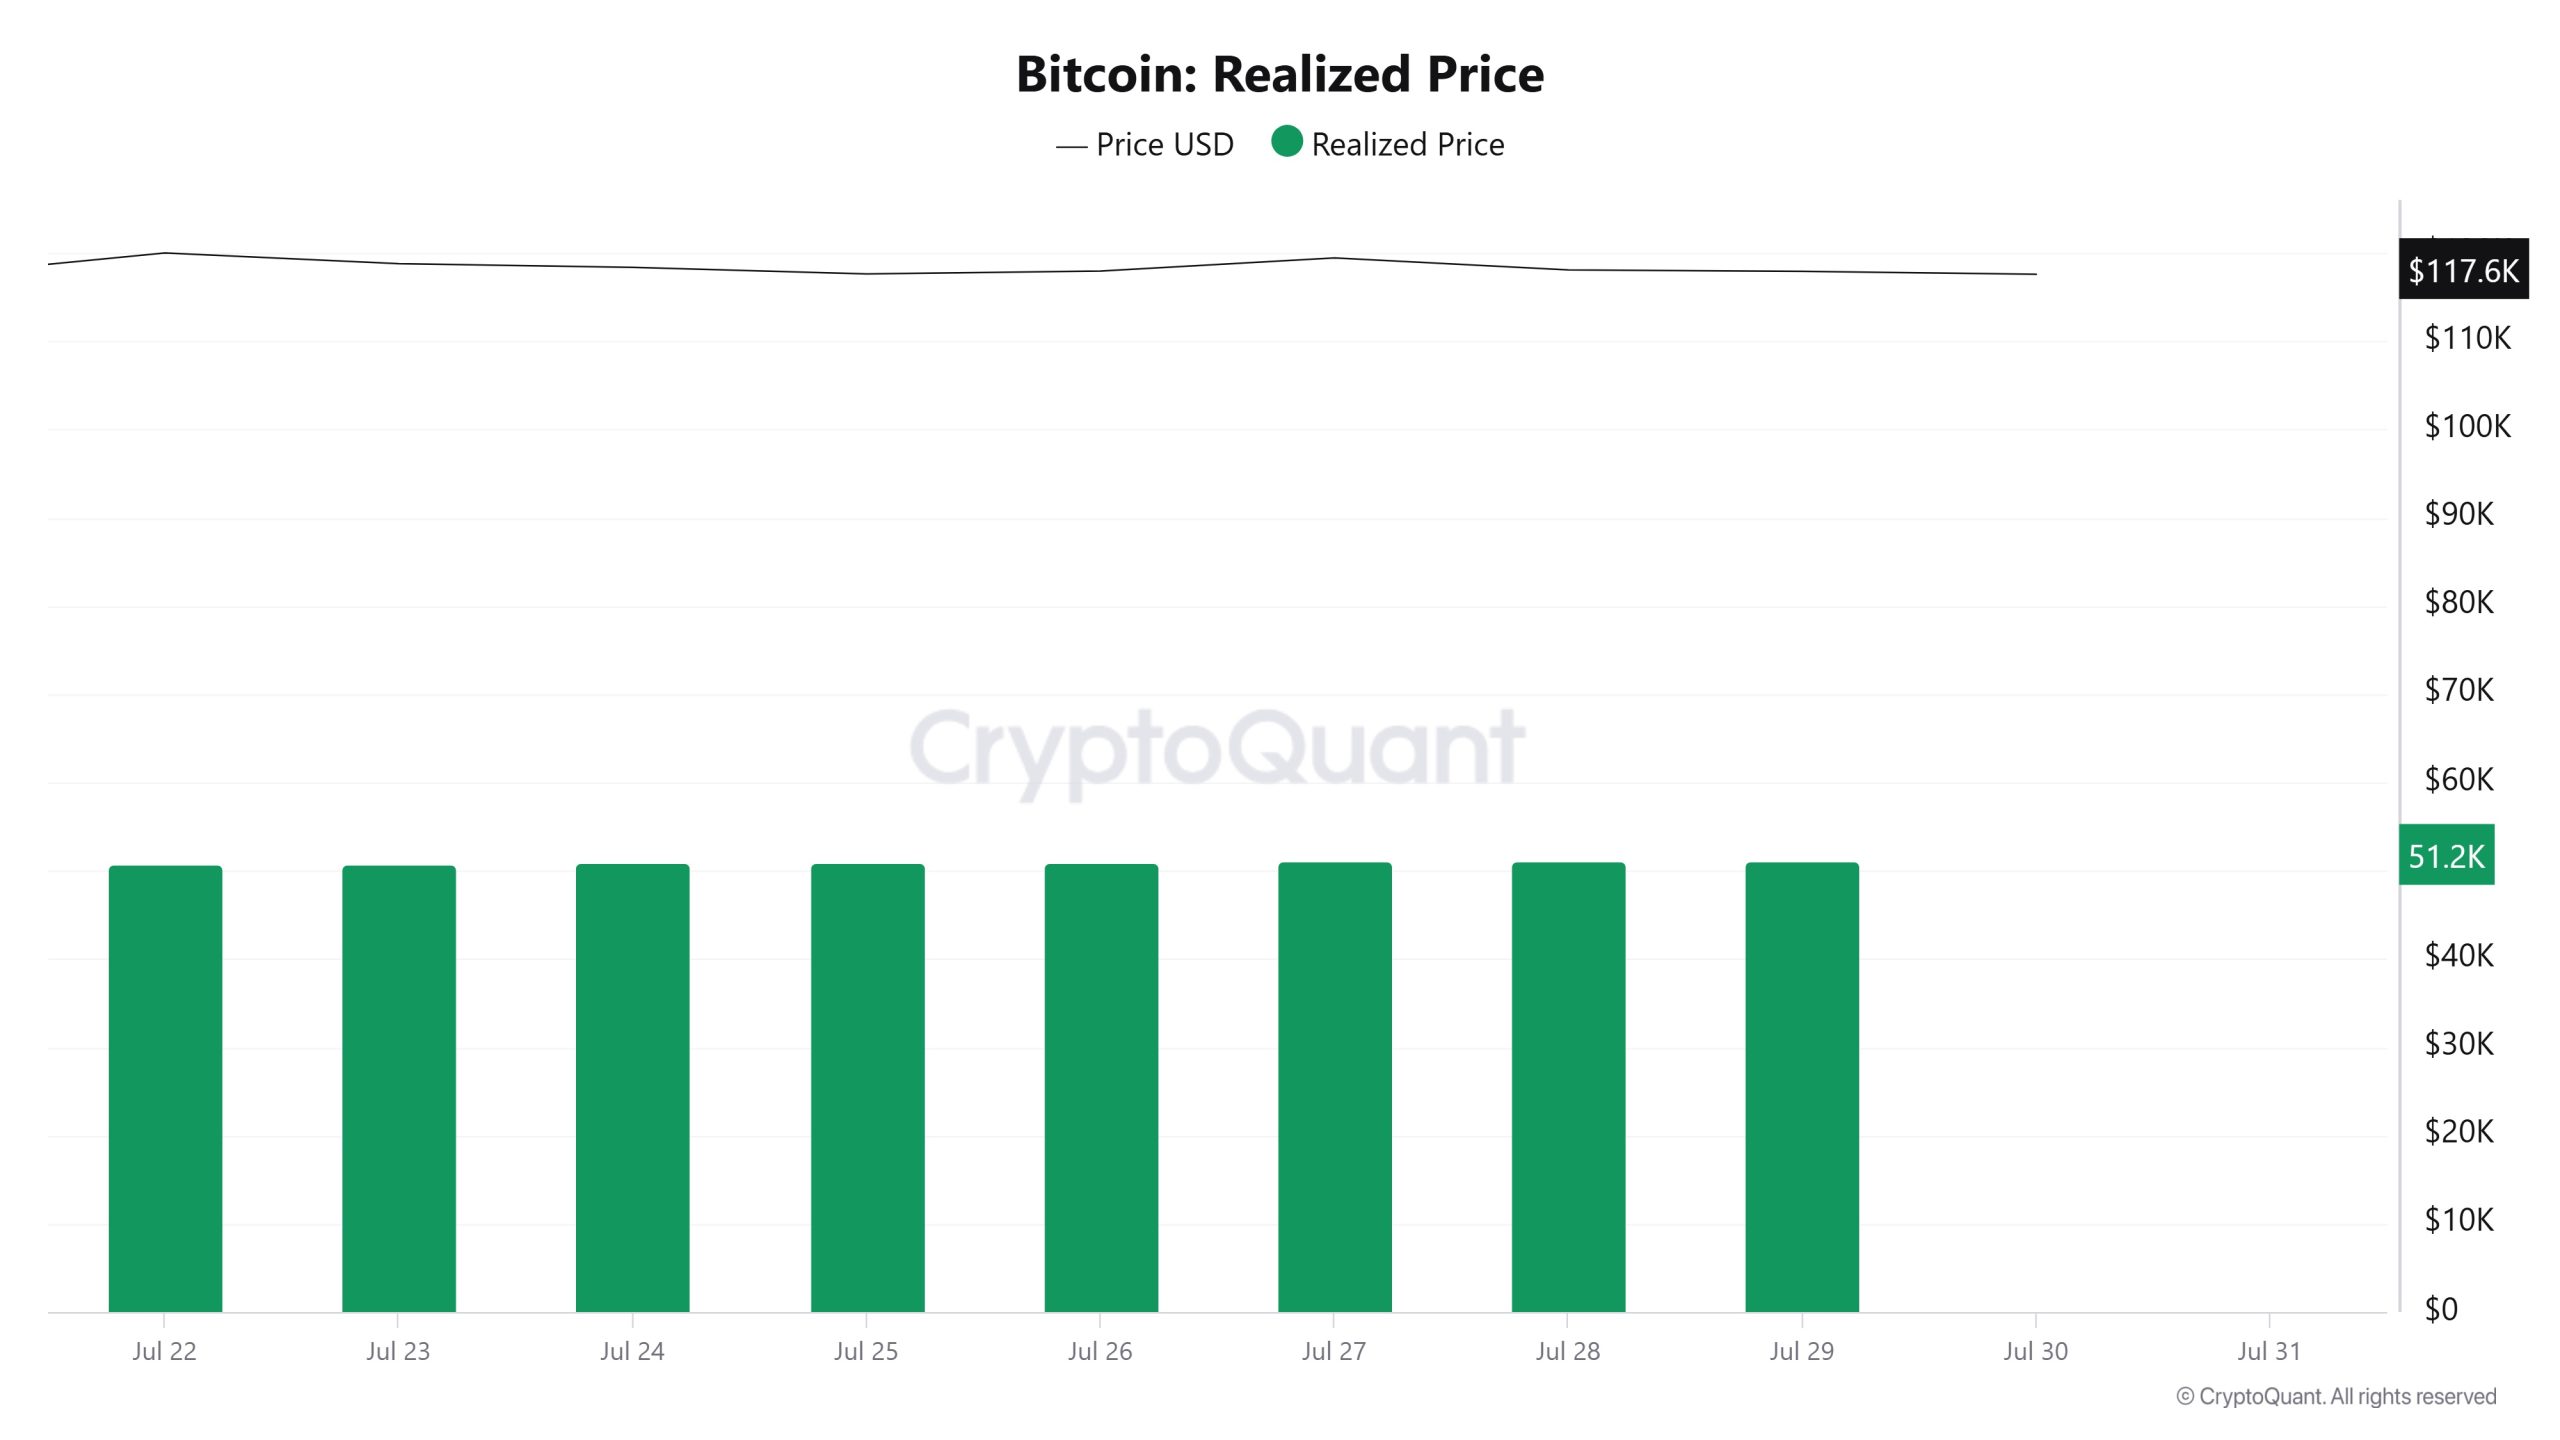
On July 23rd, Bitcoin price was 118,798 while Realized Price was 50,828. As of July 29, Bitcoin price decreased by 0.73% to 117,928, while Realized Price increased by 0.76% to 51,217.
Spent Output Profit Ratio (SOPR)
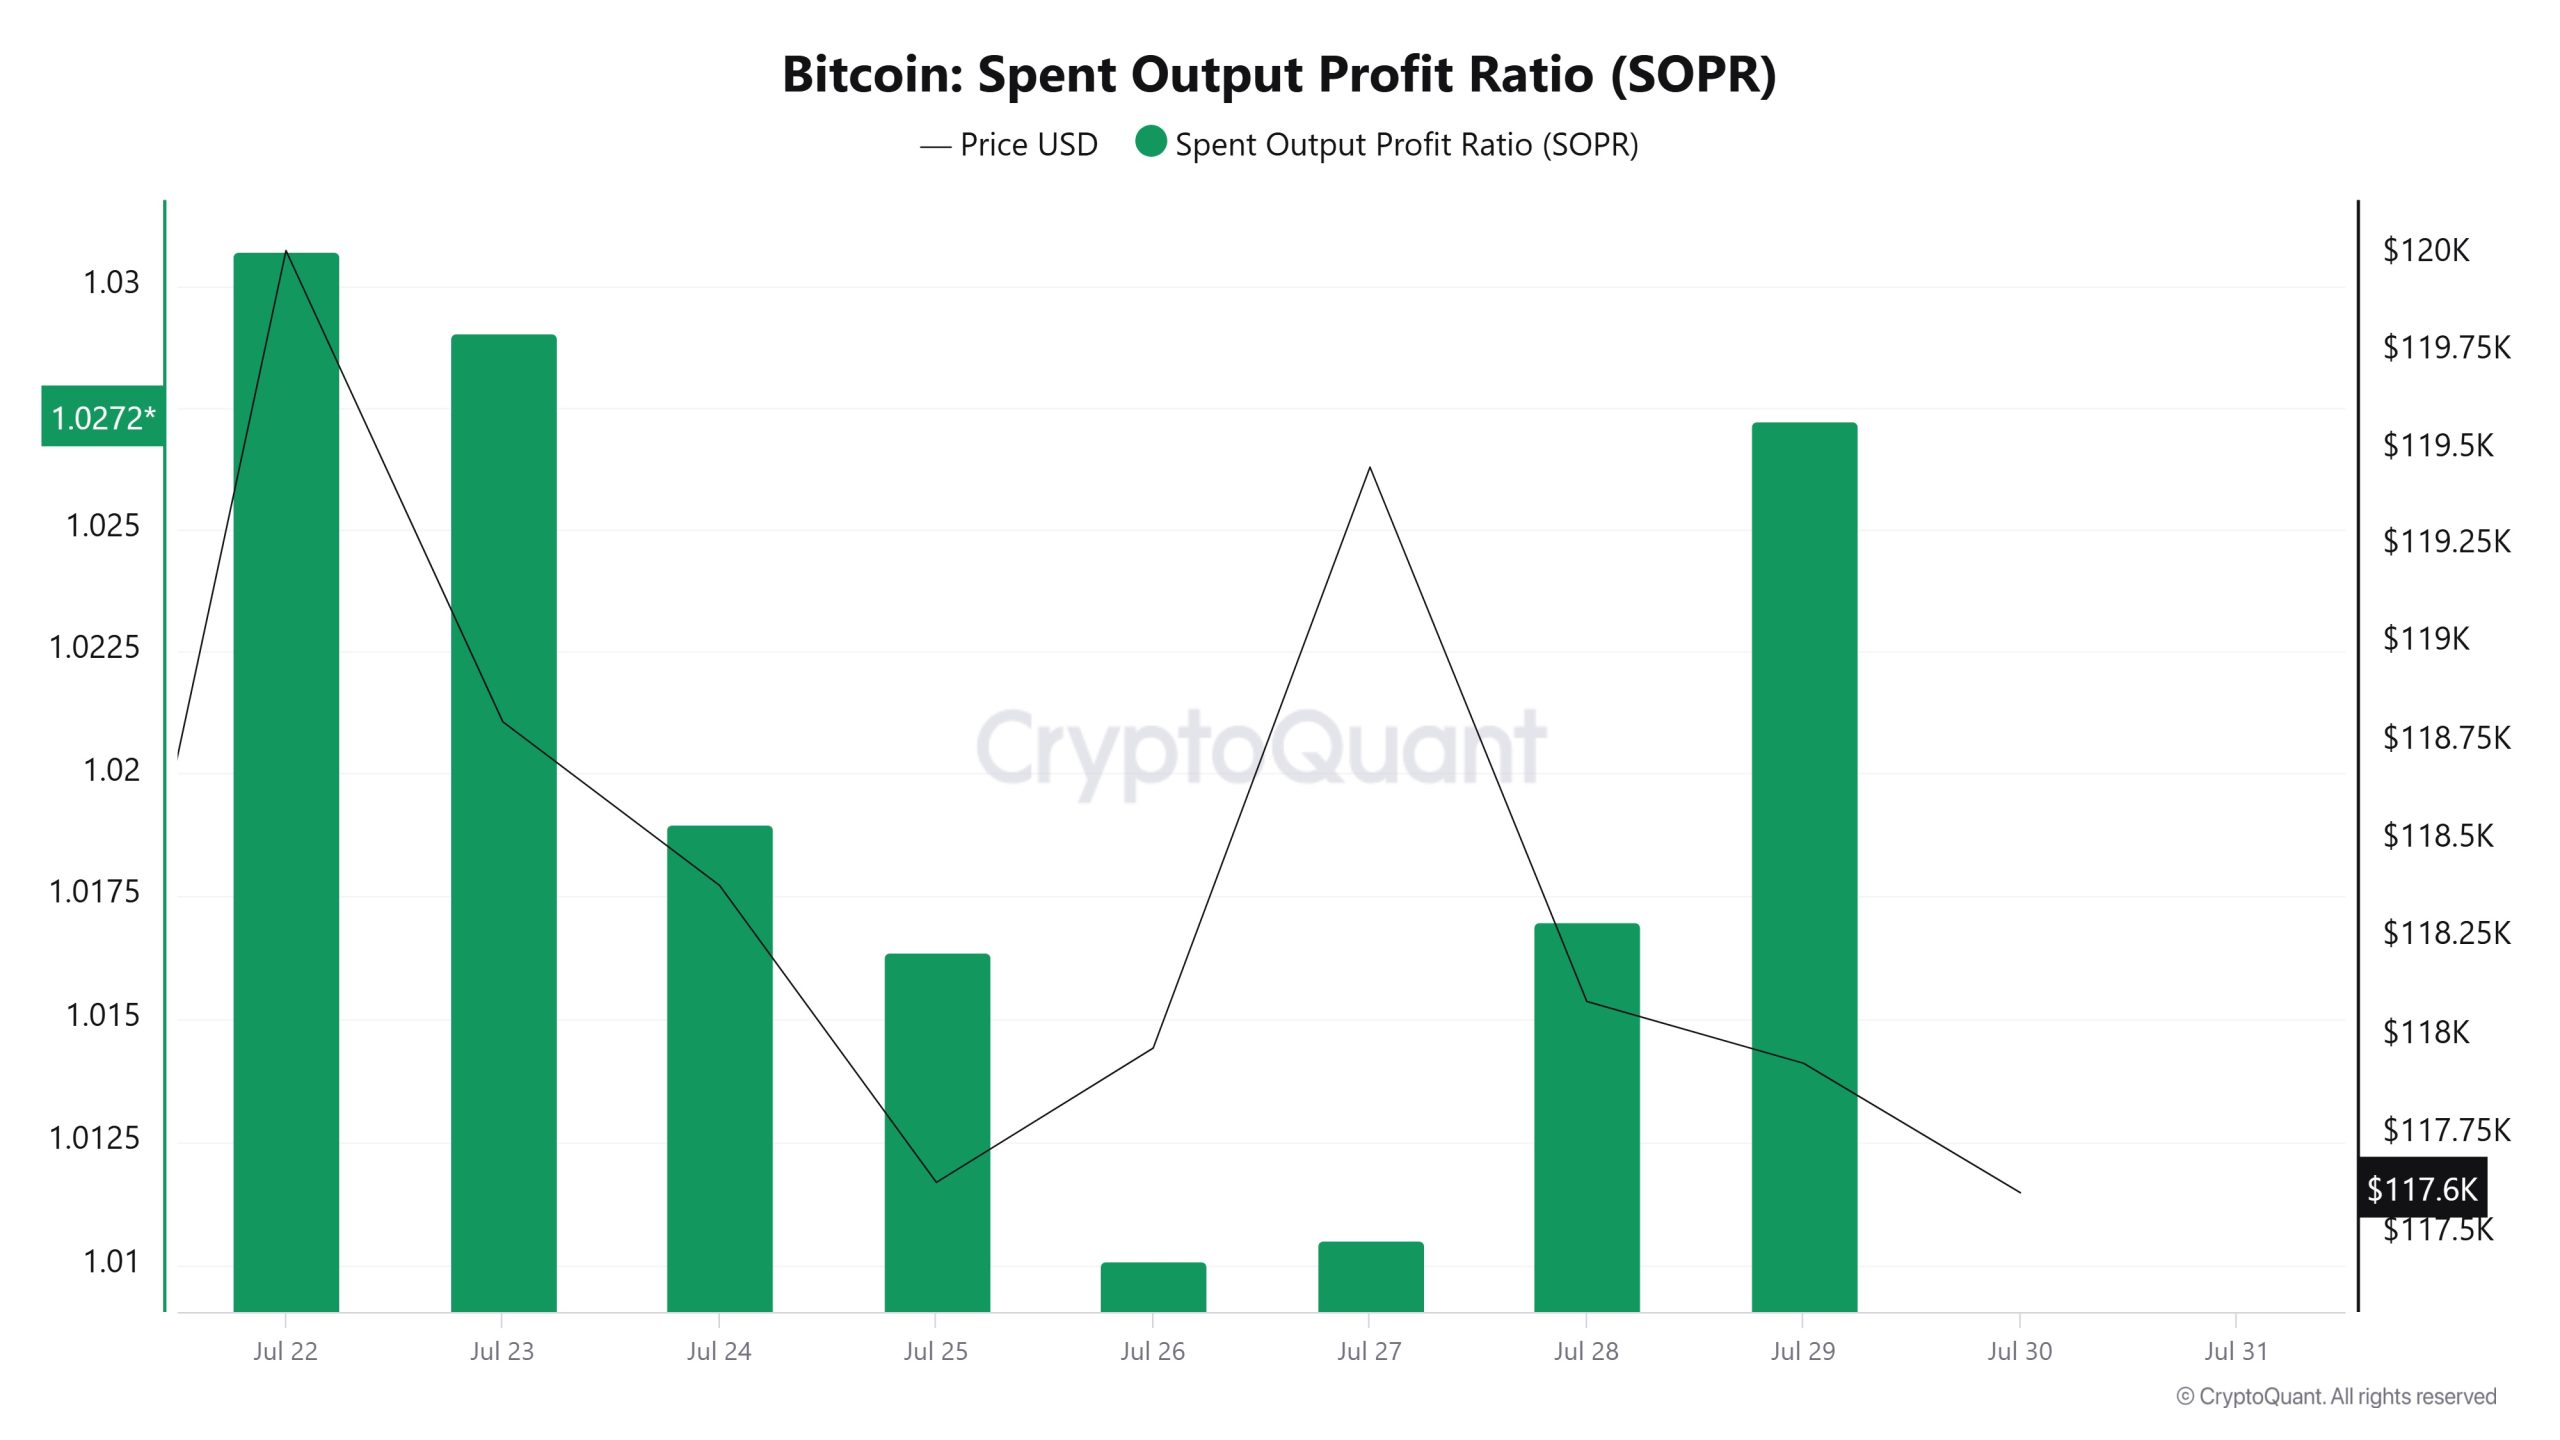
On July 23, the Bitcoin price was at 118,798 while the SOPR metric was at 1,029. As of July 29, the Bitcoin price fell 0.73% to 117,928, while the SOPR metric fell 0.19% to 1,027.
Derivatives
Open Interest
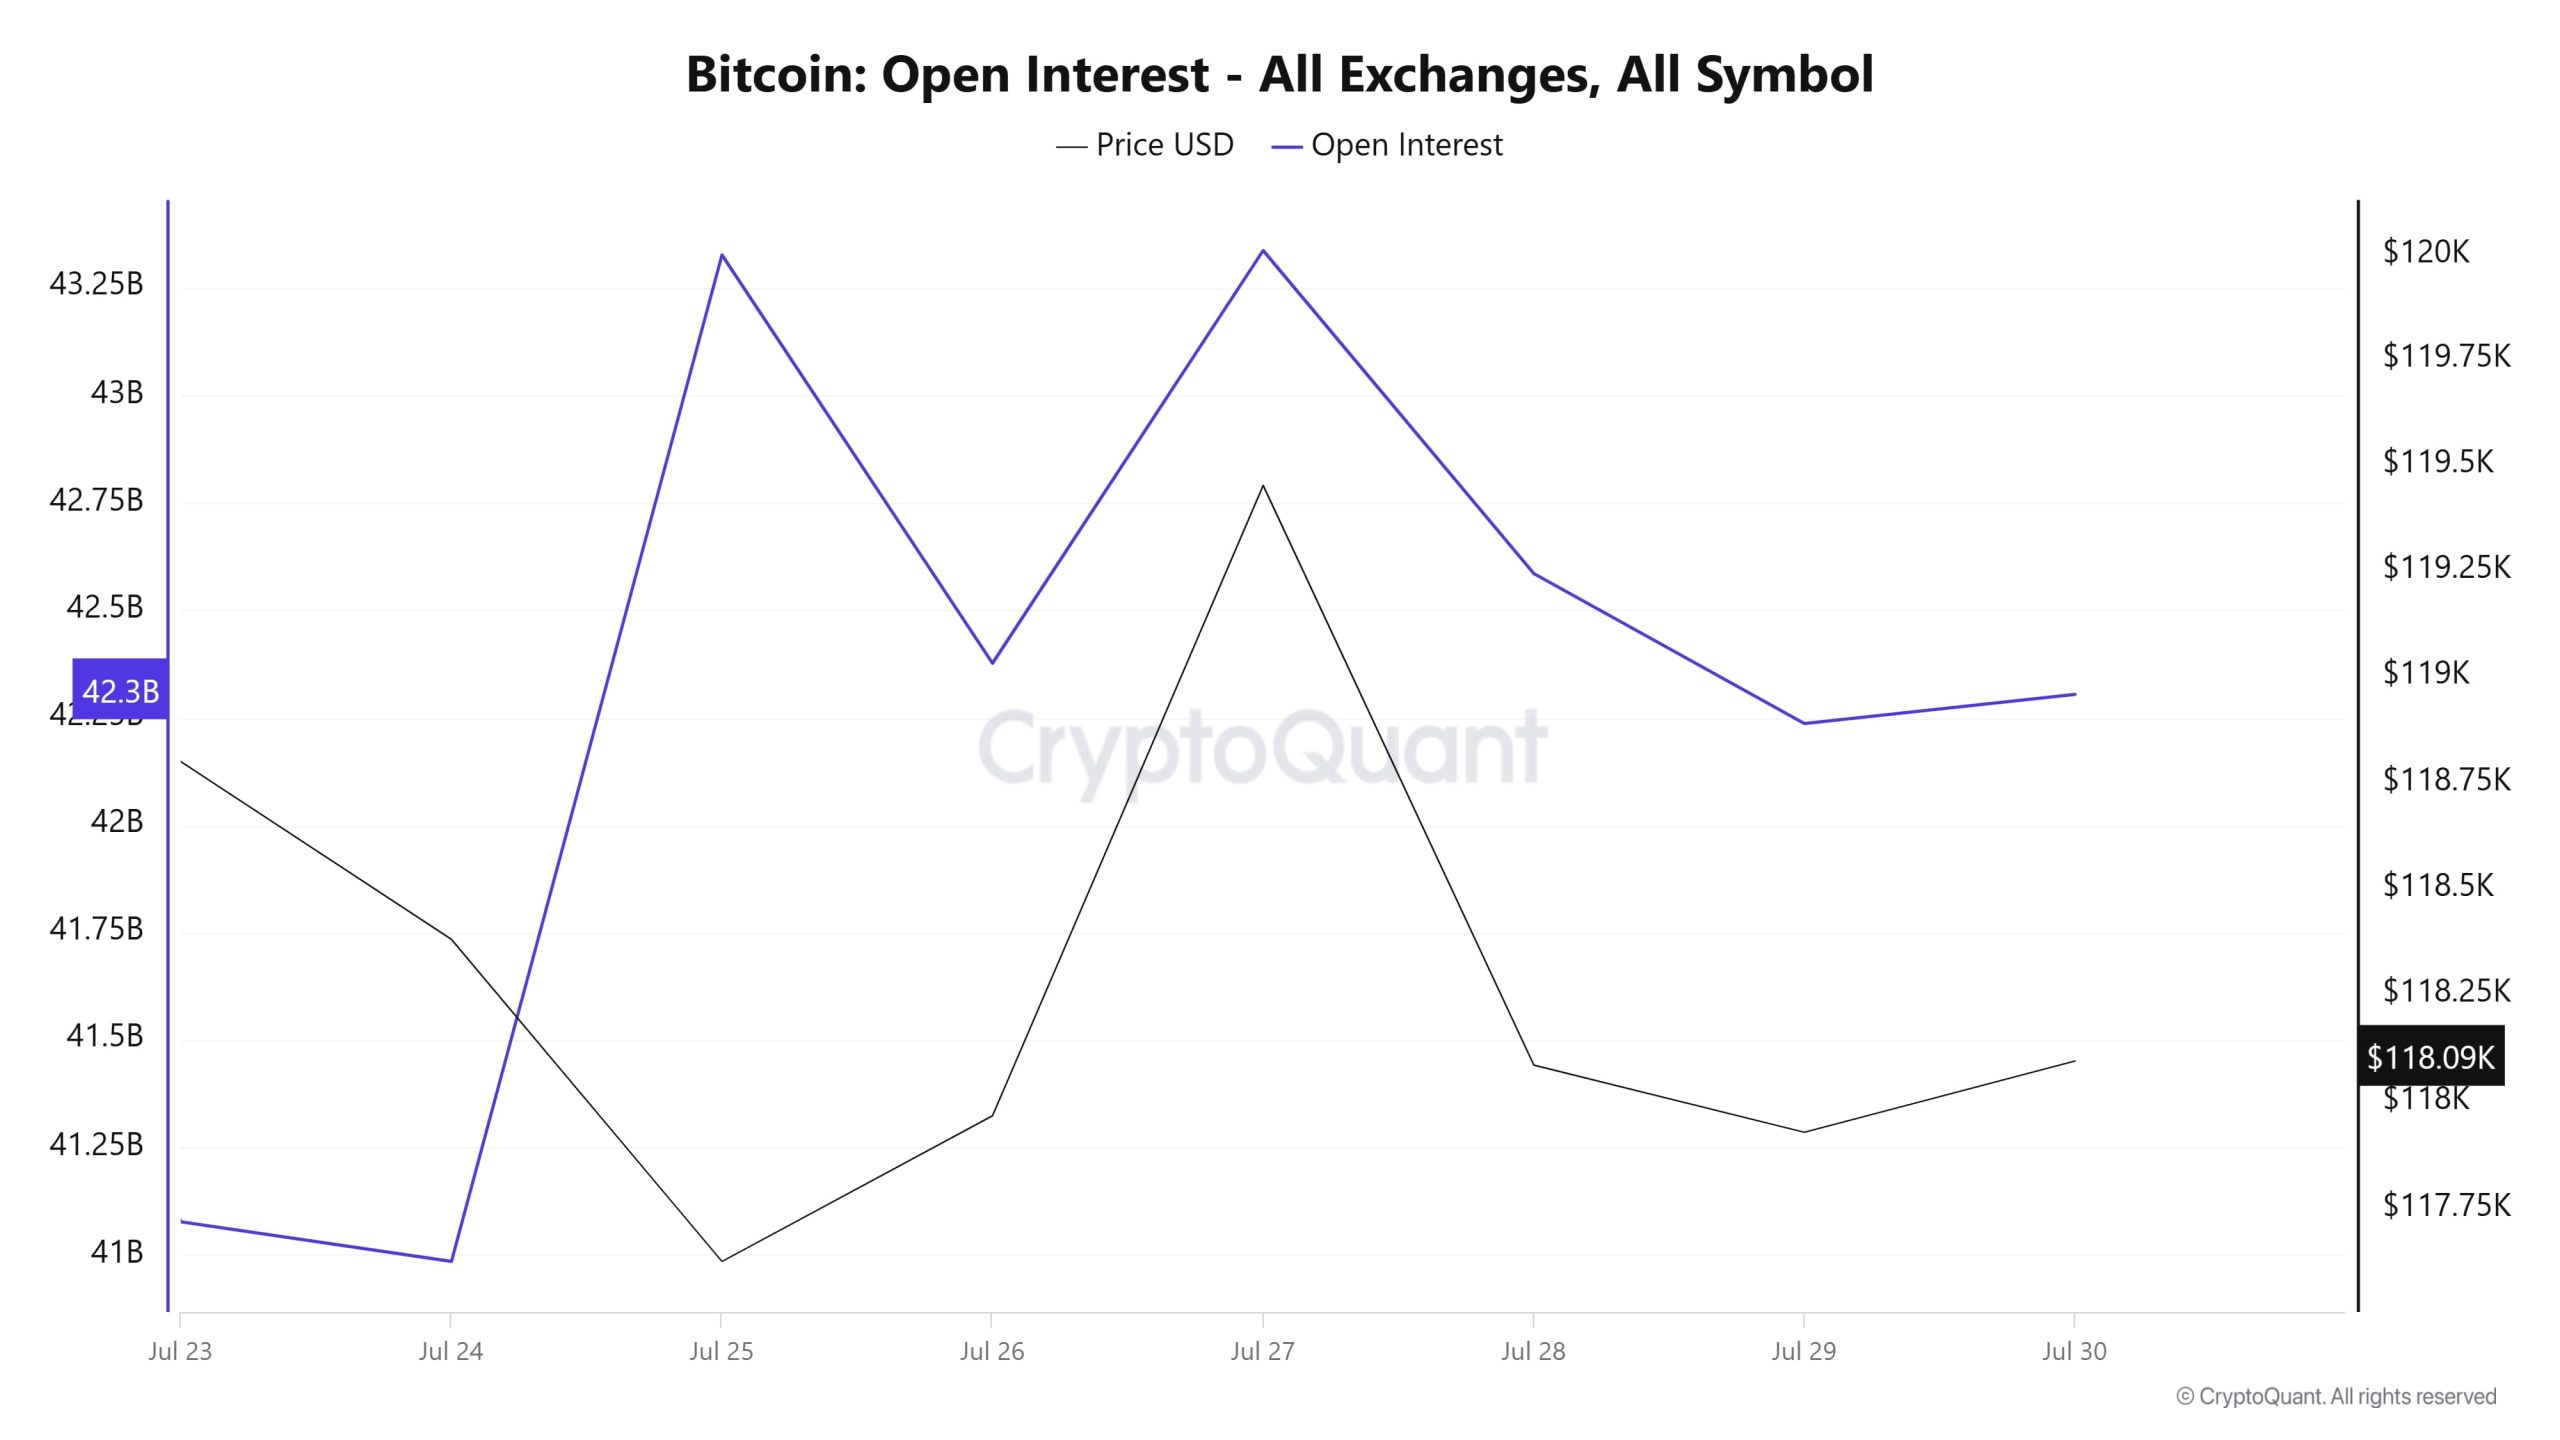
In recent days, there has been a fluctuating trend in the amount of open positions (open interest) in Bitcoin. On July 23, open interest, which was around $41 billion, fell slightly on July 24, then rose rapidly between July 25-27, reaching $43.3 billion. Immediately after this rise, it started to decline again as of July 28 and stabilized around $42 billion on July 30.
On the price side, there is similar volatility. On July 25, the price hit a low, then made a short-lived peak on July 27, before falling back to $118,090 as of July 30. The fact that open interest and price peaked on the same days and then retreated together suggests that a short-term profit realization is taking place in the market. The overall picture points to a period in which price and open interest are moving together, but confidence has yet to fully recover.
Funding Rate
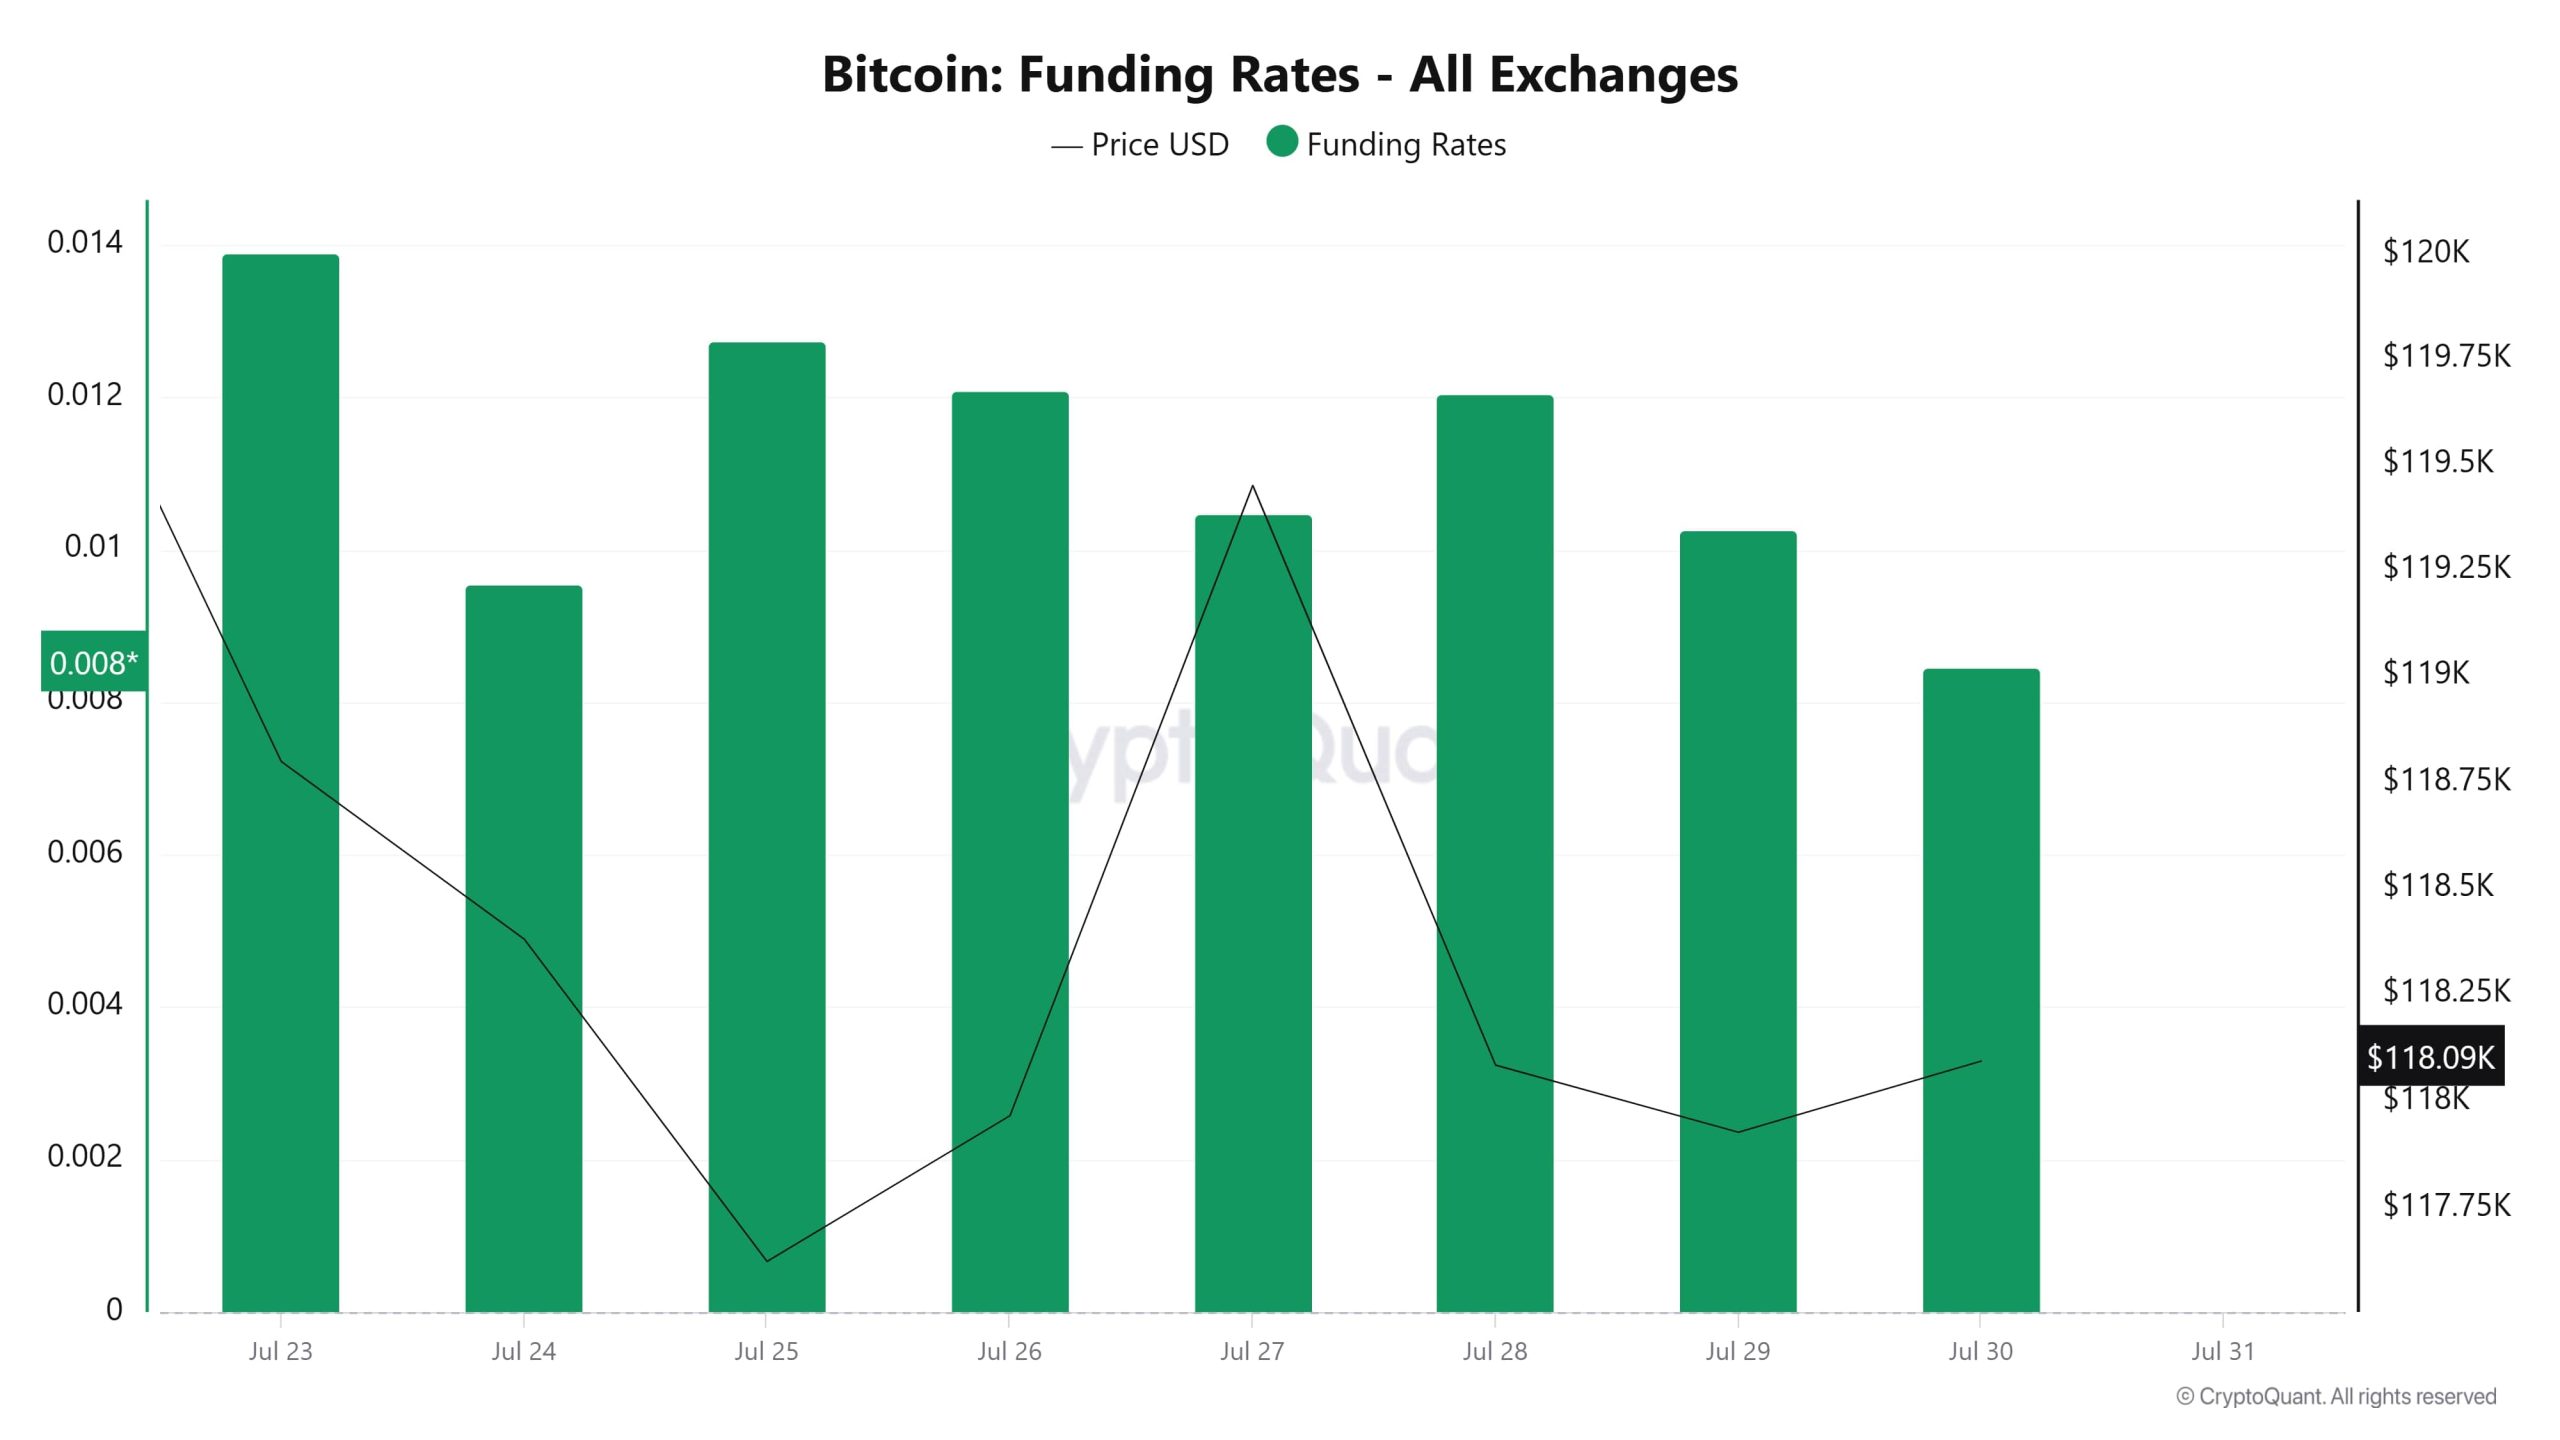
Bitcoin funding rates have remained in positive territory in recent days but have fluctuated significantly with the price. On July 23, the rates, which reached as high as 0.014%, retreated slightly as the price started to decline. Then, on July 27, funding rates recovered along with the price, but this rise was not permanent. As of July 30, the funding rate fell again, and the price dropped to $118,090. While the fact that the funding rates remain positive indicates that long positions are predominant in the market, the pullbacks experienced with the price indicate that caution should be exercised in leveraged transactions.
Long & Short Liquidations
Last week, there were long-weighted liquidations with BTC moving between $114,700 and $120,000. 677 million dollar long and 199 million dollar short transactions were liquidated.
| Date | Long Amount (Million $) | Short Amount (Million $) |
|---|---|---|
| July 23 | 280.10 | 30.12 |
| July 24 | 224.86 | 17.57 |
| July 25 | 105.45 | 25.08 |
| July 26 | 0.70 | 7.26 |
| July 27 | 1.76 | 98.06 |
| July 28 | 43.35 | 9.09 |
| July 29 | 21.47 | 12.10 |
| Total | 677.69 | 199.28 |
Supply Distribution
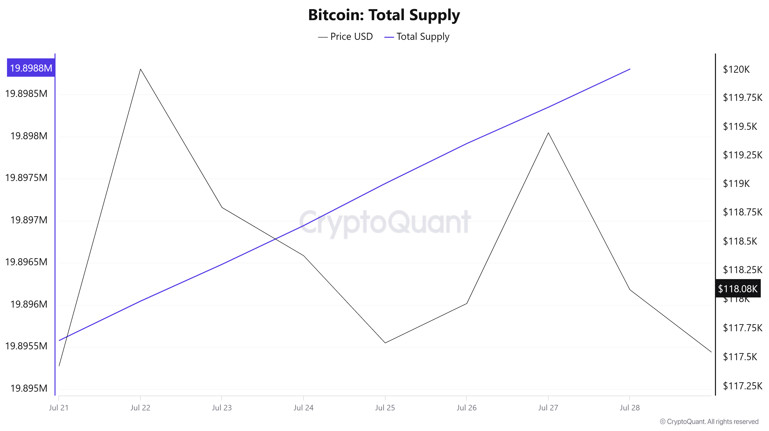
Total Supply: It reached 19,898,802 units, up about 0.0162% from last week.
New Supply: The amount of BTC produced this week amounted to 3,225.
Velocity: Velocity, which was 12.70 last week, was 12.68 as of July 28.
| Wallet Category | 21.07.2025 | 28.07.2025 | Change (%) |
|---|---|---|---|
| < 1 BTC | 8.4555% | 8.4607% | 0.0615% |
| 1 – 10 BTC | 11.3903% | 11.3815% | -0.0773% |
| 10 – 100 BTC | 24.6163% | 24.6862% | 0.2843% |
| 100 – 1k BTC | 29.4272% | 29.4613% | 0.1159% |
| 1k – 10k BTC | 18.3698% | 18.2799% | -0.4896% |
| 10k+ BTC | 7.7405% | 7.7299% | -0.1372% |
According to the latest weekly data, there is a mixed outlook in Bitcoin wallet distribution. Wallets holding less than 1 BTC saw a limited increase of 0.0615%, while wallets in the 1-10 BTC range saw a slight decrease of 0.0773%. The 10-100 BTC category, which represents larger investors, saw a relatively strong increase of 0.2843%, while the 100-1,000 BTC range saw an upward trend of 0.1159%. In contrast, wallets in the 1,000-10,000 BTC group experienced a decrease of 0.4896%. Wallets over 10,000 BTC, which represent the largest investor group, declined by 0.1372%.
Exchange Supply Ratio
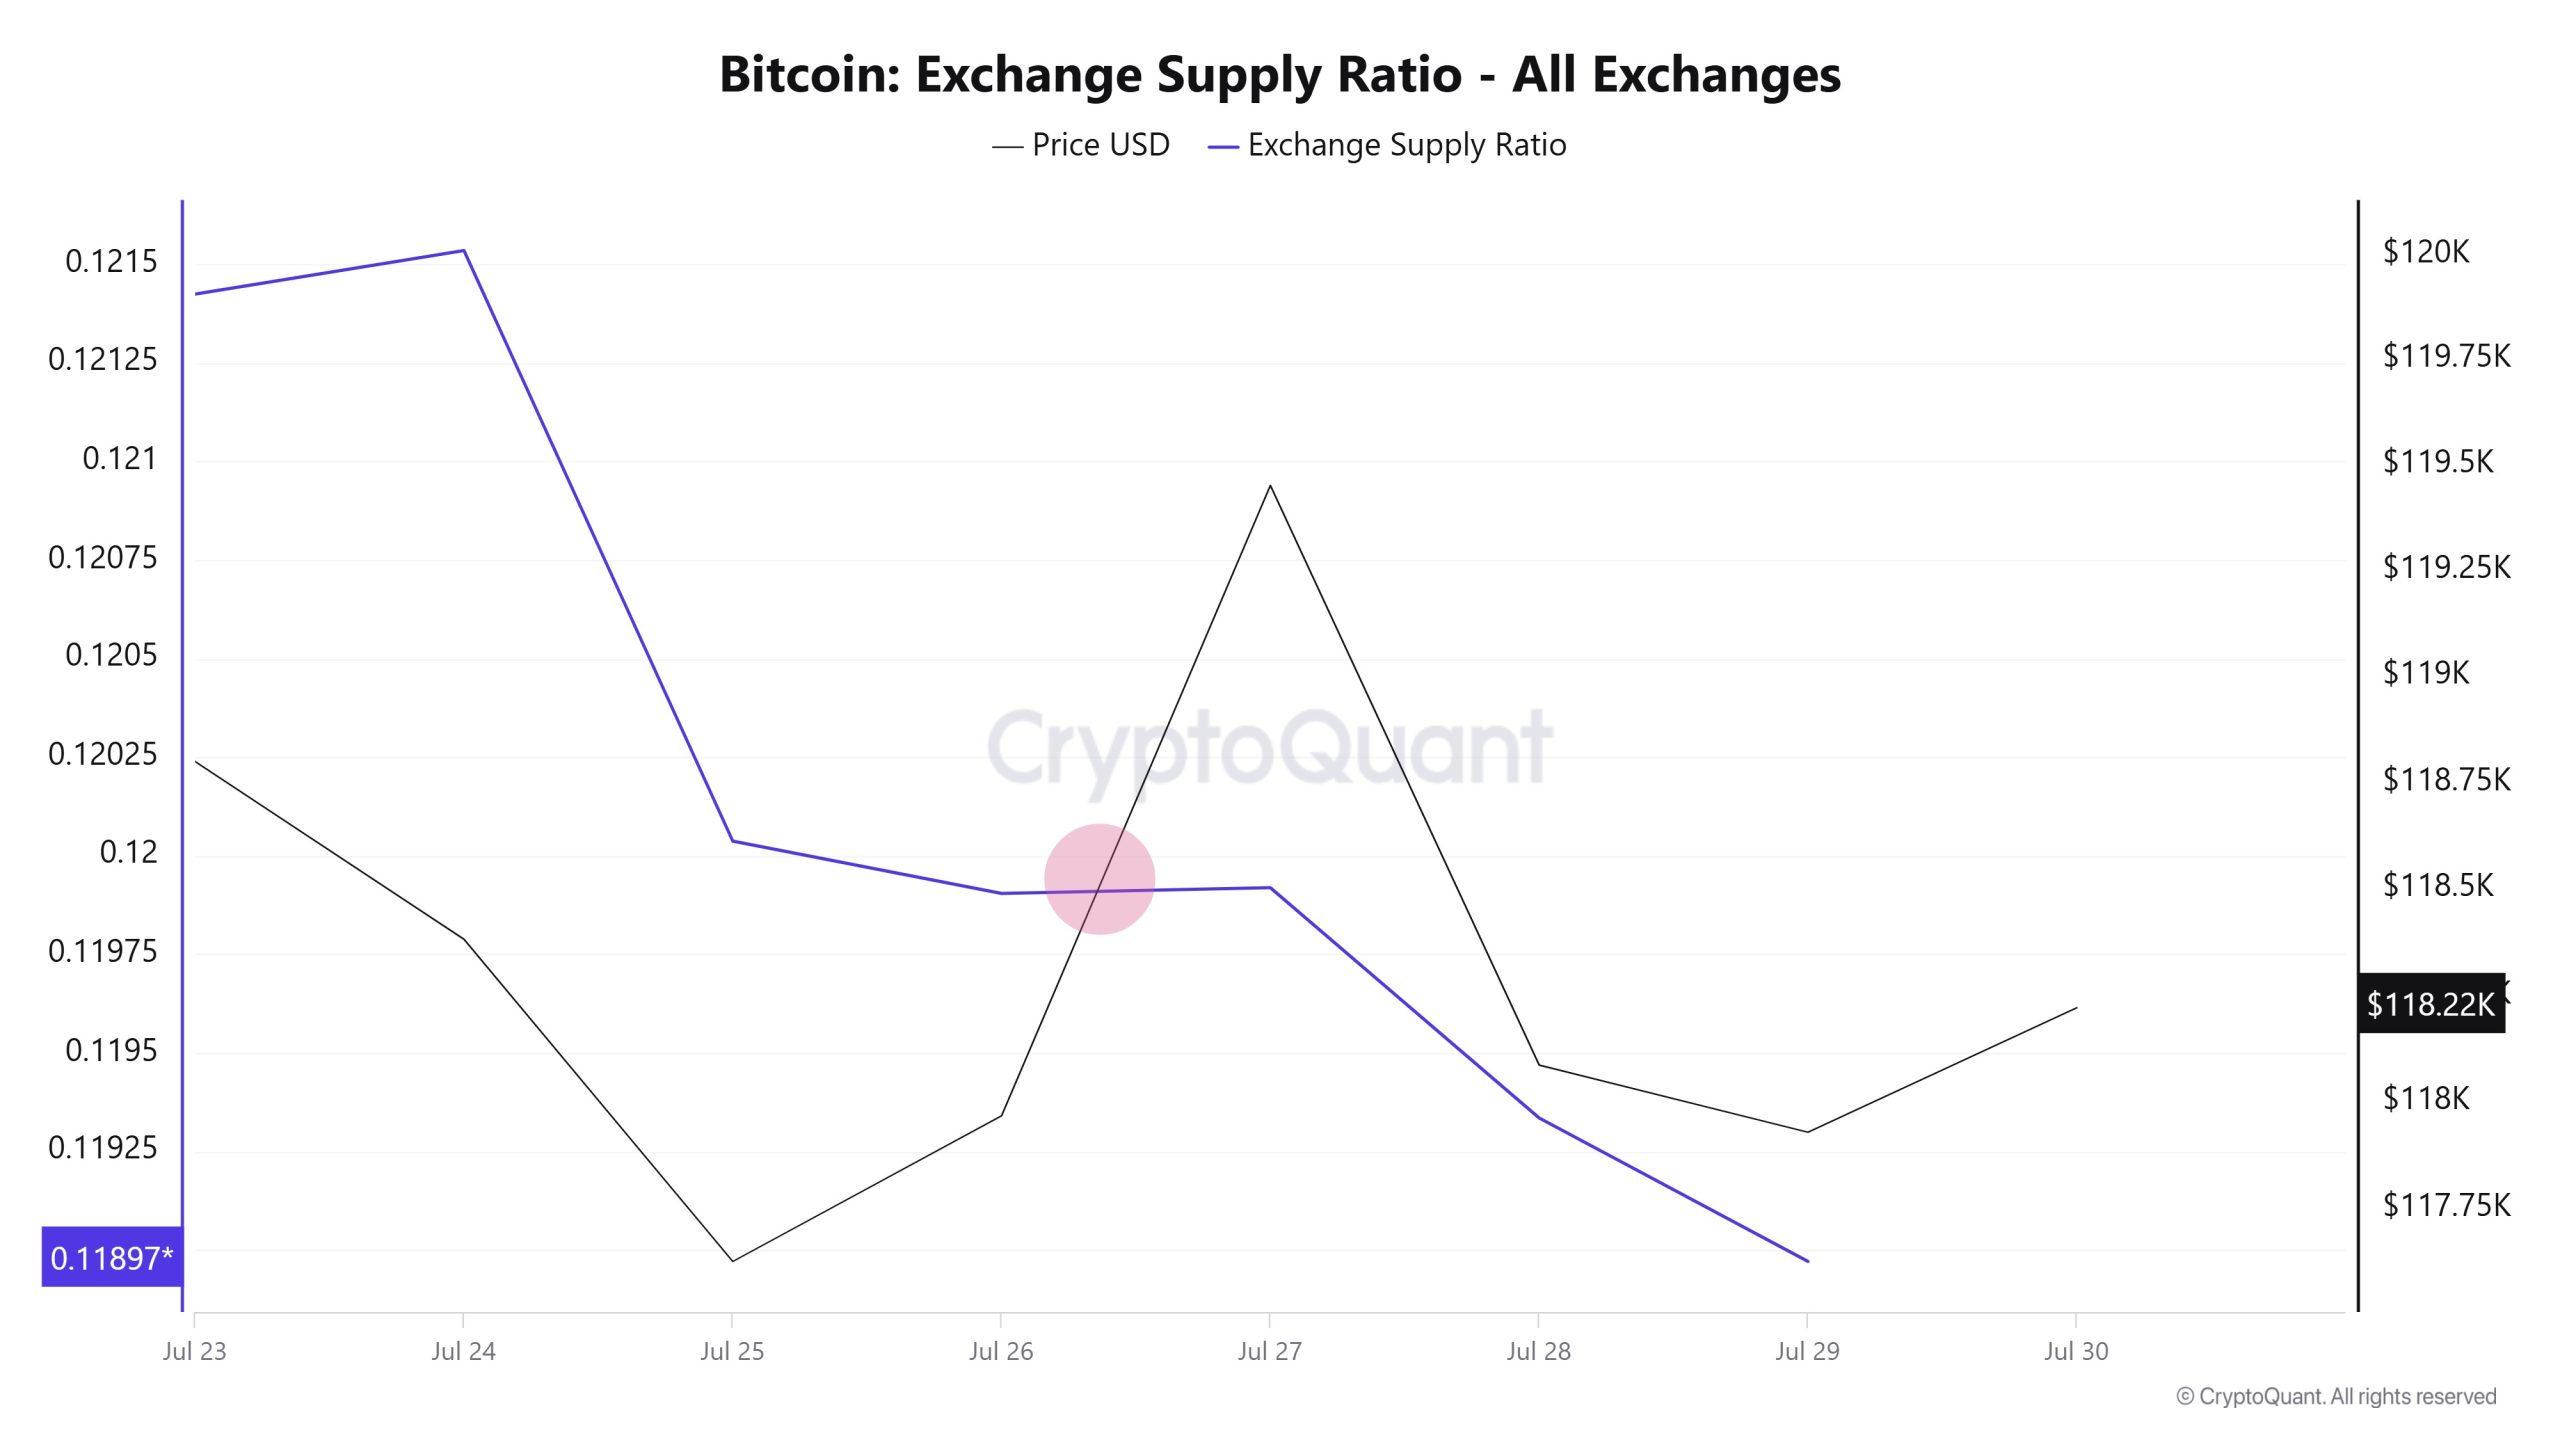
According to data from the Bitcoin Exchange Supply Ratio table, which shows how much Bitcoins are held on exchanges compared to the total supply of Bitcoins, low rates were observed this week. This week’s data reveals that the general trend is for a negative correlation between the price of Bitcoin and the rate of supply entering exchanges. This suggests that most Bitcoins are being held in wallets and are not readily available to sell or buy quickly in the market.
Between July 23rd and July 29th, the Bitcoin Exchange Supply Ratio decreased from 0.12153418 to 0.11897110. During this period, the Bitcoin price increased from $117,620 to $119,451. Notably, on July 26th, at the intersection of the price and the Exchange Supply Ratio, there was a significant drop in the Exchange Supply Ratio as the price continued to rise. This suggests that despite the price increase, the amount of Bitcoin supplied to exchanges has decreased, possibly indicating that long-term investors continue to hold their holdings. The Bitcoin price is generally on an upward trend.
Fees and Revenues
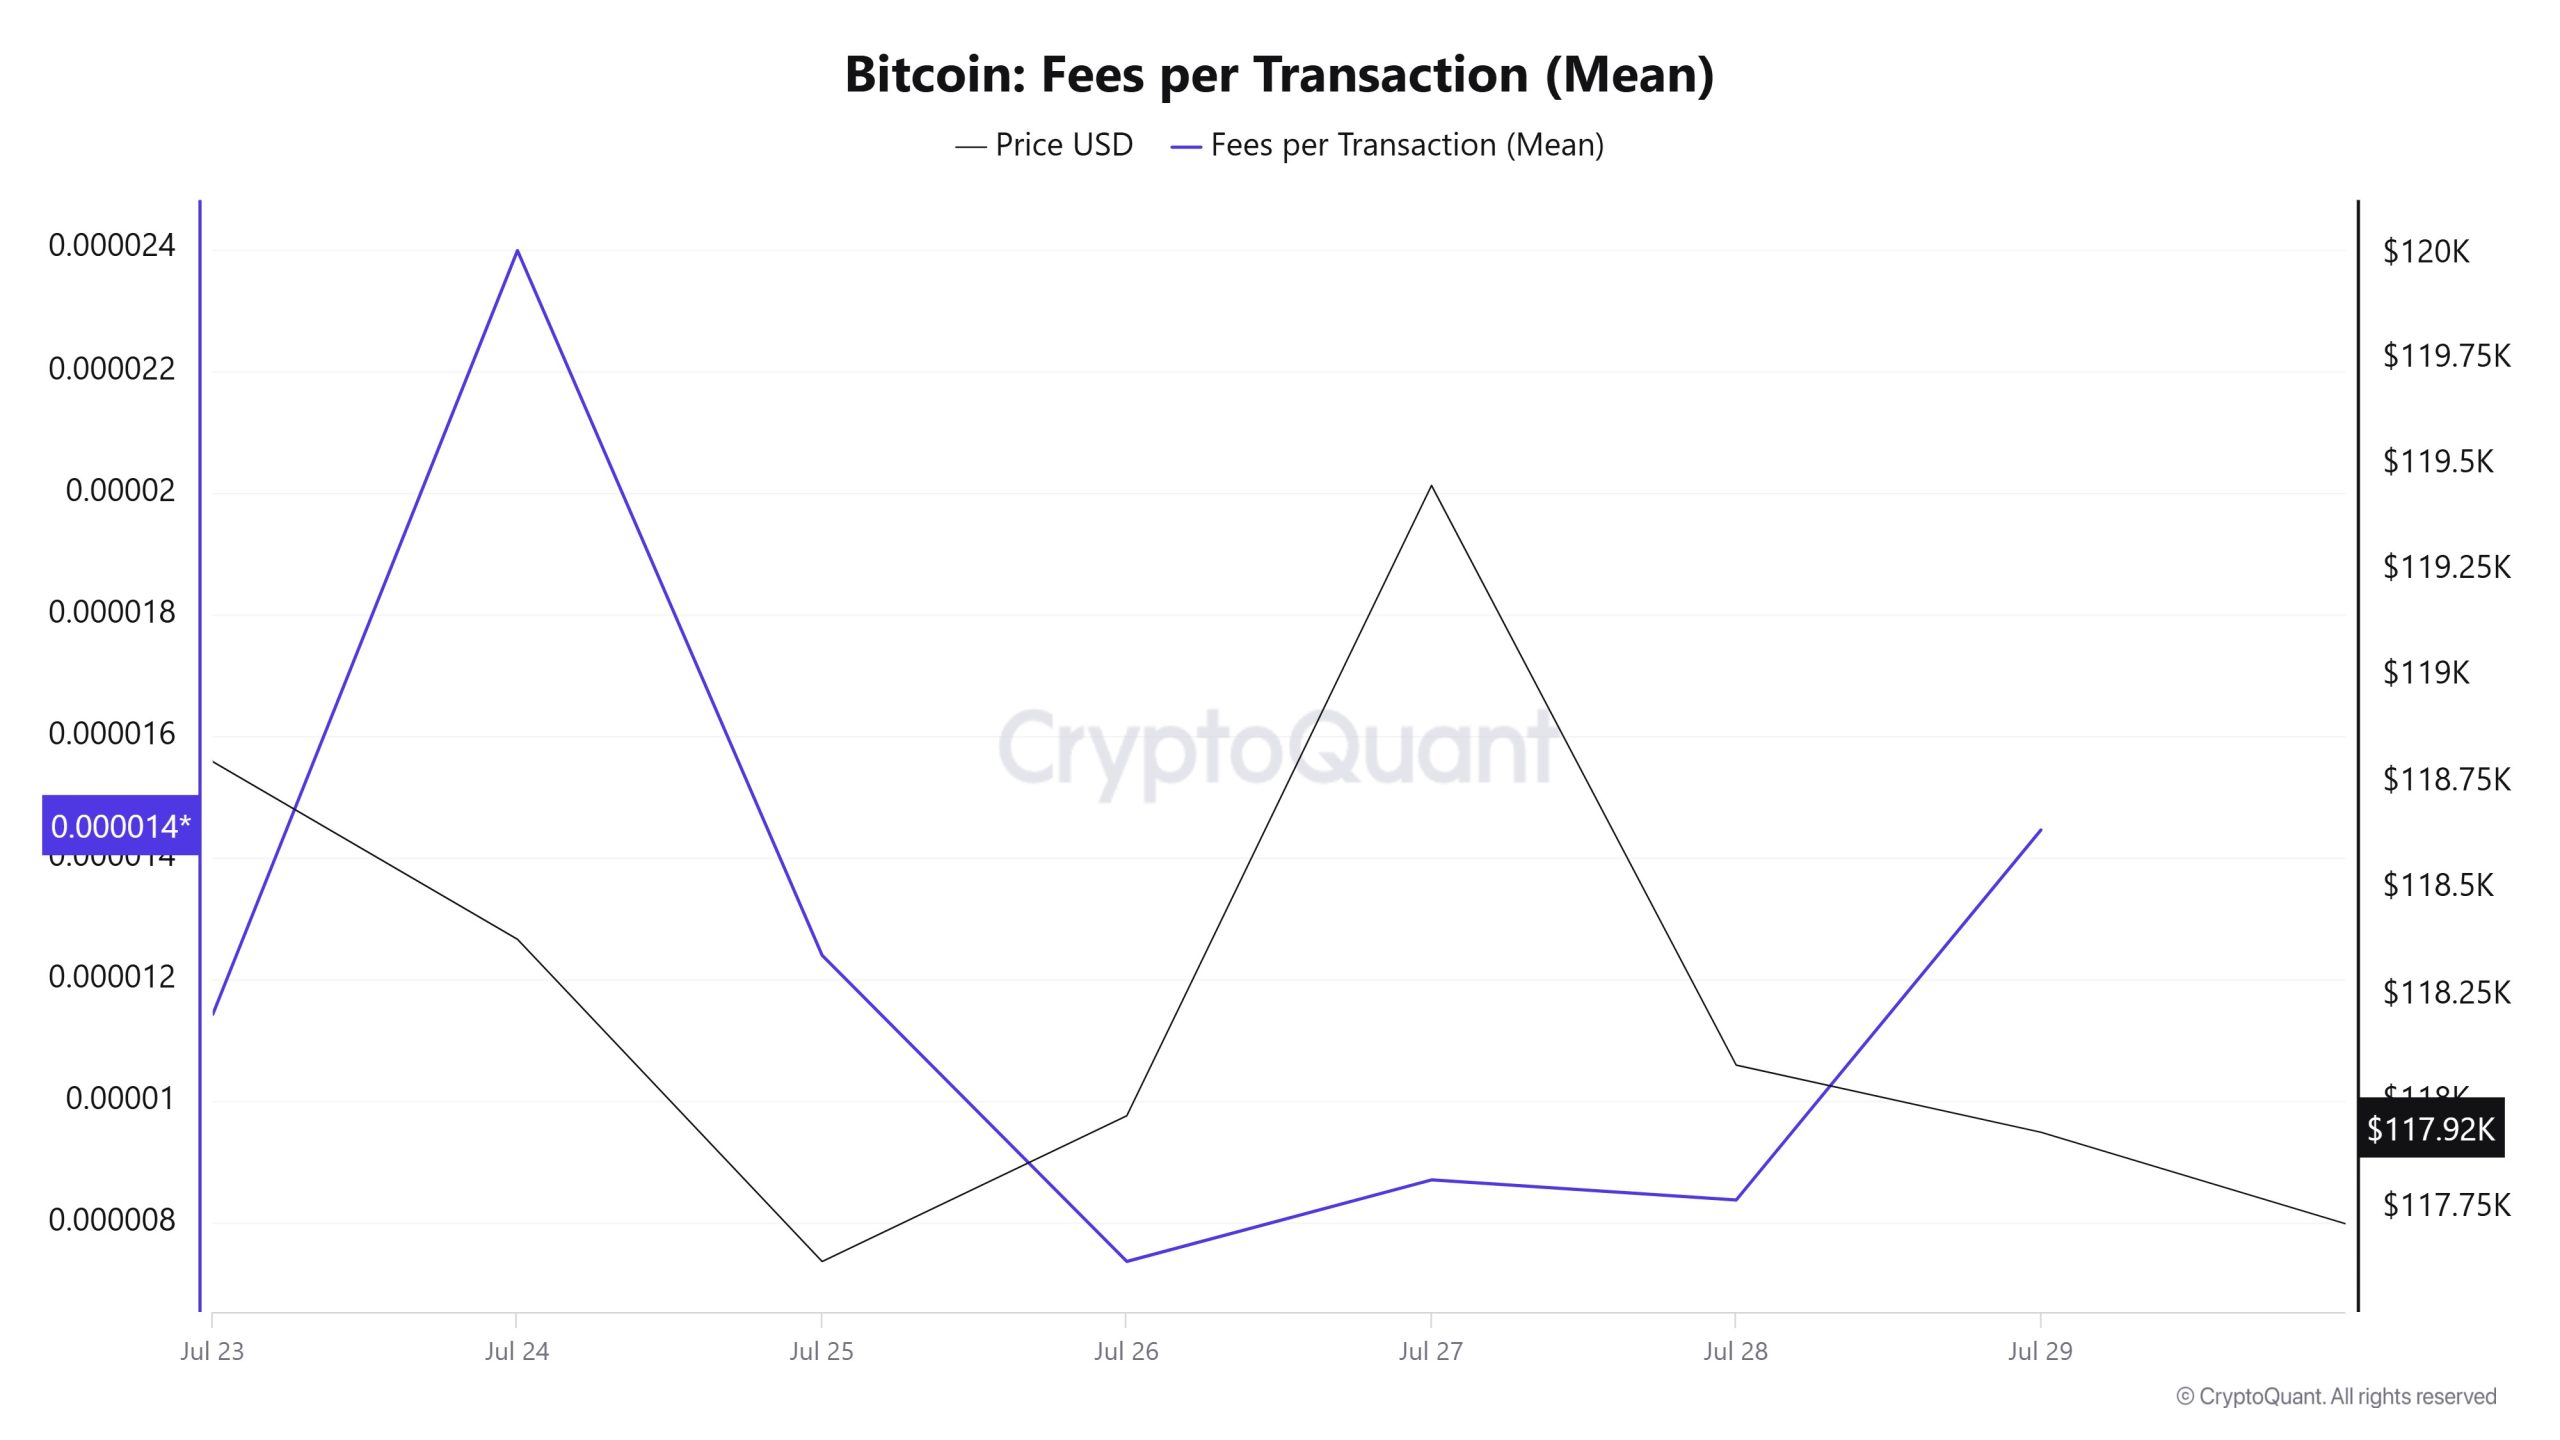
When the Bitcoin Fees per Transaction (Mean) data between July 23 and July 29 are analyzed, it is seen that this indicator was realized at 0.00001143 on July 23, the first day of the week.
As of July 24, the value reached its peak level, and after this date, a fluctuating course was observed due to the volatile movements in the Bitcoin price; As of July 26, it reached 0.00000737, reaching the lowest level of the week.
In the following days, Bitcoin Fees per Transaction (Mean) started to rise again and closed at 0.00001446 on July 29, the last day of the week.
Bitcoin: Fees (Total)
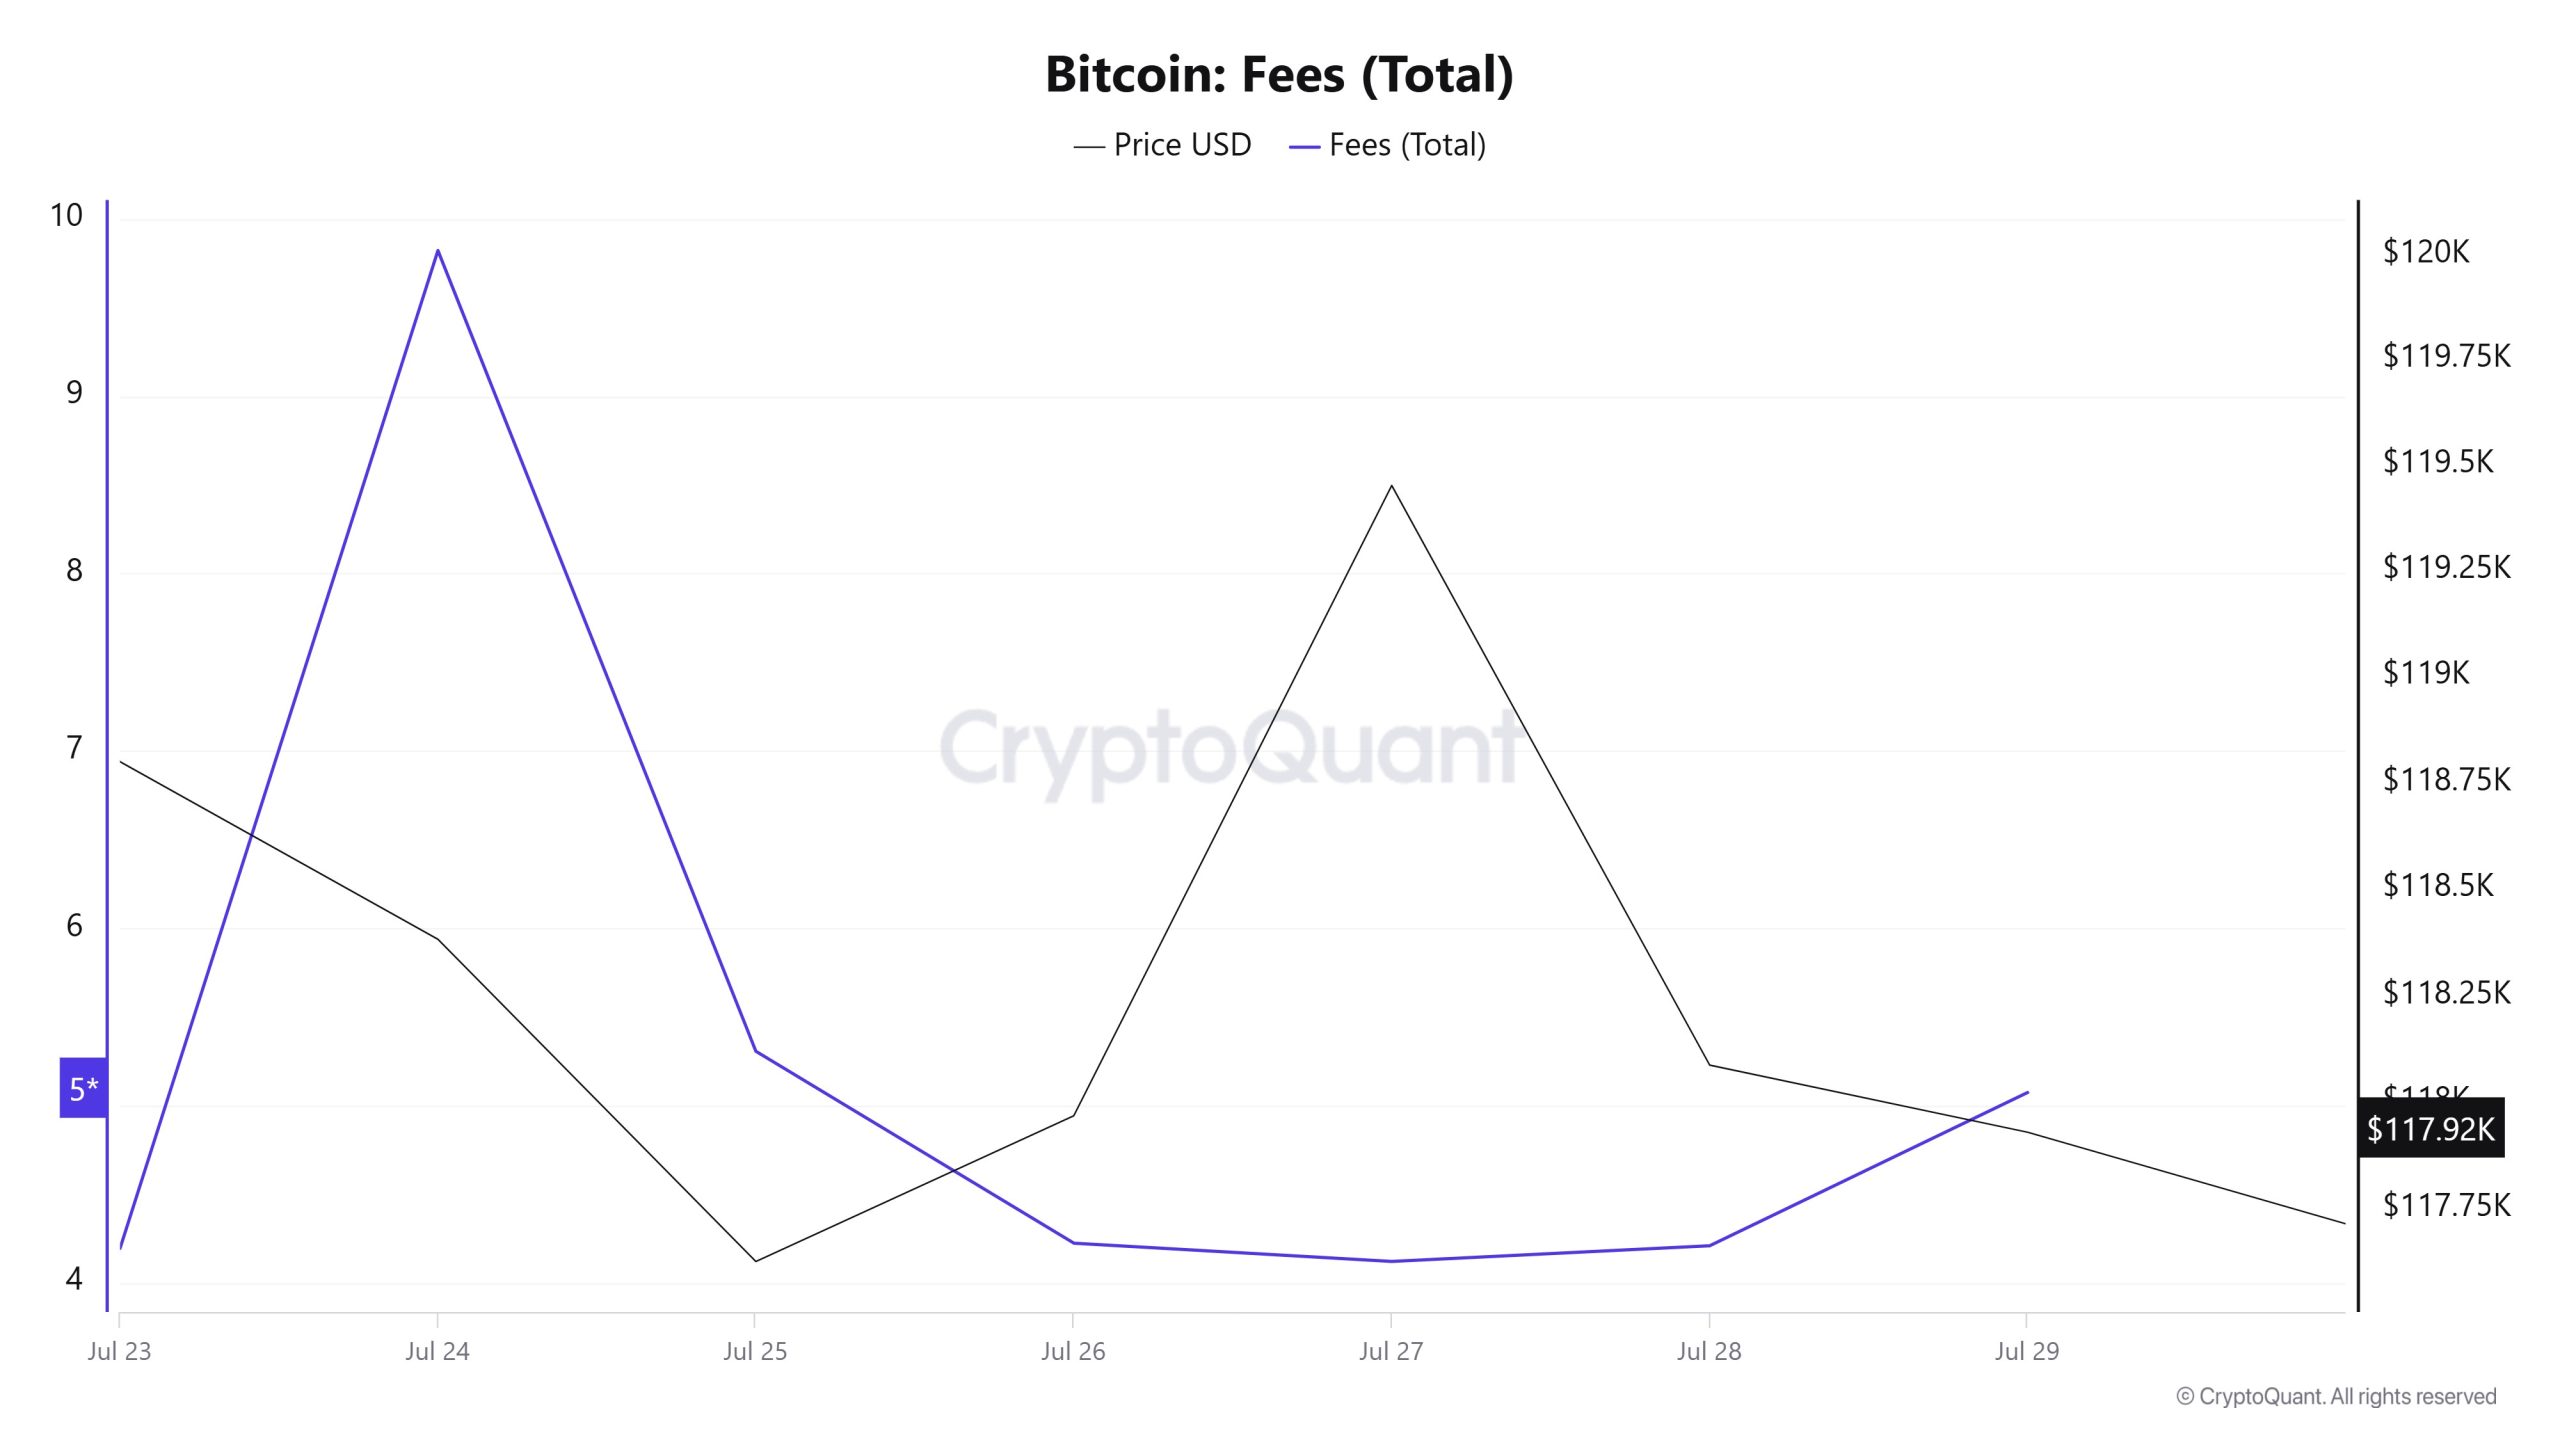
Similarly, an analysis of Bitcoin Fees (Total) data between July 23 and 29 shows that this indicator was at 4.19260713 on July 23, the first day of the week.
On July 24, the value peaked, but after this date, a fluctuating course was observed due to the volatile movements in the Bitcoin price, reaching its lowest level of the week at 4.11970629 on July 27.
In the following days, Bitcoin Fees (Total) started to rise again and closed at 5.07253502 on July 29, the last day of the week.
Miner Flows
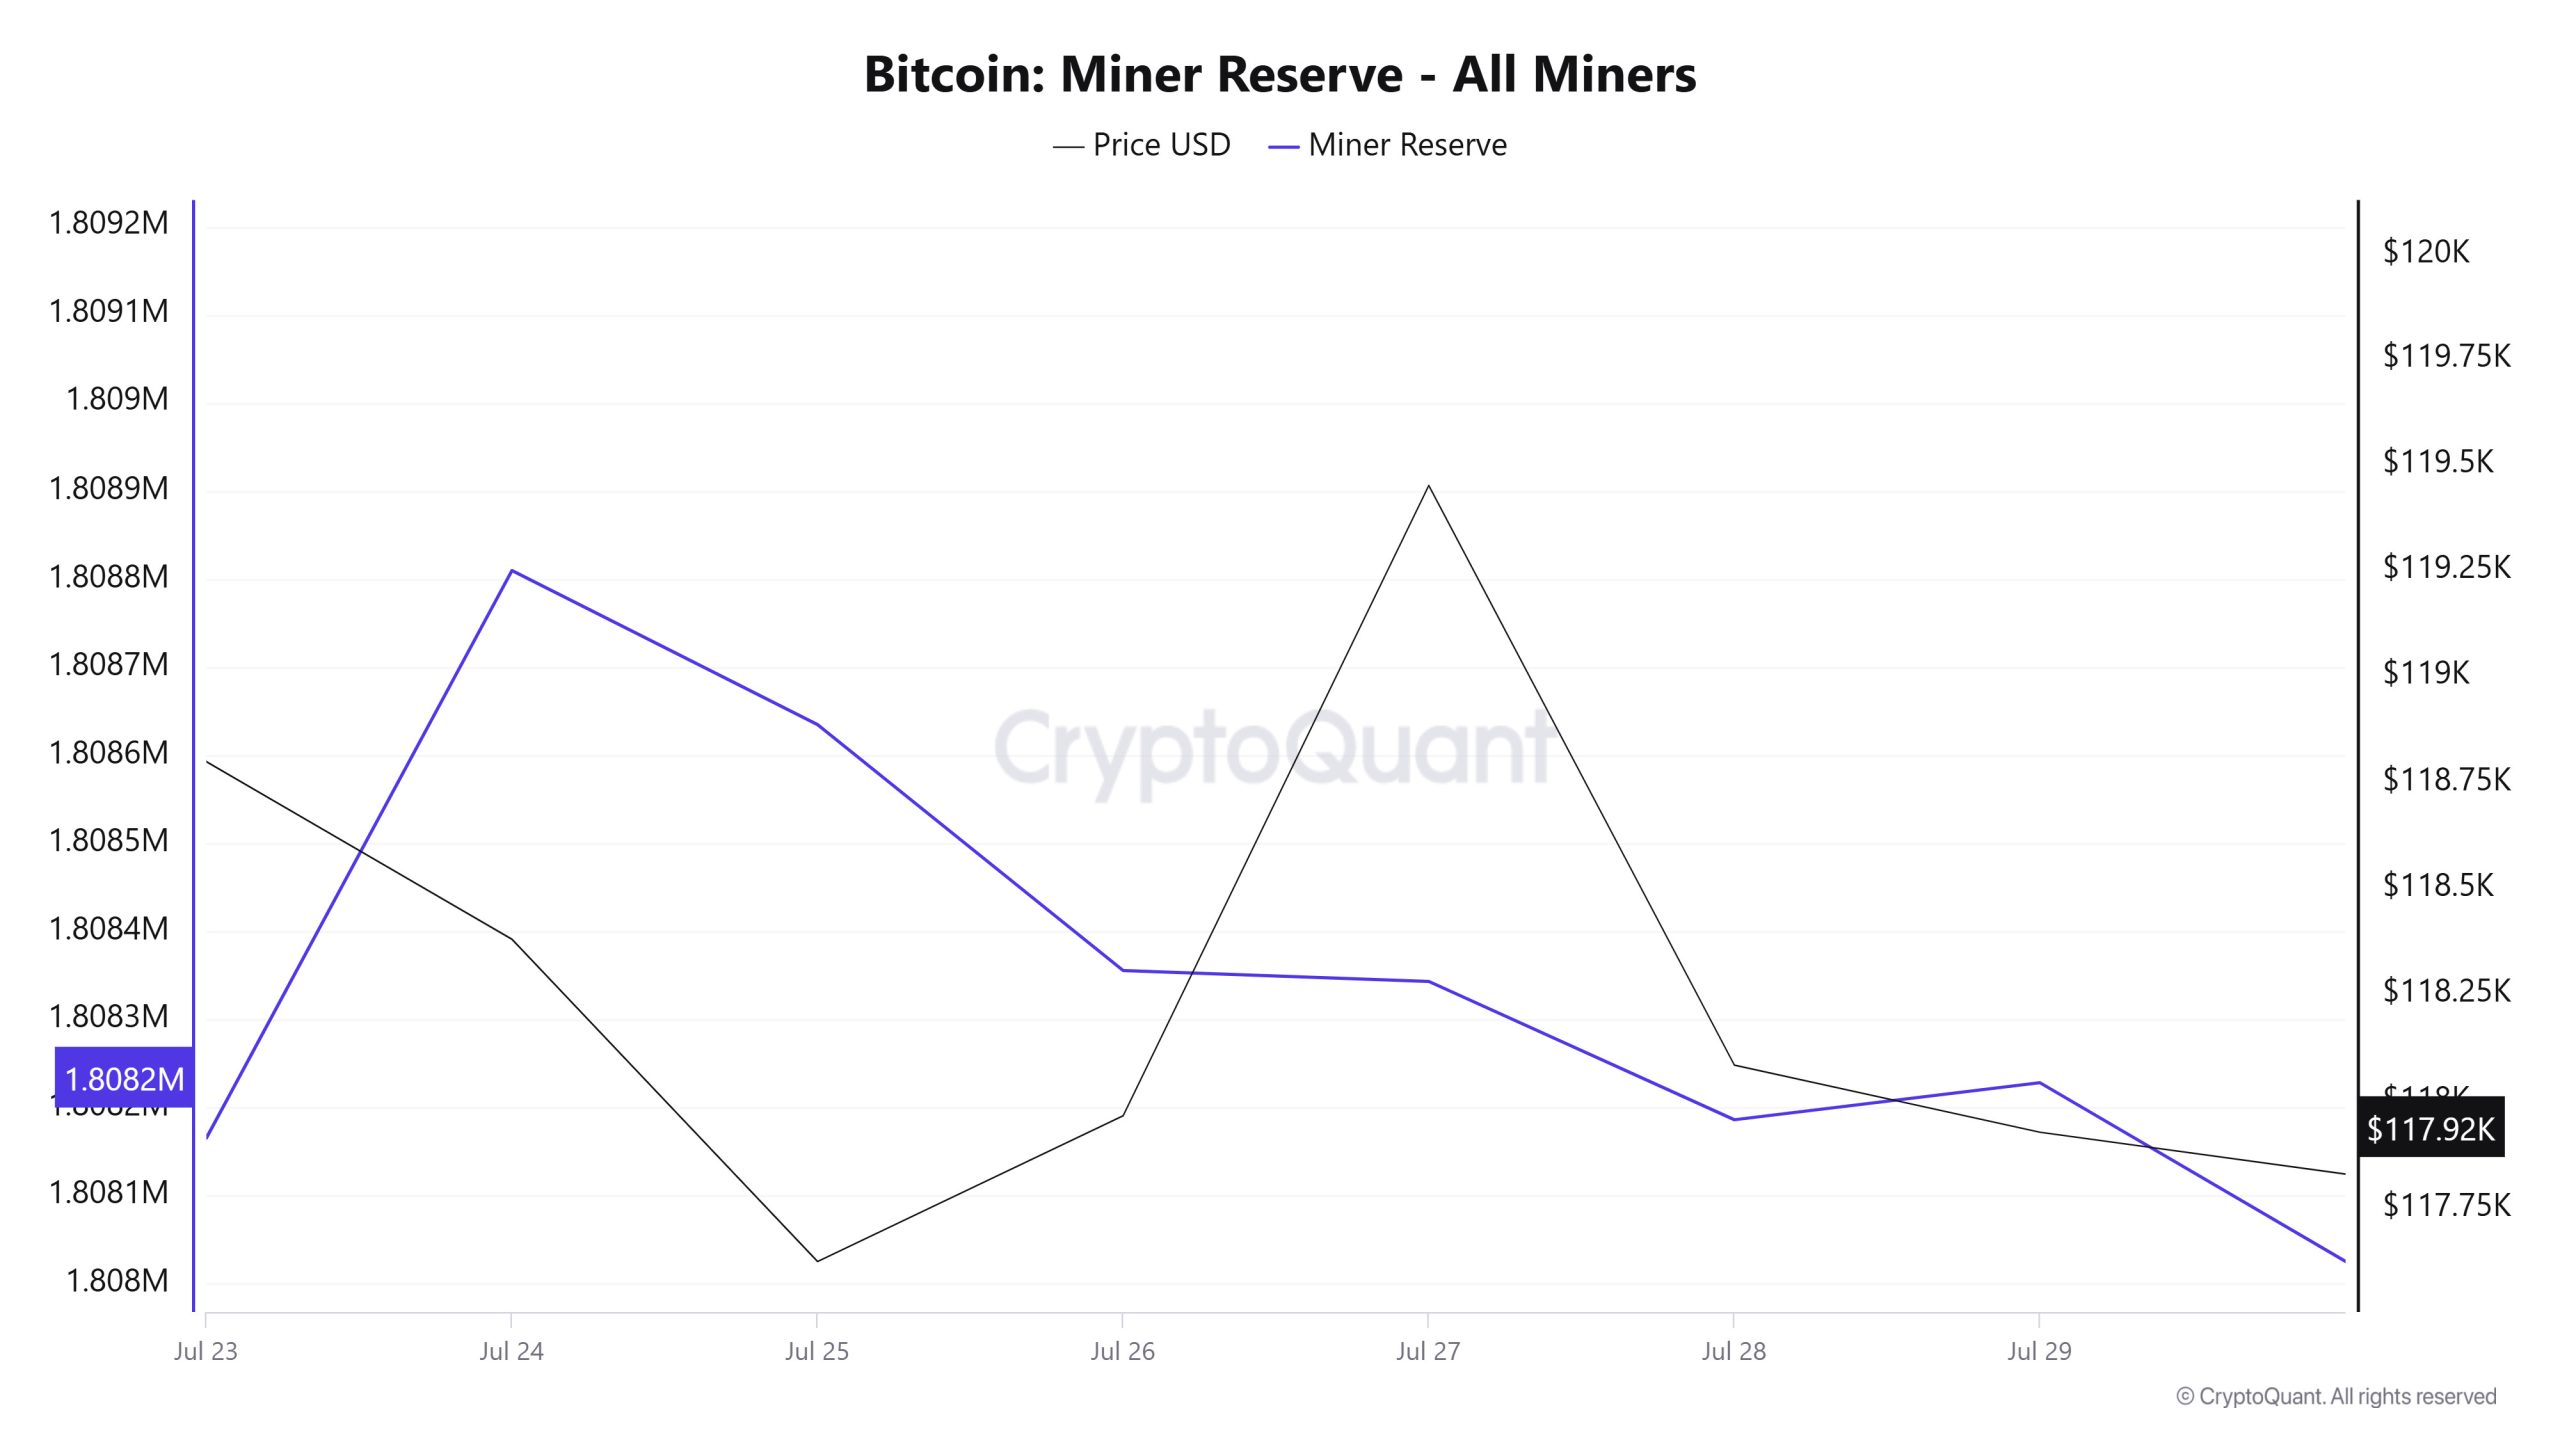
According to the data obtained from the Miner Reserve table, there has been a decrease in Bitcoin reserves held in miners’ wallets this week. A time-varying correlation structure was observed between Bitcoin price and miner reserve over the time period analyzed. However, the general trend suggests that a negative correlation predominates between these two variables.
Miner Inflow, Outflow and NetFlow
Between July 23 and July 29, 49,884 Bitcoins exited miners’ wallets, and 48,939 Bitcoins entered miners’ wallets between the same dates. The Miner Netflow for this week was -945 Bitcoin. Meanwhile, the Bitcoin price was $118,798 on July 23 and $117,928 on July 29.
For the week, Bitcoin inflow into miner wallets (Miner Inflow) was less than Bitcoin outflow from miner wallets (Miner Outflow), resulting in a negative net flow (Miner Netflow).
| July 23 | July 24 | July 25 | July 26 | July 27 | July 28 | July 29 | |
|---|---|---|---|---|---|---|---|
| Miner Inflow | 6009.57 | 6873.71 | 17627.24 | 3901.97 | 2998.46 | 5861.67 | 5666.94 |
| Miner Outflow | 7017.25 | 6229.33 | 17802.16 | 4181.19 | 3010.91 | 6018.66 | 5624.95 |
| Miner Netflow | -1007.67 | 644.38 | -174.92 | -279.22 | -12.45 | -156.99 | 41.99 |
Transaction
![]()
Last week, there were 2,931,347 transactions on the Bitcoin network, while this week it increased by about 5.84% to 3,102,662. The 572,930 transactions recorded on July 26th was the highest transaction volume of the week, while the lowest number of transactions was 350,848 on July 29th.
Throughout the week, the correlation between the BTC price and the number of transactions was mixed, changing direction from time to time, but the overall trend was negatively weighted. This suggests that price-based movements on the network are supported by sales.
On the other hand, there was no significant change in the total number of transactions compared to the previous week, suggesting that the overall activity on the network remains relatively stable. Such low volatility network behavior strengthens the likelihood that the BTC price may flatten within a narrow band in the near term.
Tokens Transferred
While 5,280,137 BTC was transferred last week, this week this figure decreased by approximately 15.93% to 4,439,050 BTC. On July 25, the highest transfer volume of the week was 1,051,889 BTC, while on July 20, the lowest transfer volume of the week was 410,747 BTC.
Throughout the week, negative correlations were observed between the volume of transfers on the network and the BTC price. This strengthens the likelihood that transfers on the network are being made to sell, but the lack of large-scale declines during the week suggests that there are enough buyers to cover the sale for now. As for the level of transfer volumes, BTC transfer volumes continued to hover significantly above the annual average, indicating that the liquidity and transaction activity observed in the markets may be of a permanent nature.
Whale Activities
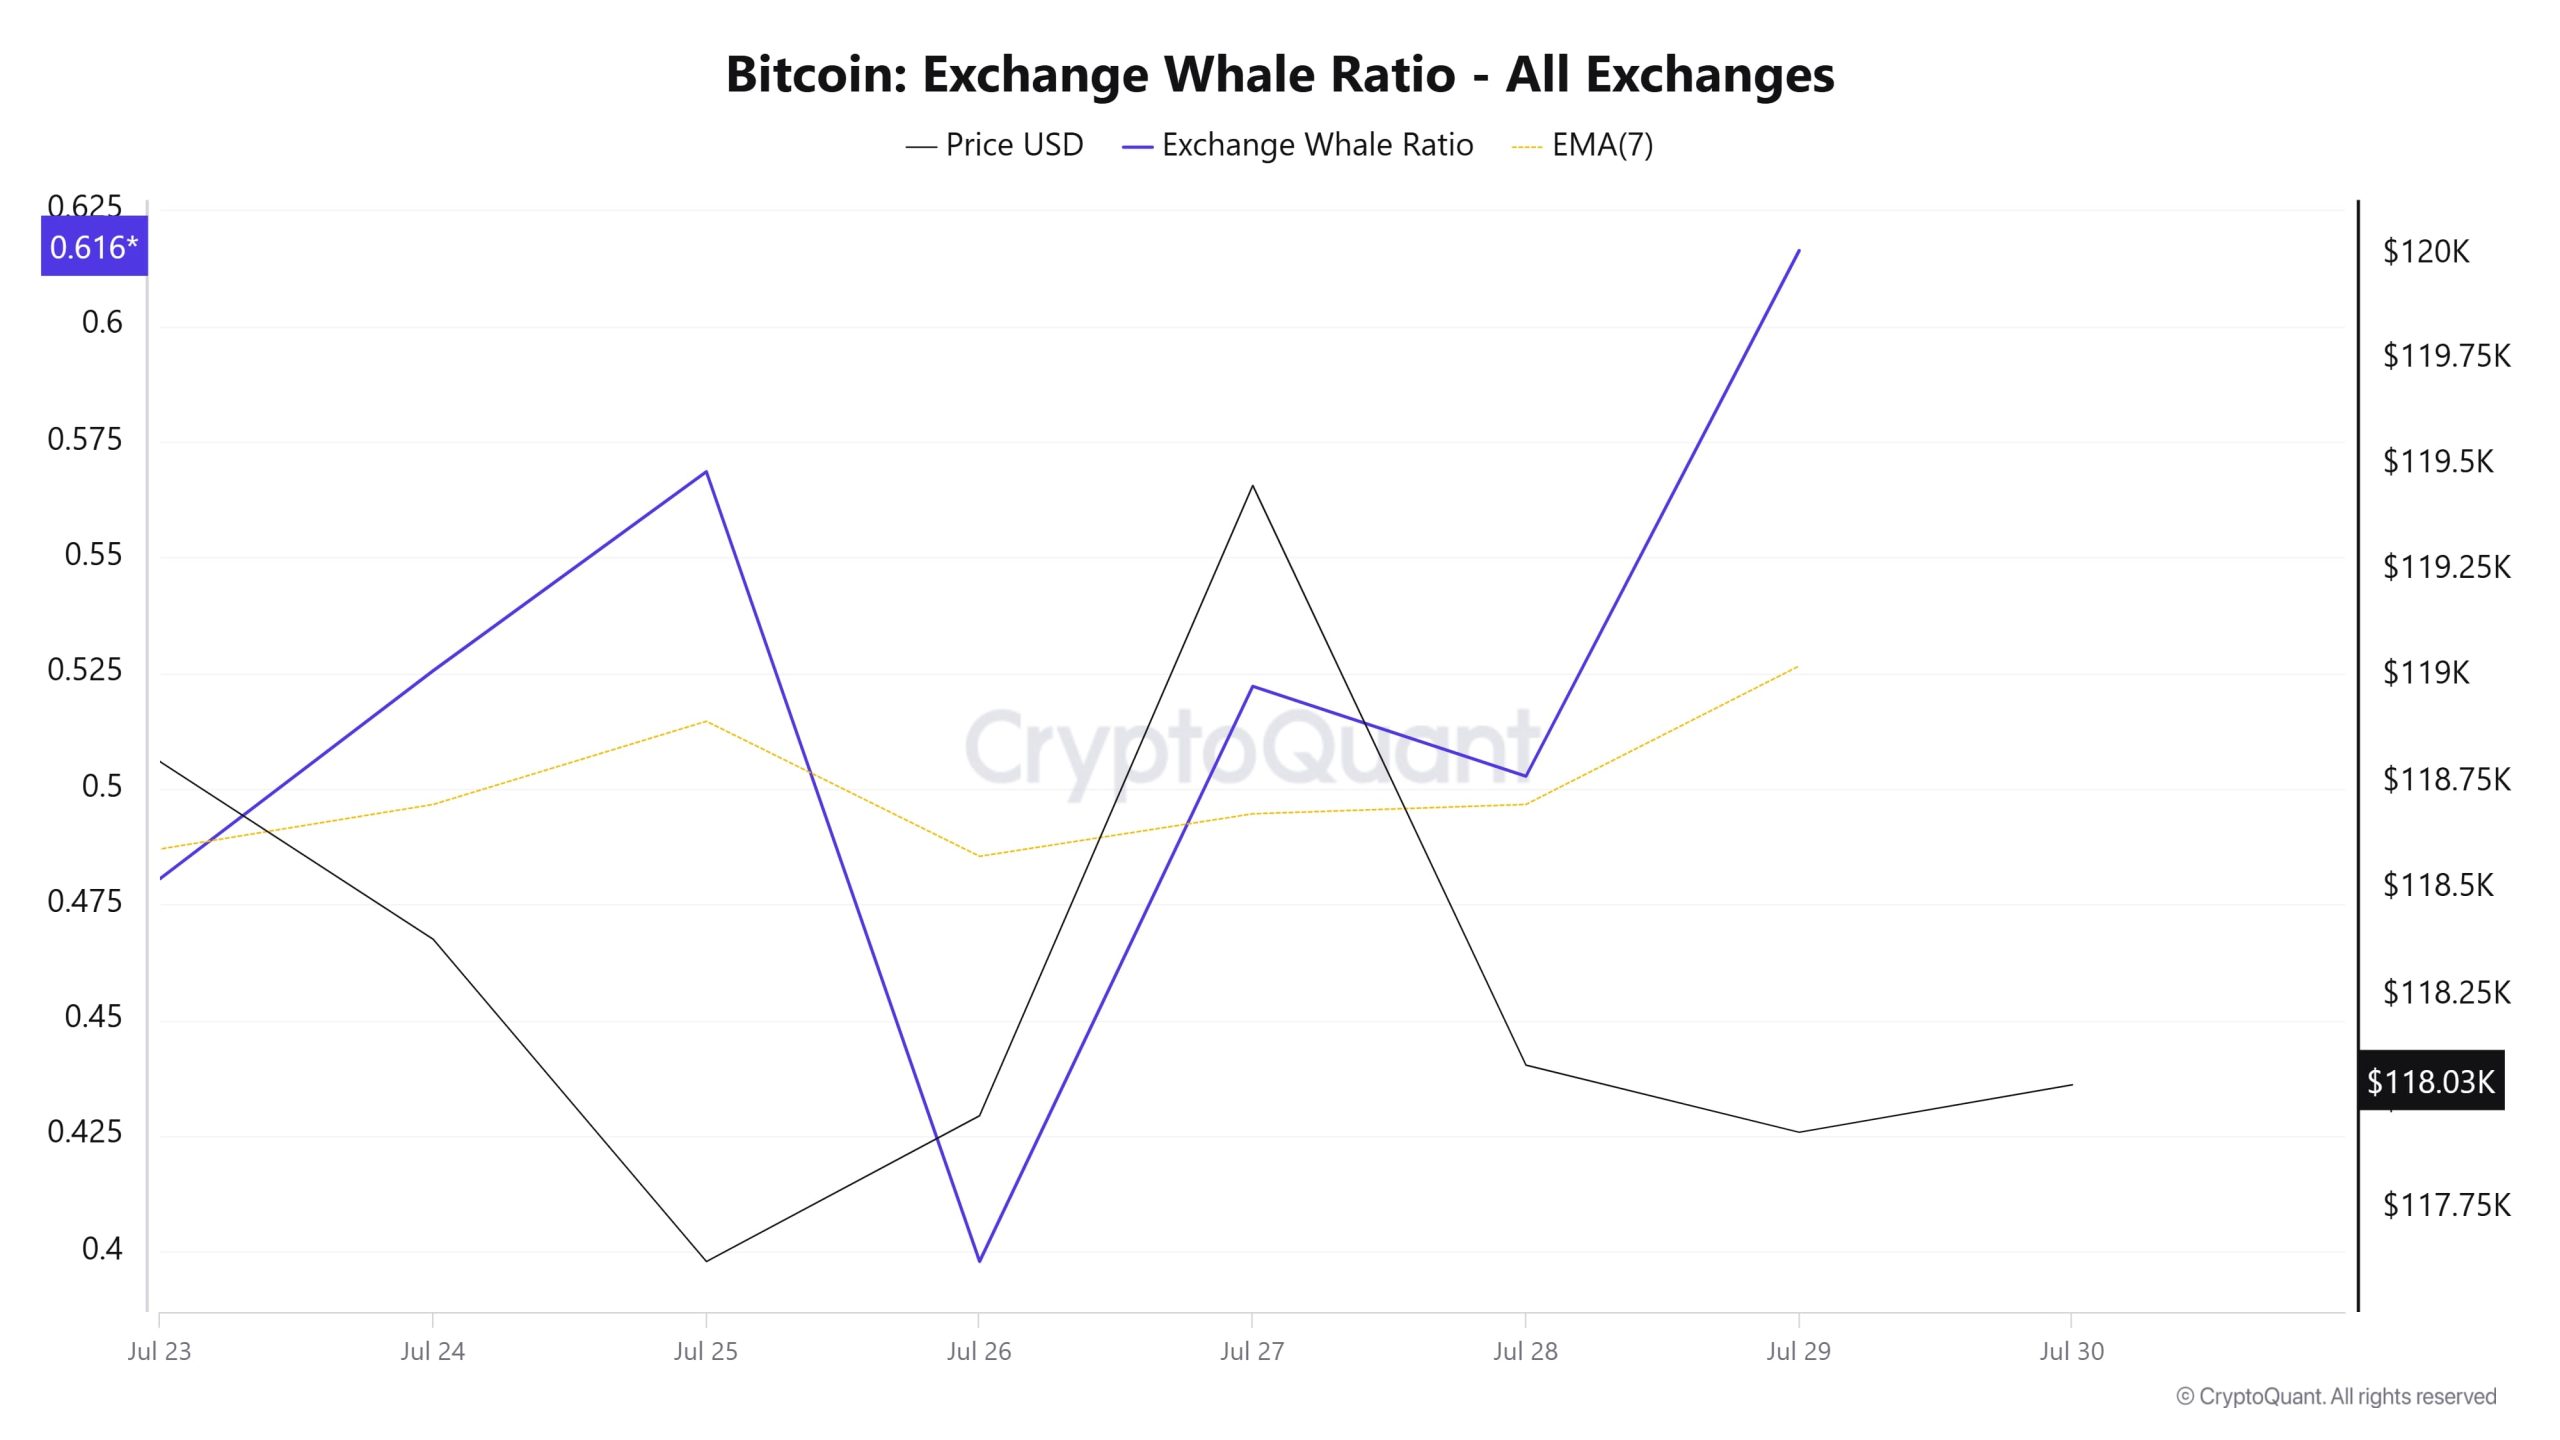
Whales Data
According to data from the cryptocurrency market over the last 7 days, whale activity on the central exchange fluctuated at the beginning and middle of the period. Towards the end of the process, these activities increased. When we look at the Exchange Whale Ratio metric, July 23, the first day of the 7-day period, the rate of whales using central exchanges was 0.480. The lowest point of the process took place on July 26 and the value was 0.397. When this ratio is above 0.35, it usually means that whales use central exchanges frequently. The metric, which currently has a value of 0.616, has formed the peak of the process. BTC has been stuck between 120,000 and 116,000 during this period. This shows that whales or institutions are using centralized exchanges to set direction, but a narrow band of competition continues to consolidate the price. At the same time, it is seen that 4,438,973 BTC moved in total BTC transfer, a decrease of about 16% compared to last week. When we look at the data, the addresses of collectors holding 100 to 1,000 BTC in their wallets stand out as the highest number of addresses so far with 15,722. This shows us that lower actors, except whales and institutions, are also in play. As a result, it shows us that there is a balanced struggle in the collision of bulls and bears, BTC is priced in a narrow band and can remain in this band unless the balance changes.
BTC Onchain Overall
| Metric | Positive 📈 | Negative 📉 | Neutral ➖ |
|---|---|---|---|
| Active Addresses | ✓ | ||
| Breakdowns | ✓ | ||
| Derivatives | ✓ | ||
| Supply Distribution | ✓ | ||
| Exchange Supply Ratio | ✓ | ||
| Fees and Revenues | ✓ | ||
| Miner Flows | ✓ | ||
| Transaction | ✓ | ||
| Whale Activities | ✓ |
*The metrics and guidance in the table do not, by themselves, describe or imply an expectation of future price changes for any asset. The prices of digital assets may vary depending on many different variables. The onchain analysis and related guidance are intended to assist investors in their decision-making process, and making financial investments based solely on the results of this analysis may result in harmful transactions. Even if all metrics produce a positive, negative or neutral result at the same time, the expected results may not be seen according to market conditions. Investors reviewing the report would be well advised to heed these caveats.
Legal Notice
The investment information, comments and recommendations contained in this document do not constitute investment advisory services. Investment advisory services are provided by authorized institutions on a personal basis, taking into account the risk and return preferences of individuals. The comments and recommendations contained in this document are of a general type. These recommendations may not be suitable for your financial situation and risk and return preferences. Therefore, making an investment decision based solely on the information contained in this document may not result in results that are in line with your expectations.
NOTE: All data used in Bitcoin onchain analysis is based on Cryptoqaunt.