
Active Adresses
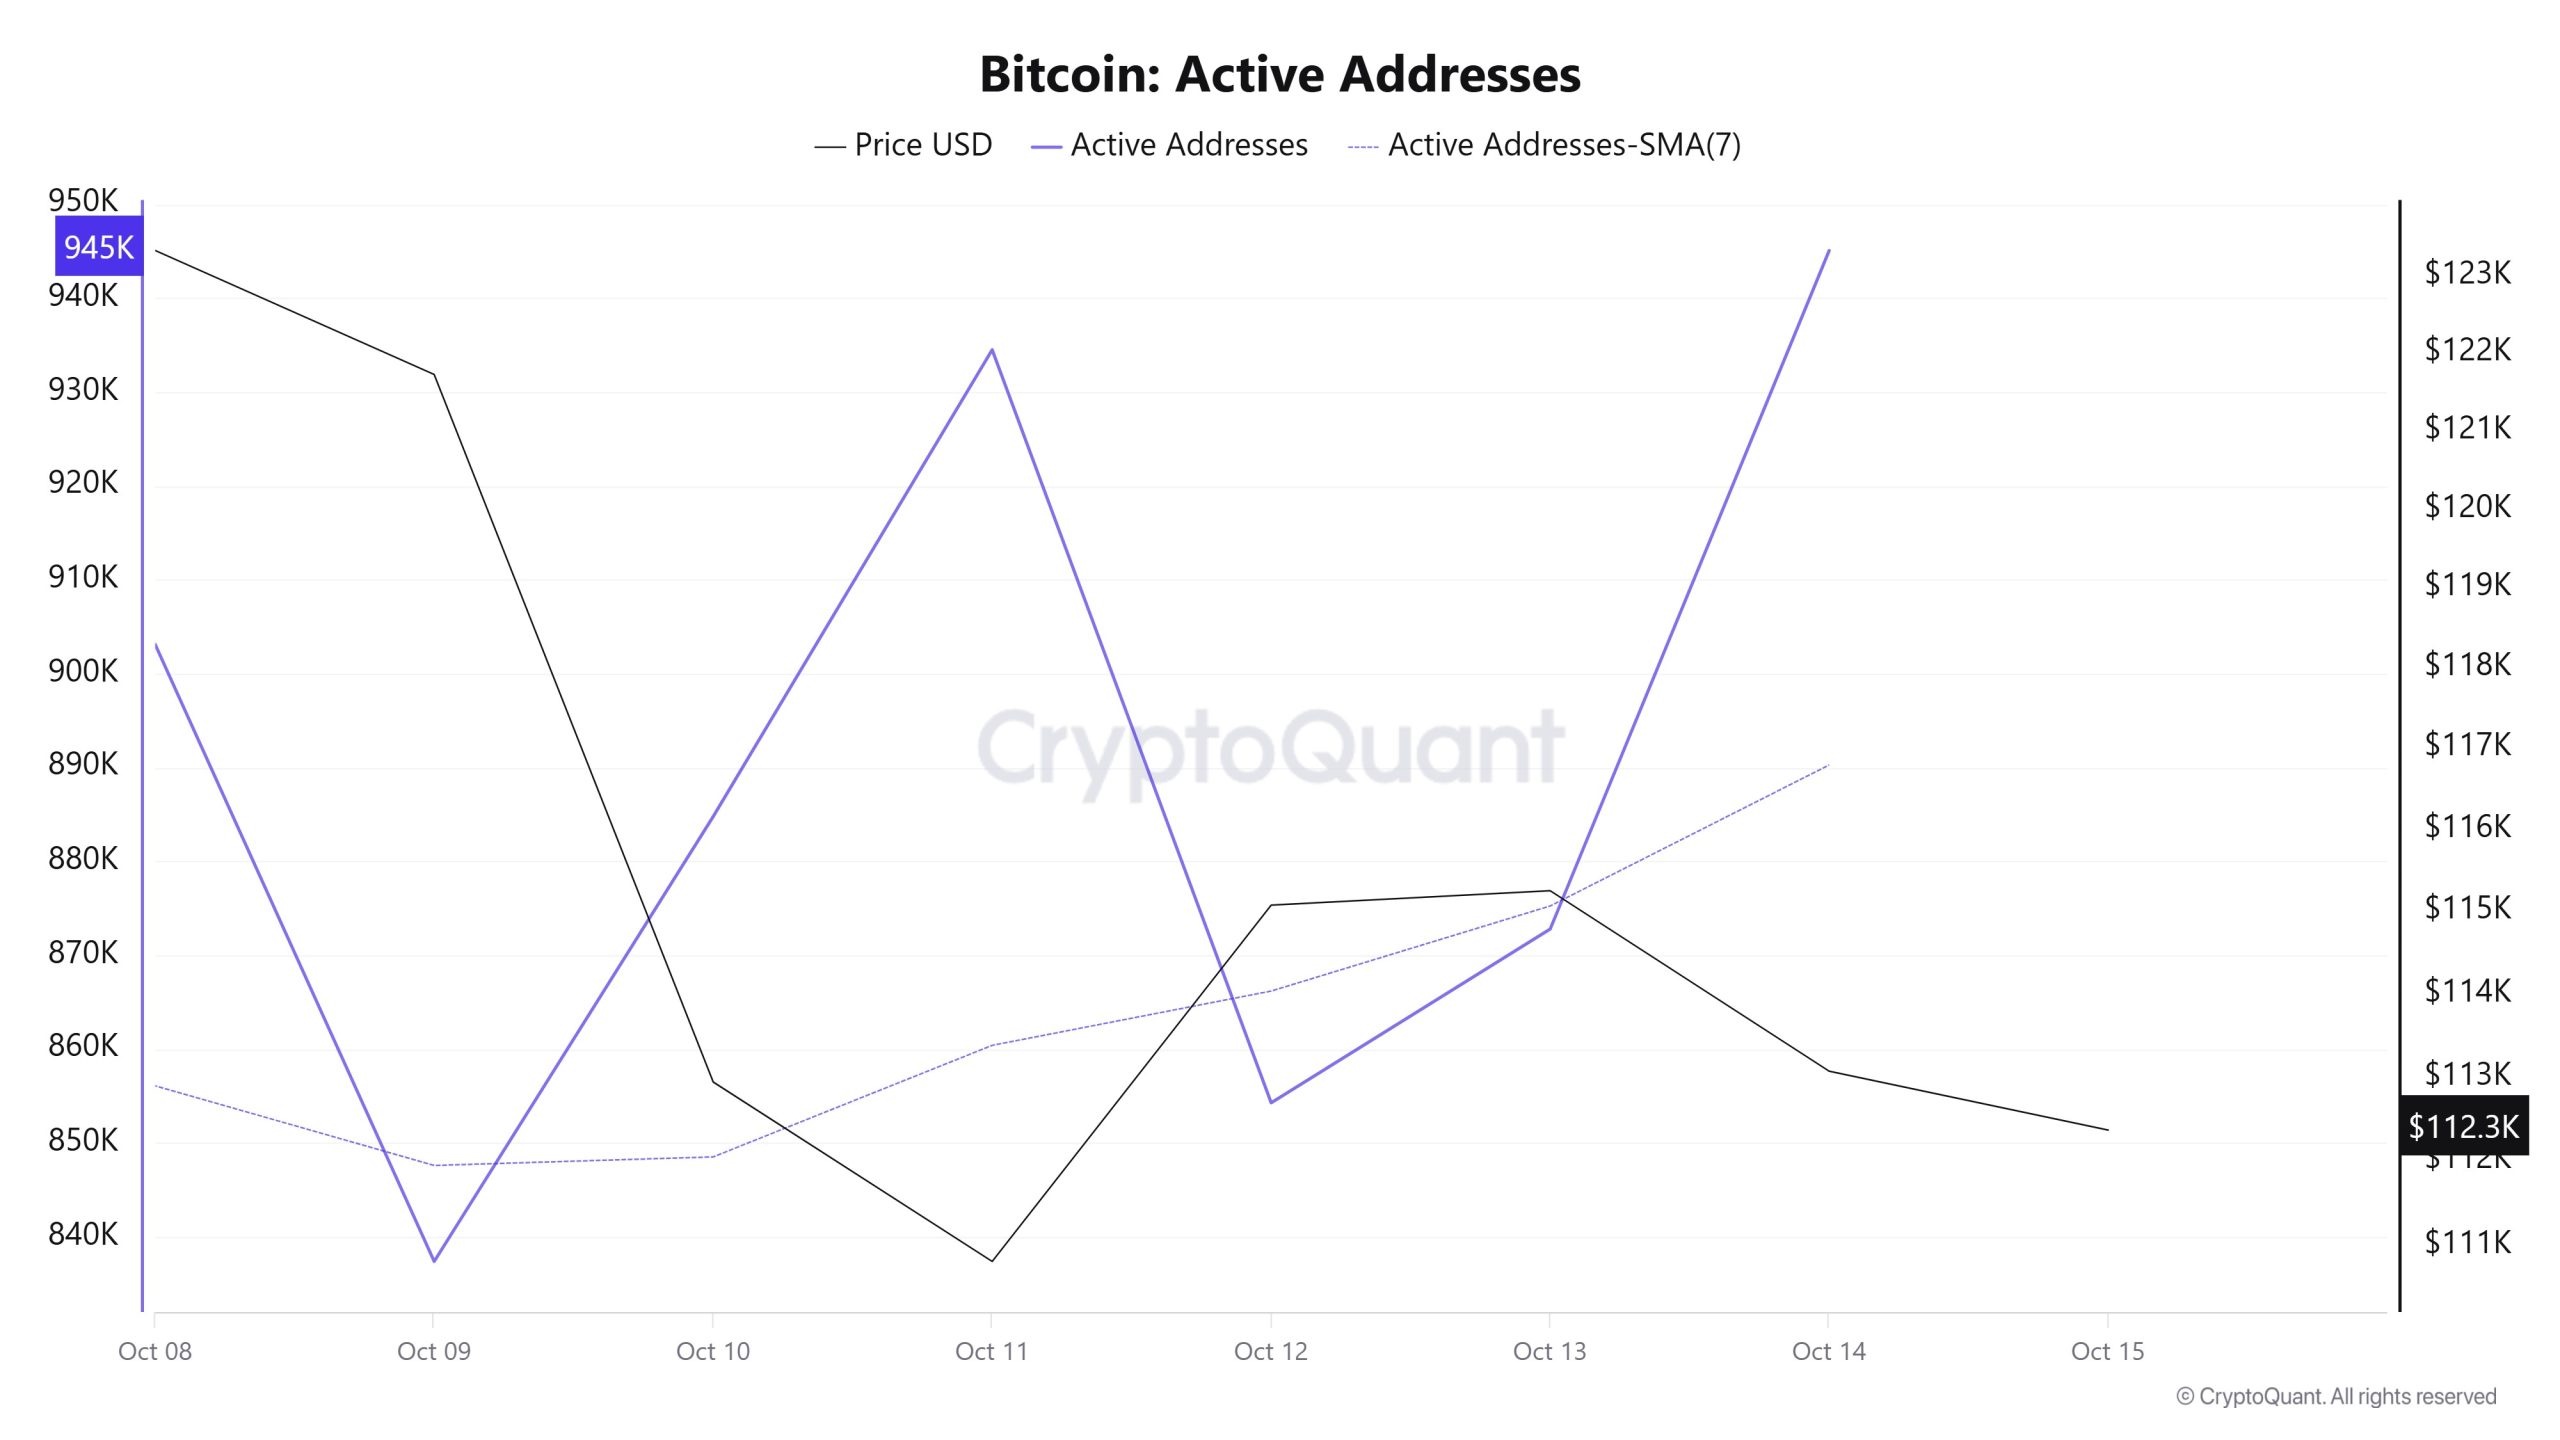
Between October 8 and October 15, 945,086 active addresses entered the Bitcoin network. During this period, the Bitcoin price rose up to $123,000. Especially on October 11, the number of active addresses increased, while the Bitcoin price fell to $110,000. From a technical perspective, it is noteworthy that the 7-day simple moving average (SMA) is moving down. This technical signal indicates a sell-off on the market.
Active Sending Addresses
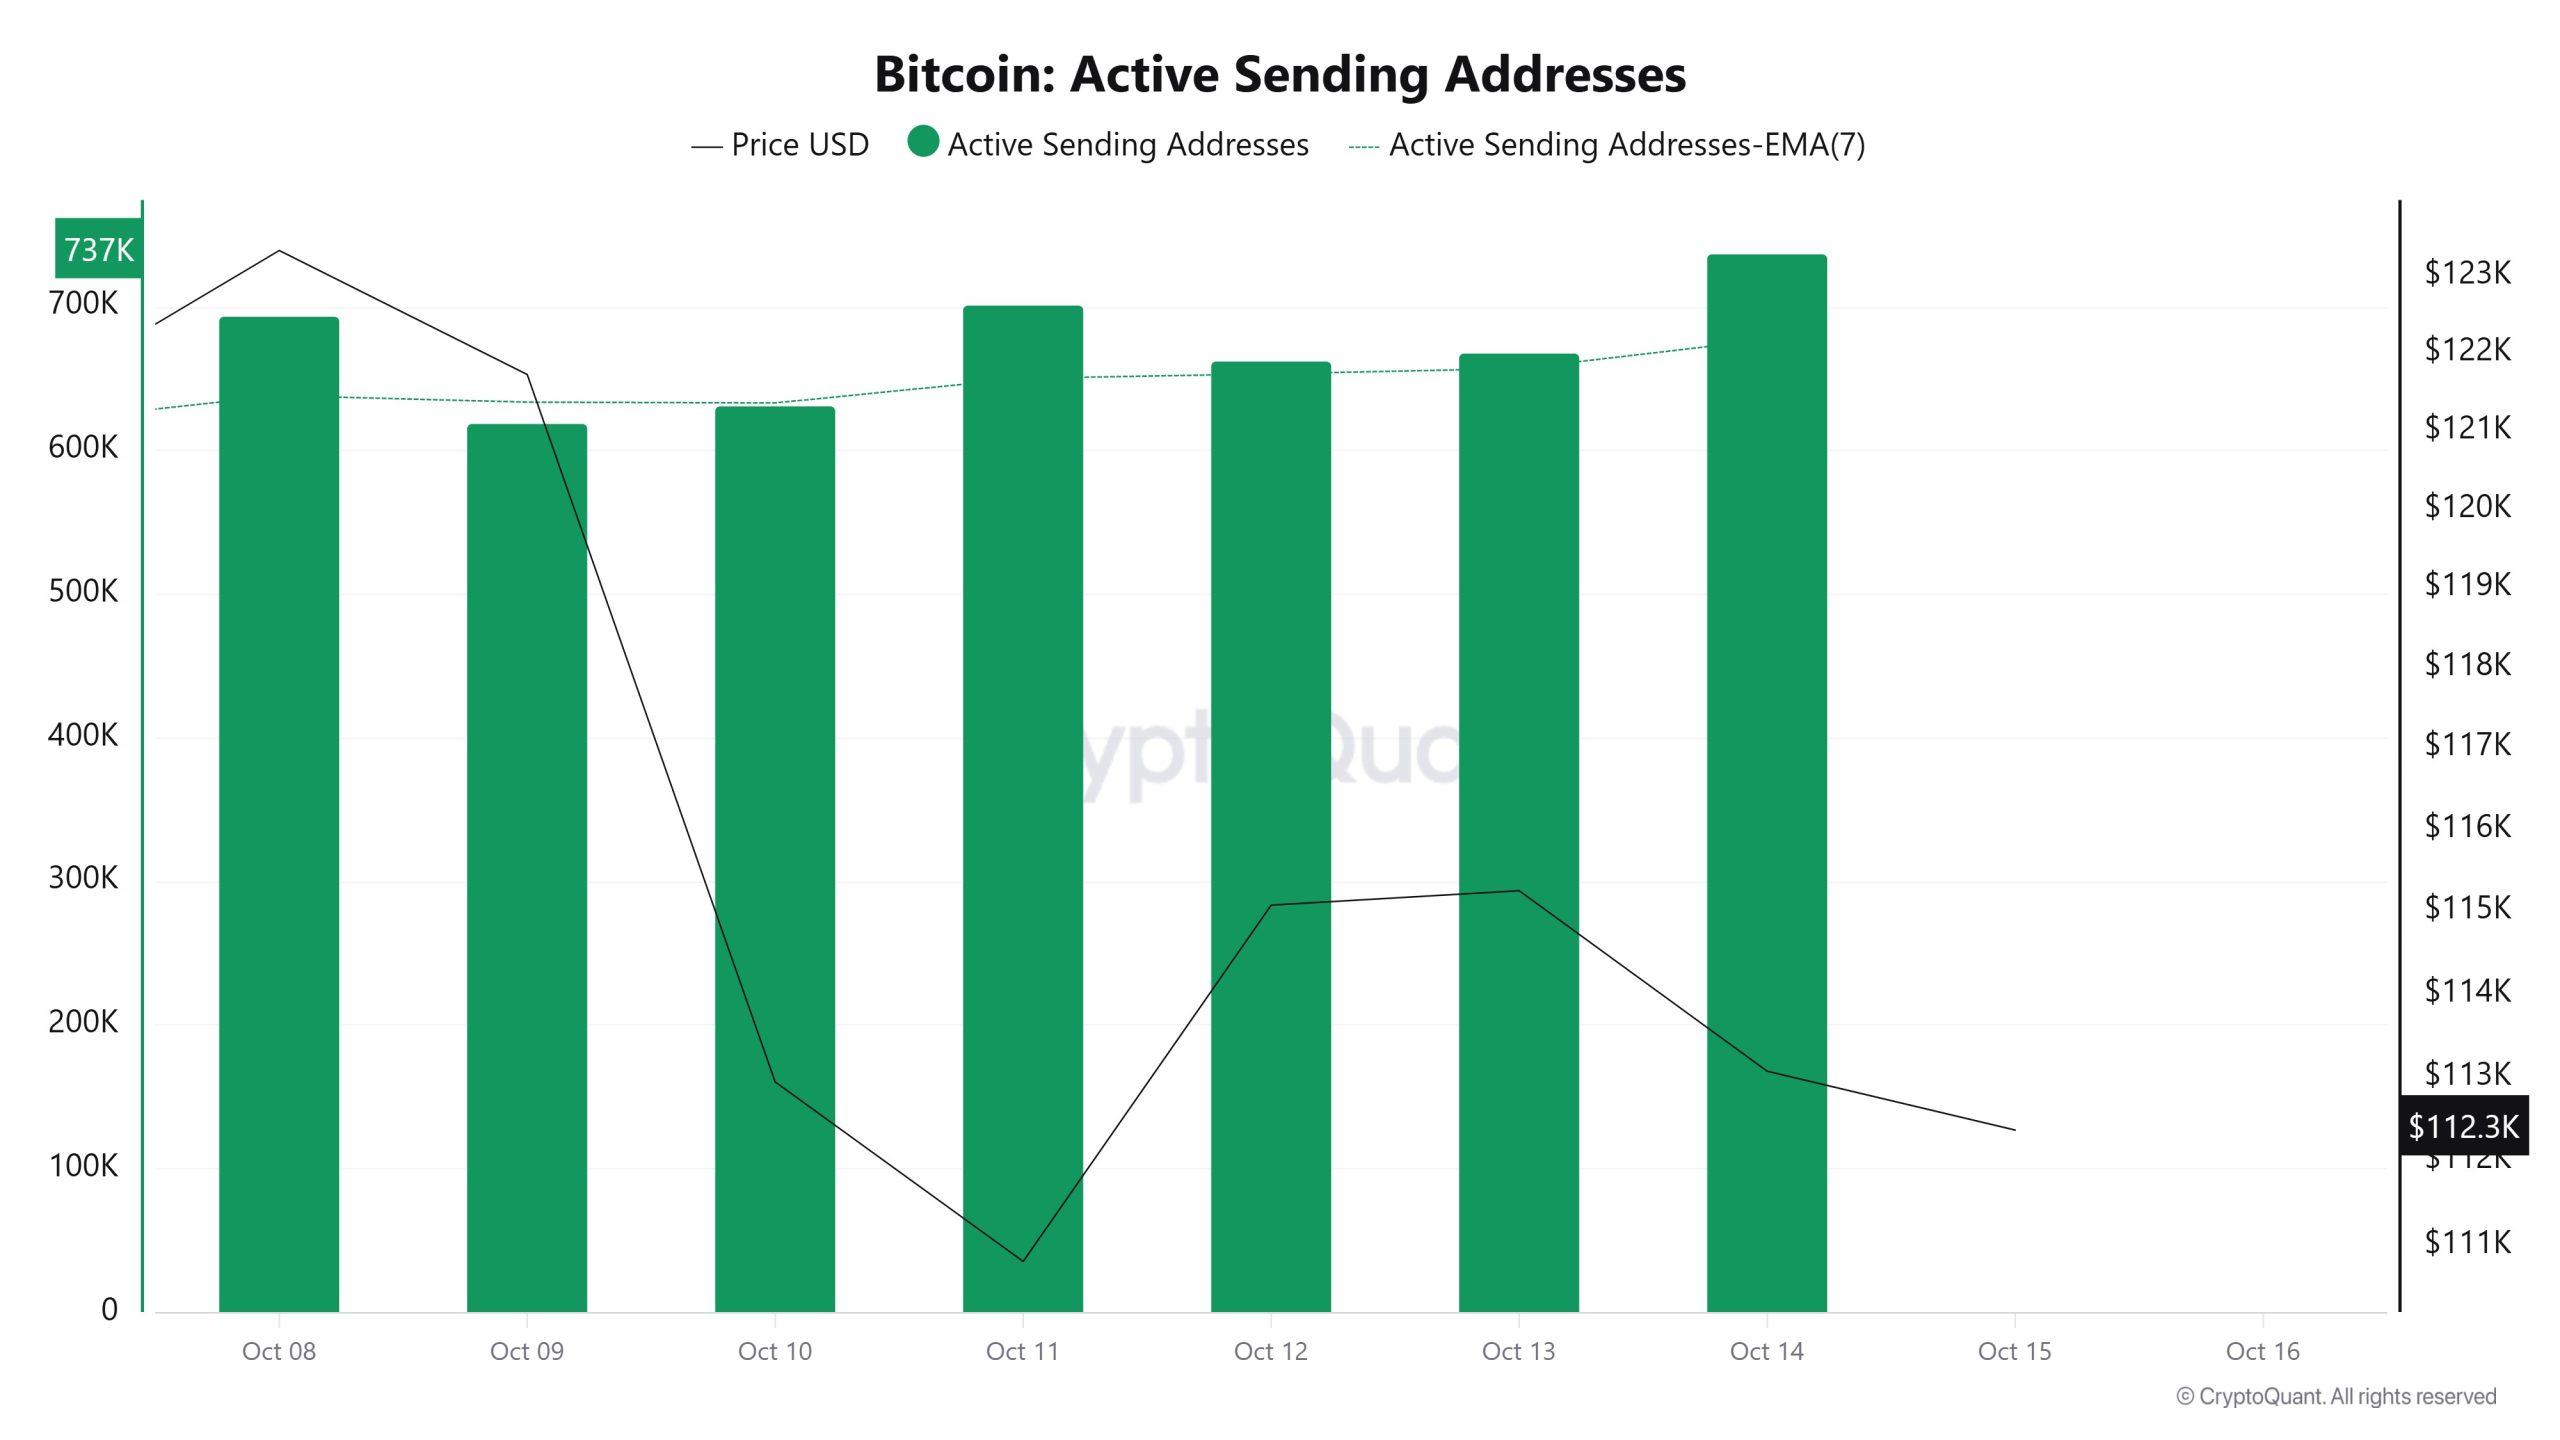 Between October 8 and October 15, there was an upward trend in the “Active Sending Addresses” metric. On the day of the price high, this metric stood at 694,468, indicating that user activity on the Bitcoin network has moved in tandem with the price. This data shows that the $123,000 level is not only supported by price, but also by sales in terms of on-chain address activity . Overall, the Active Sending Addresses metric trended higher during this period.
Active Receiving Addresses
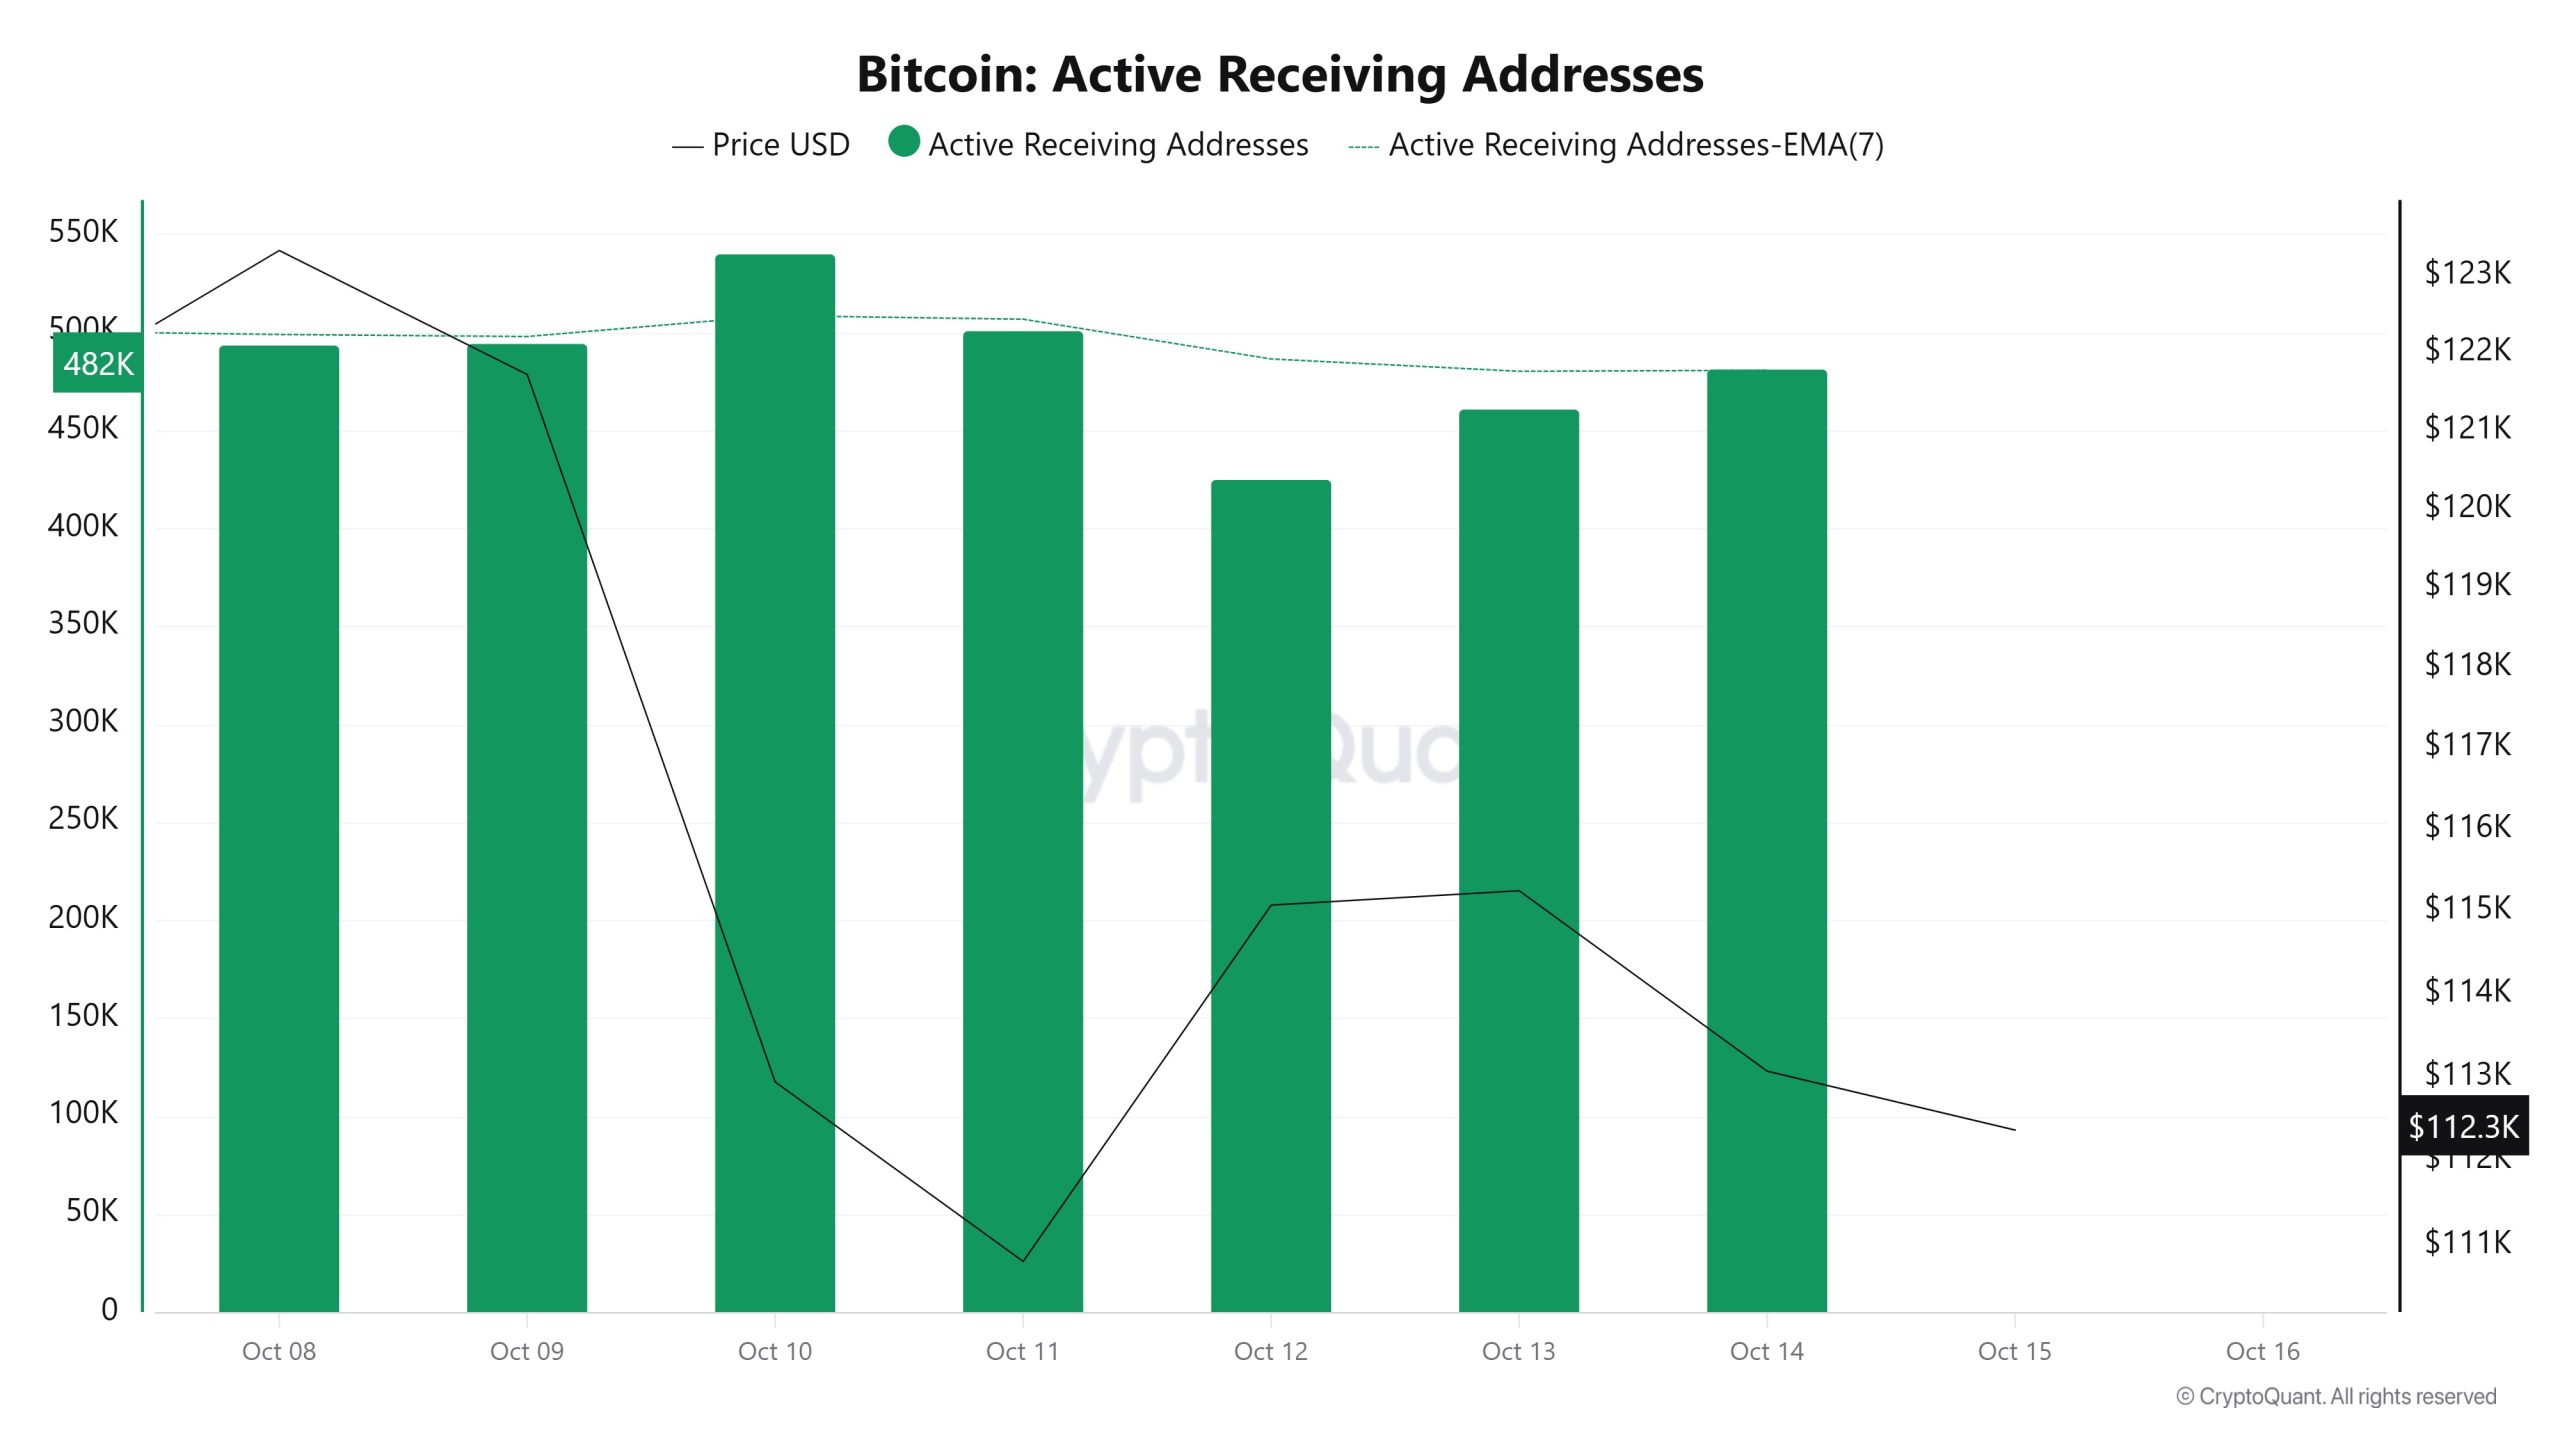 Between October 8th and October 15th, there was a regular rise in active buy addresses with the Black Line (price line). On the day the price reached its high, active buying addresses rose as high as 540,472, indicating that buyers bought Bitcoin at around $112,000.
Breakdowns
MRVR
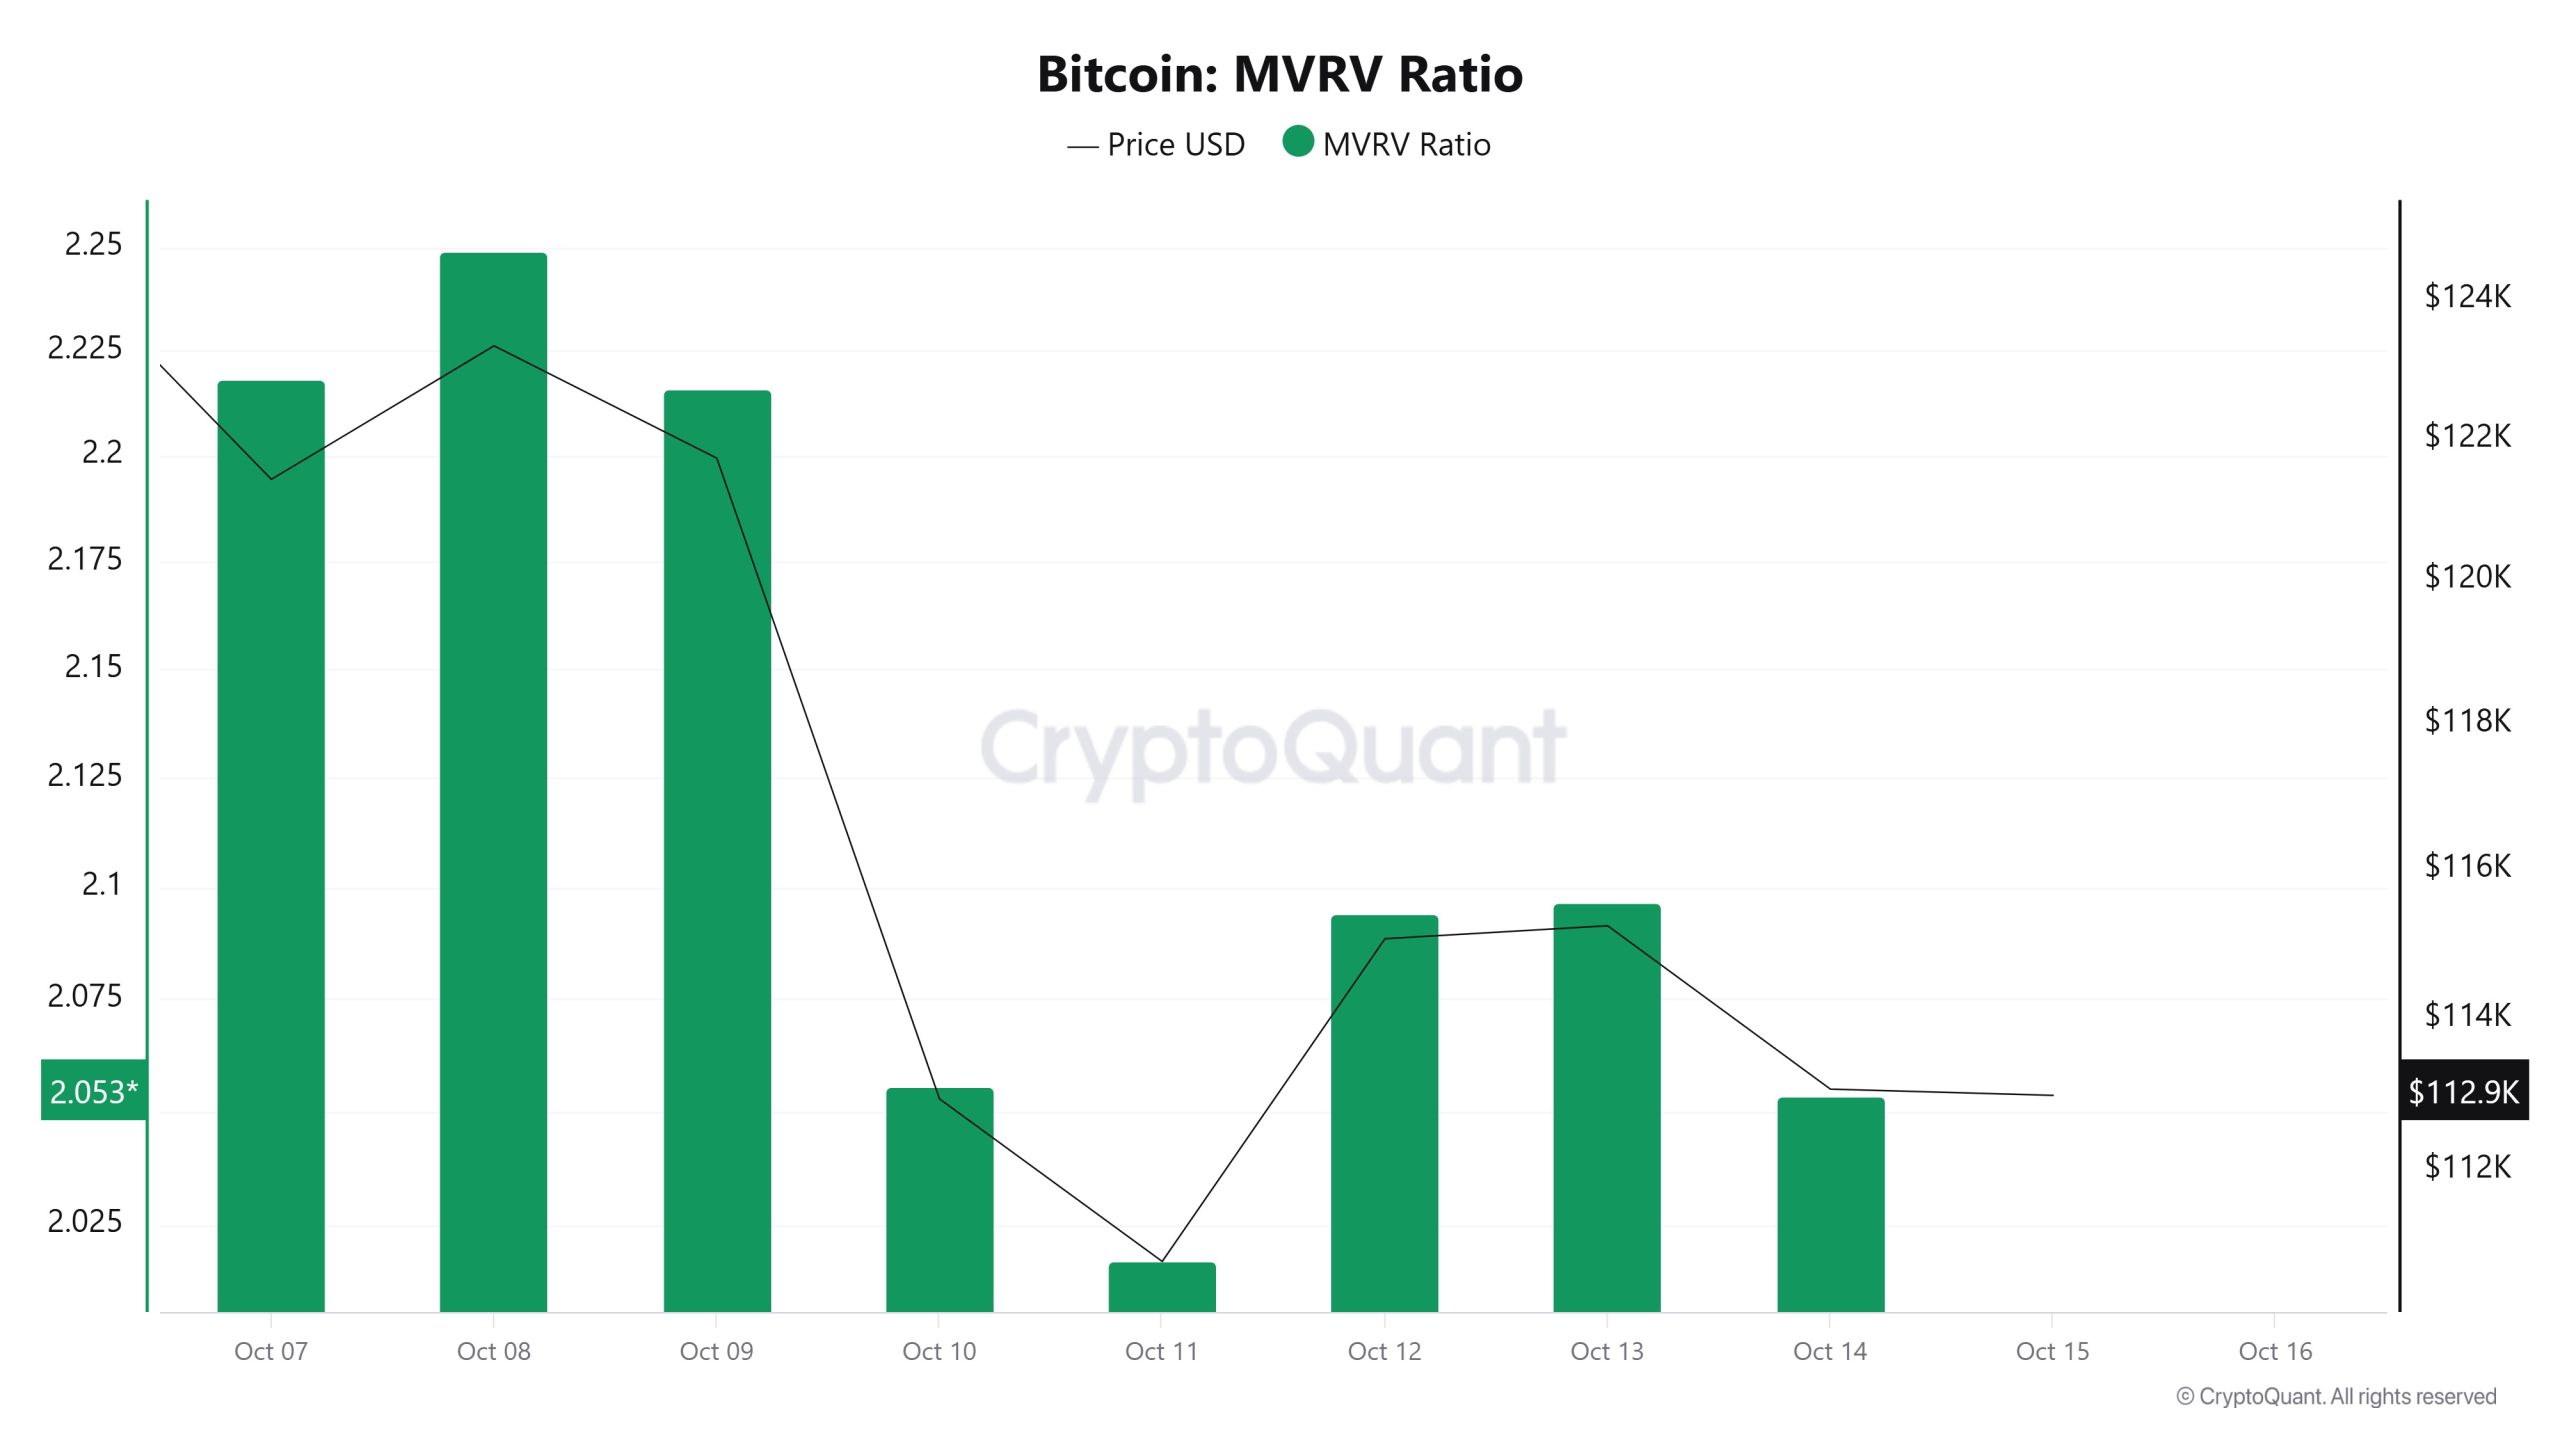 On October 8, the Bitcoin price was at $123,328 while the MVRV Ratio was 2.249.
As of October 14, the Bitcoin price was at $113,070, down 8.32%, while the MVRV Ratio was at 2,053, down 8.71%.
Realized Price
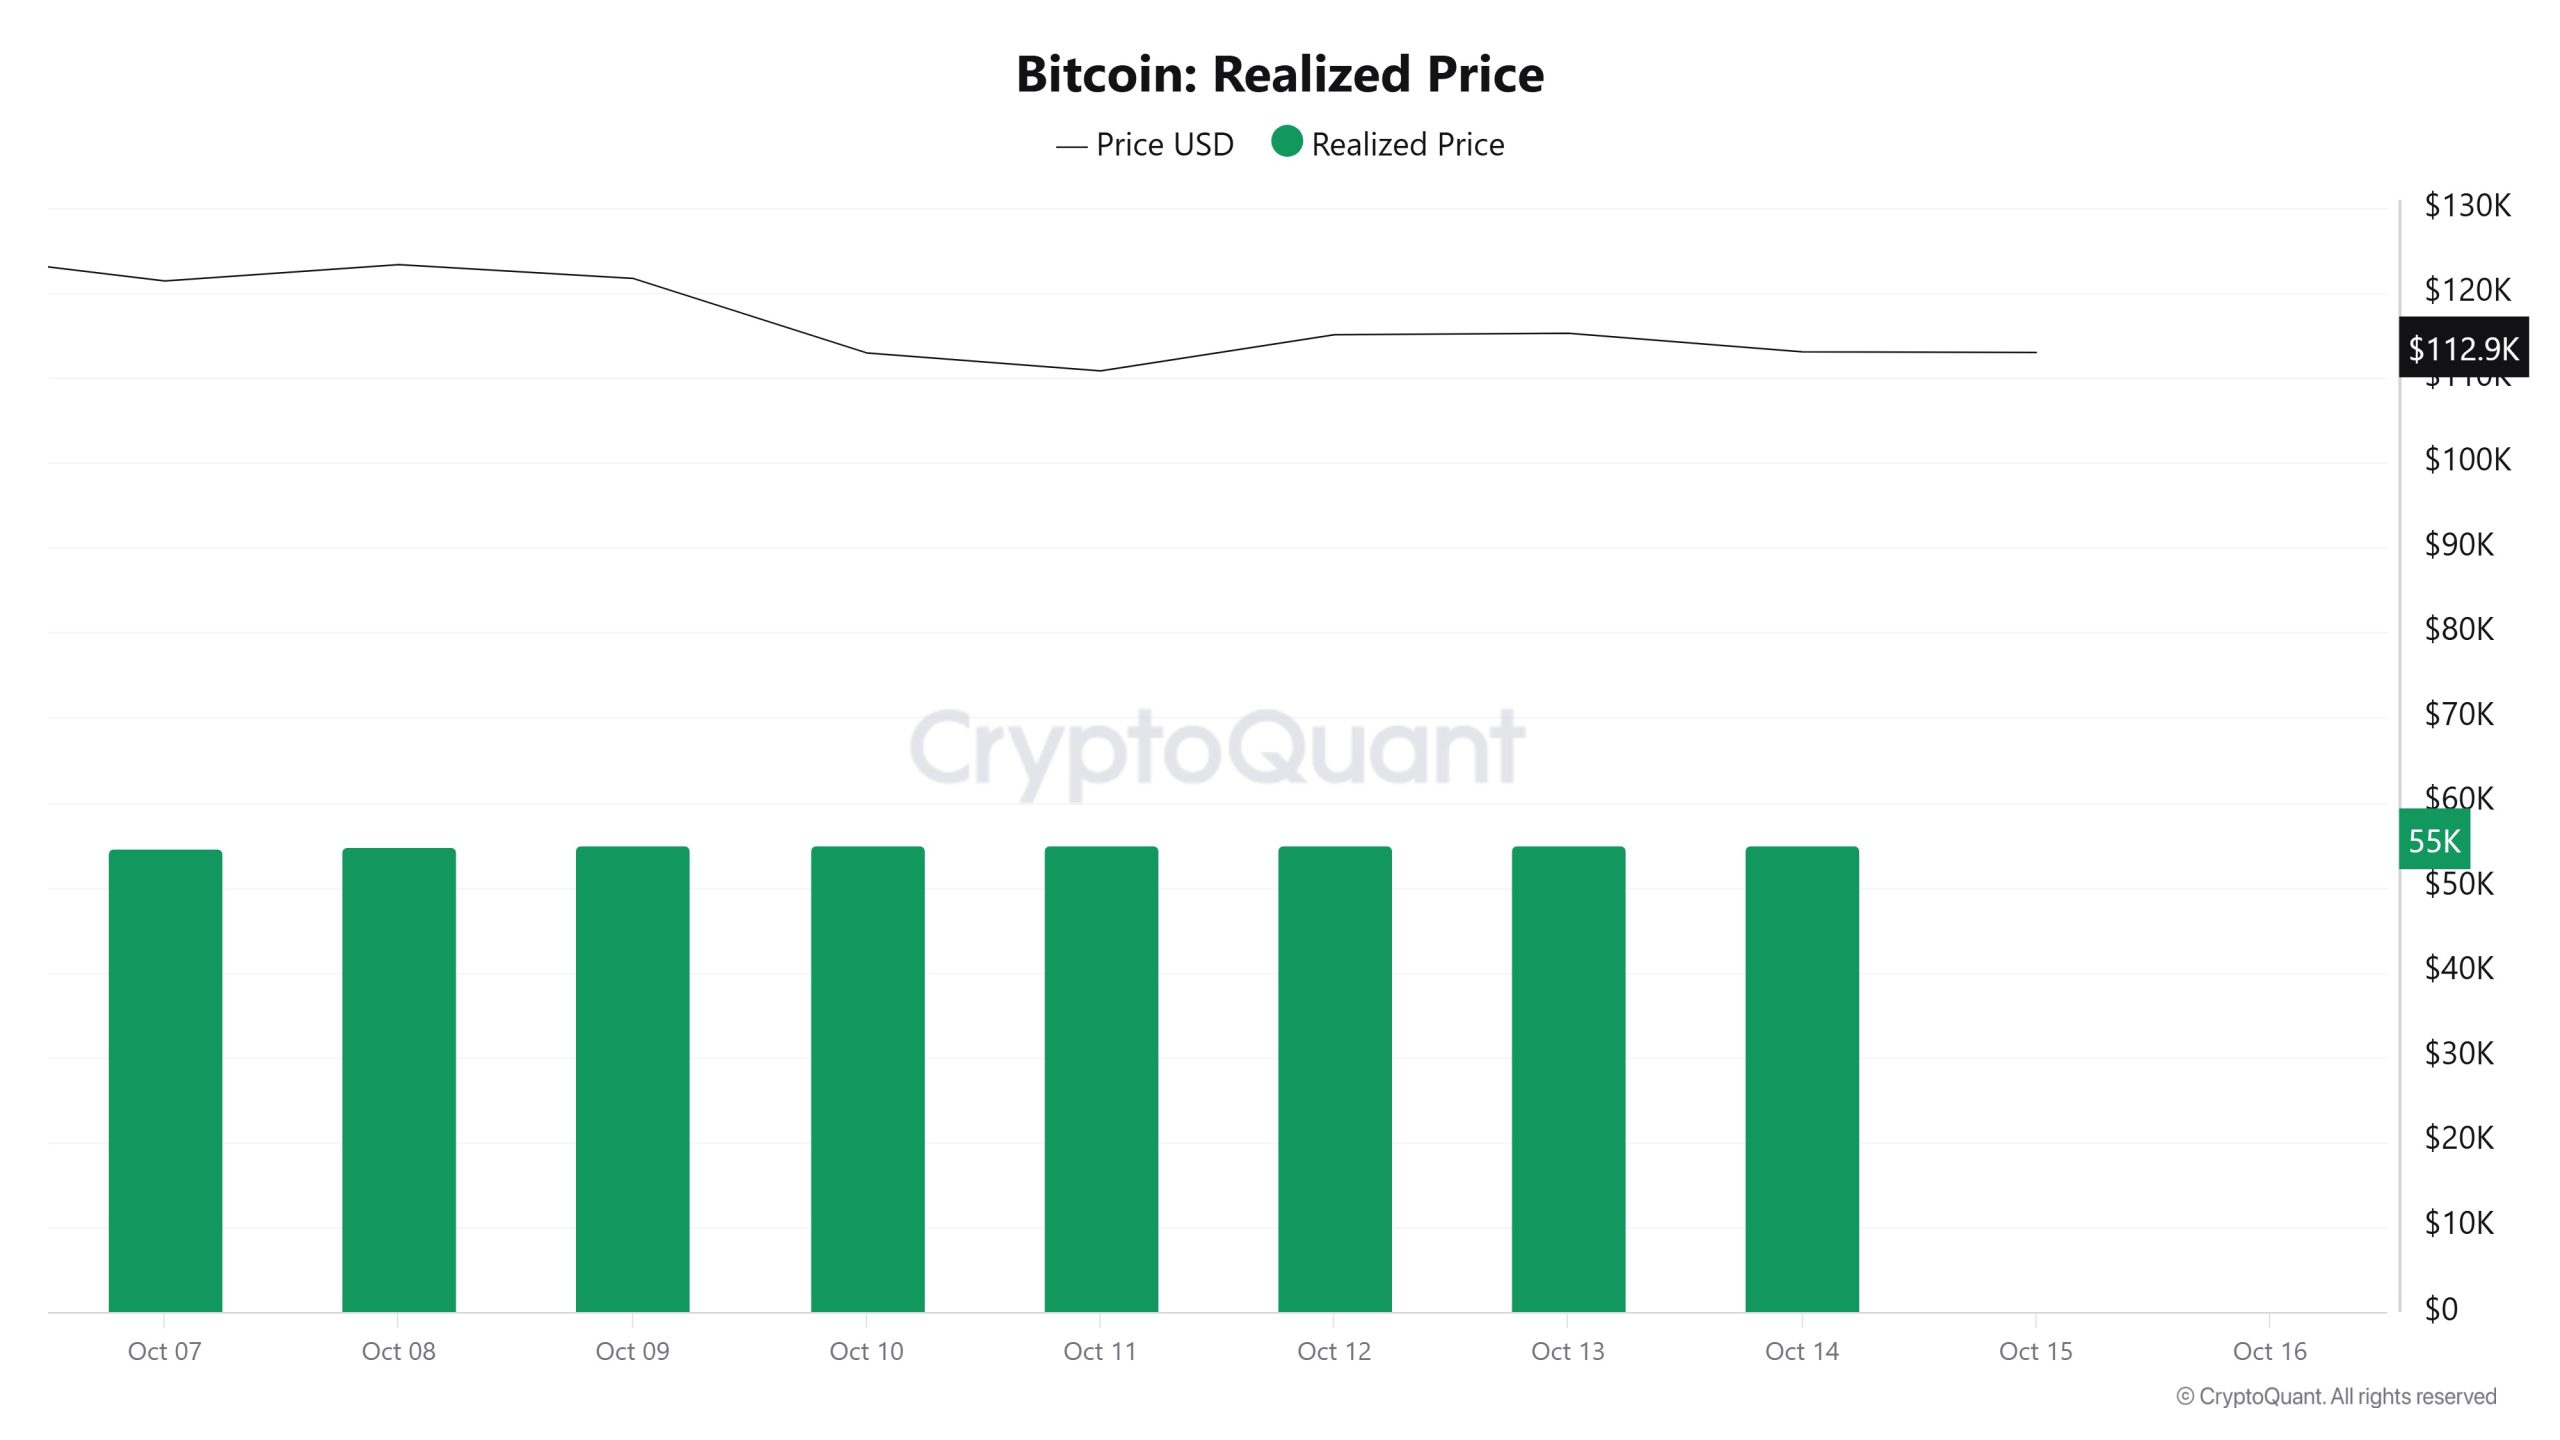 On October 8, the Bitcoin price was $123,328 while the Realized Price was 54,832. As of October 14, Bitcoin price fell to $113,070, while Realized Price rose to 55,061, an increase of 0.42%.
Spent Output Profit Ratio (SOPR)
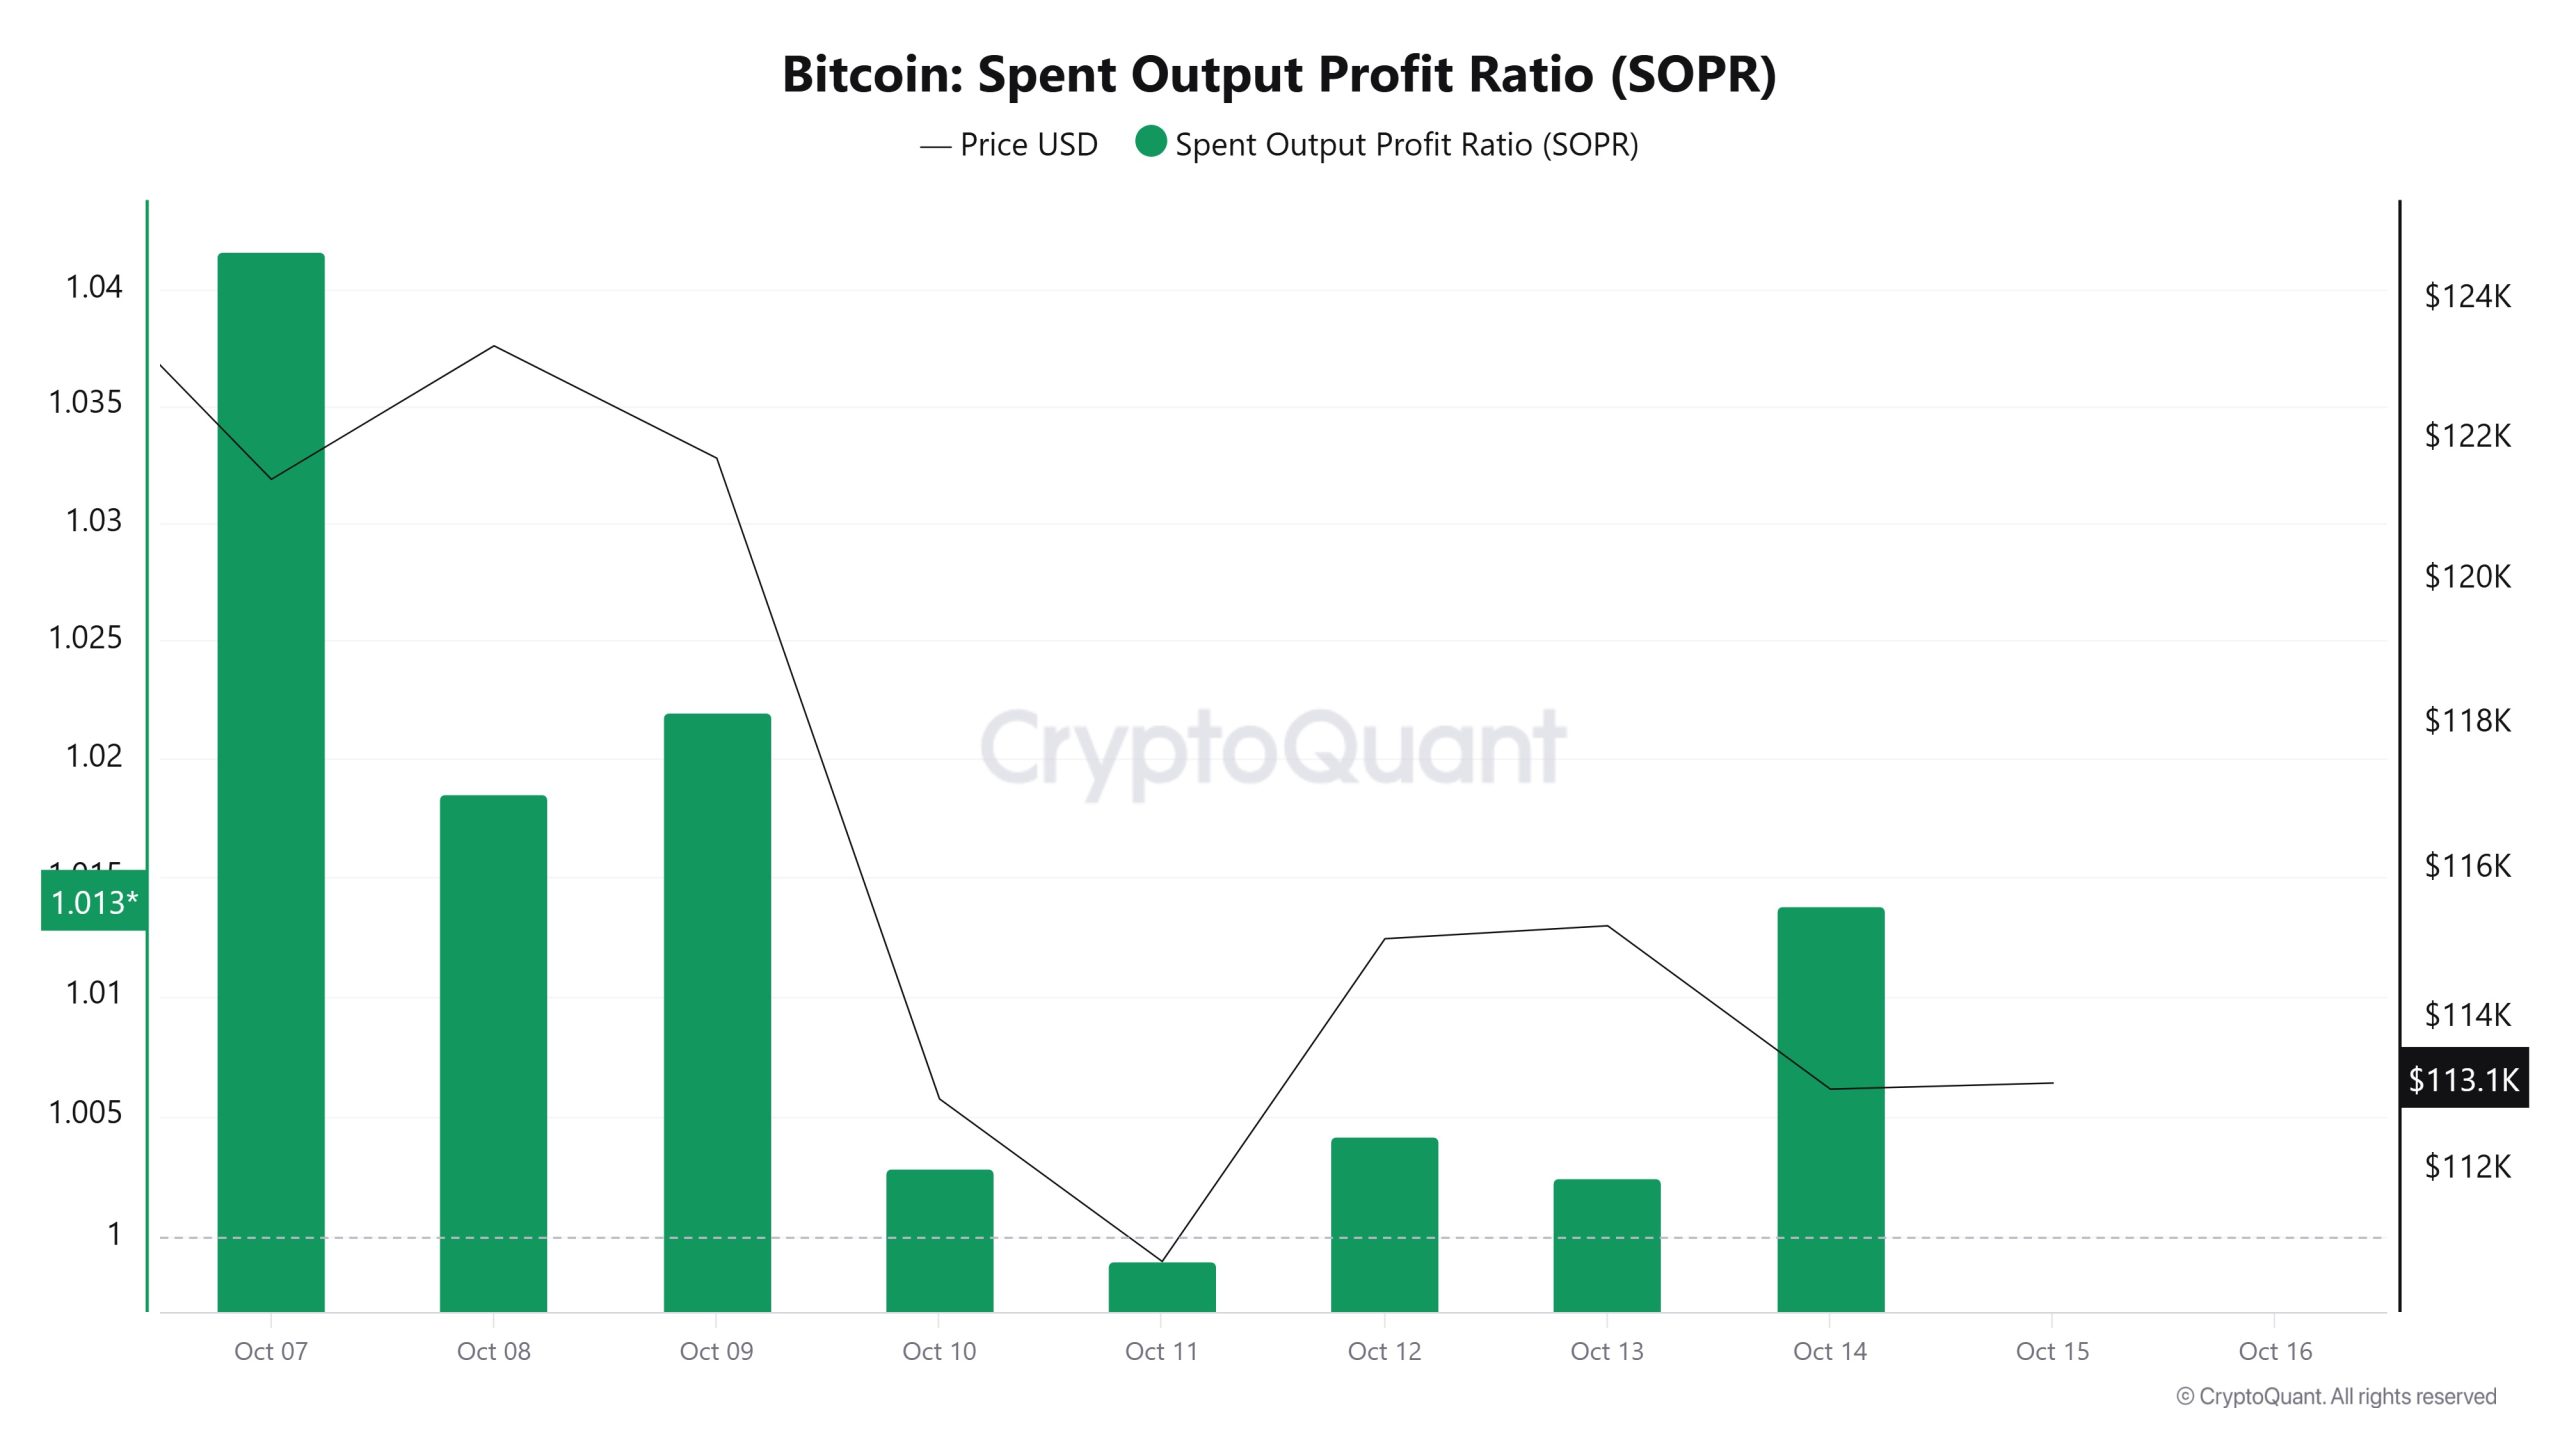 On October 8, the Bitcoin price was at $123,328 while the SOPR metric was at 1,018.
As of October 14, the Bitcoin price fell to $113,070, while the SOPR metric fell to 1,013, down 0.49%.
Derivatives
Open Interest
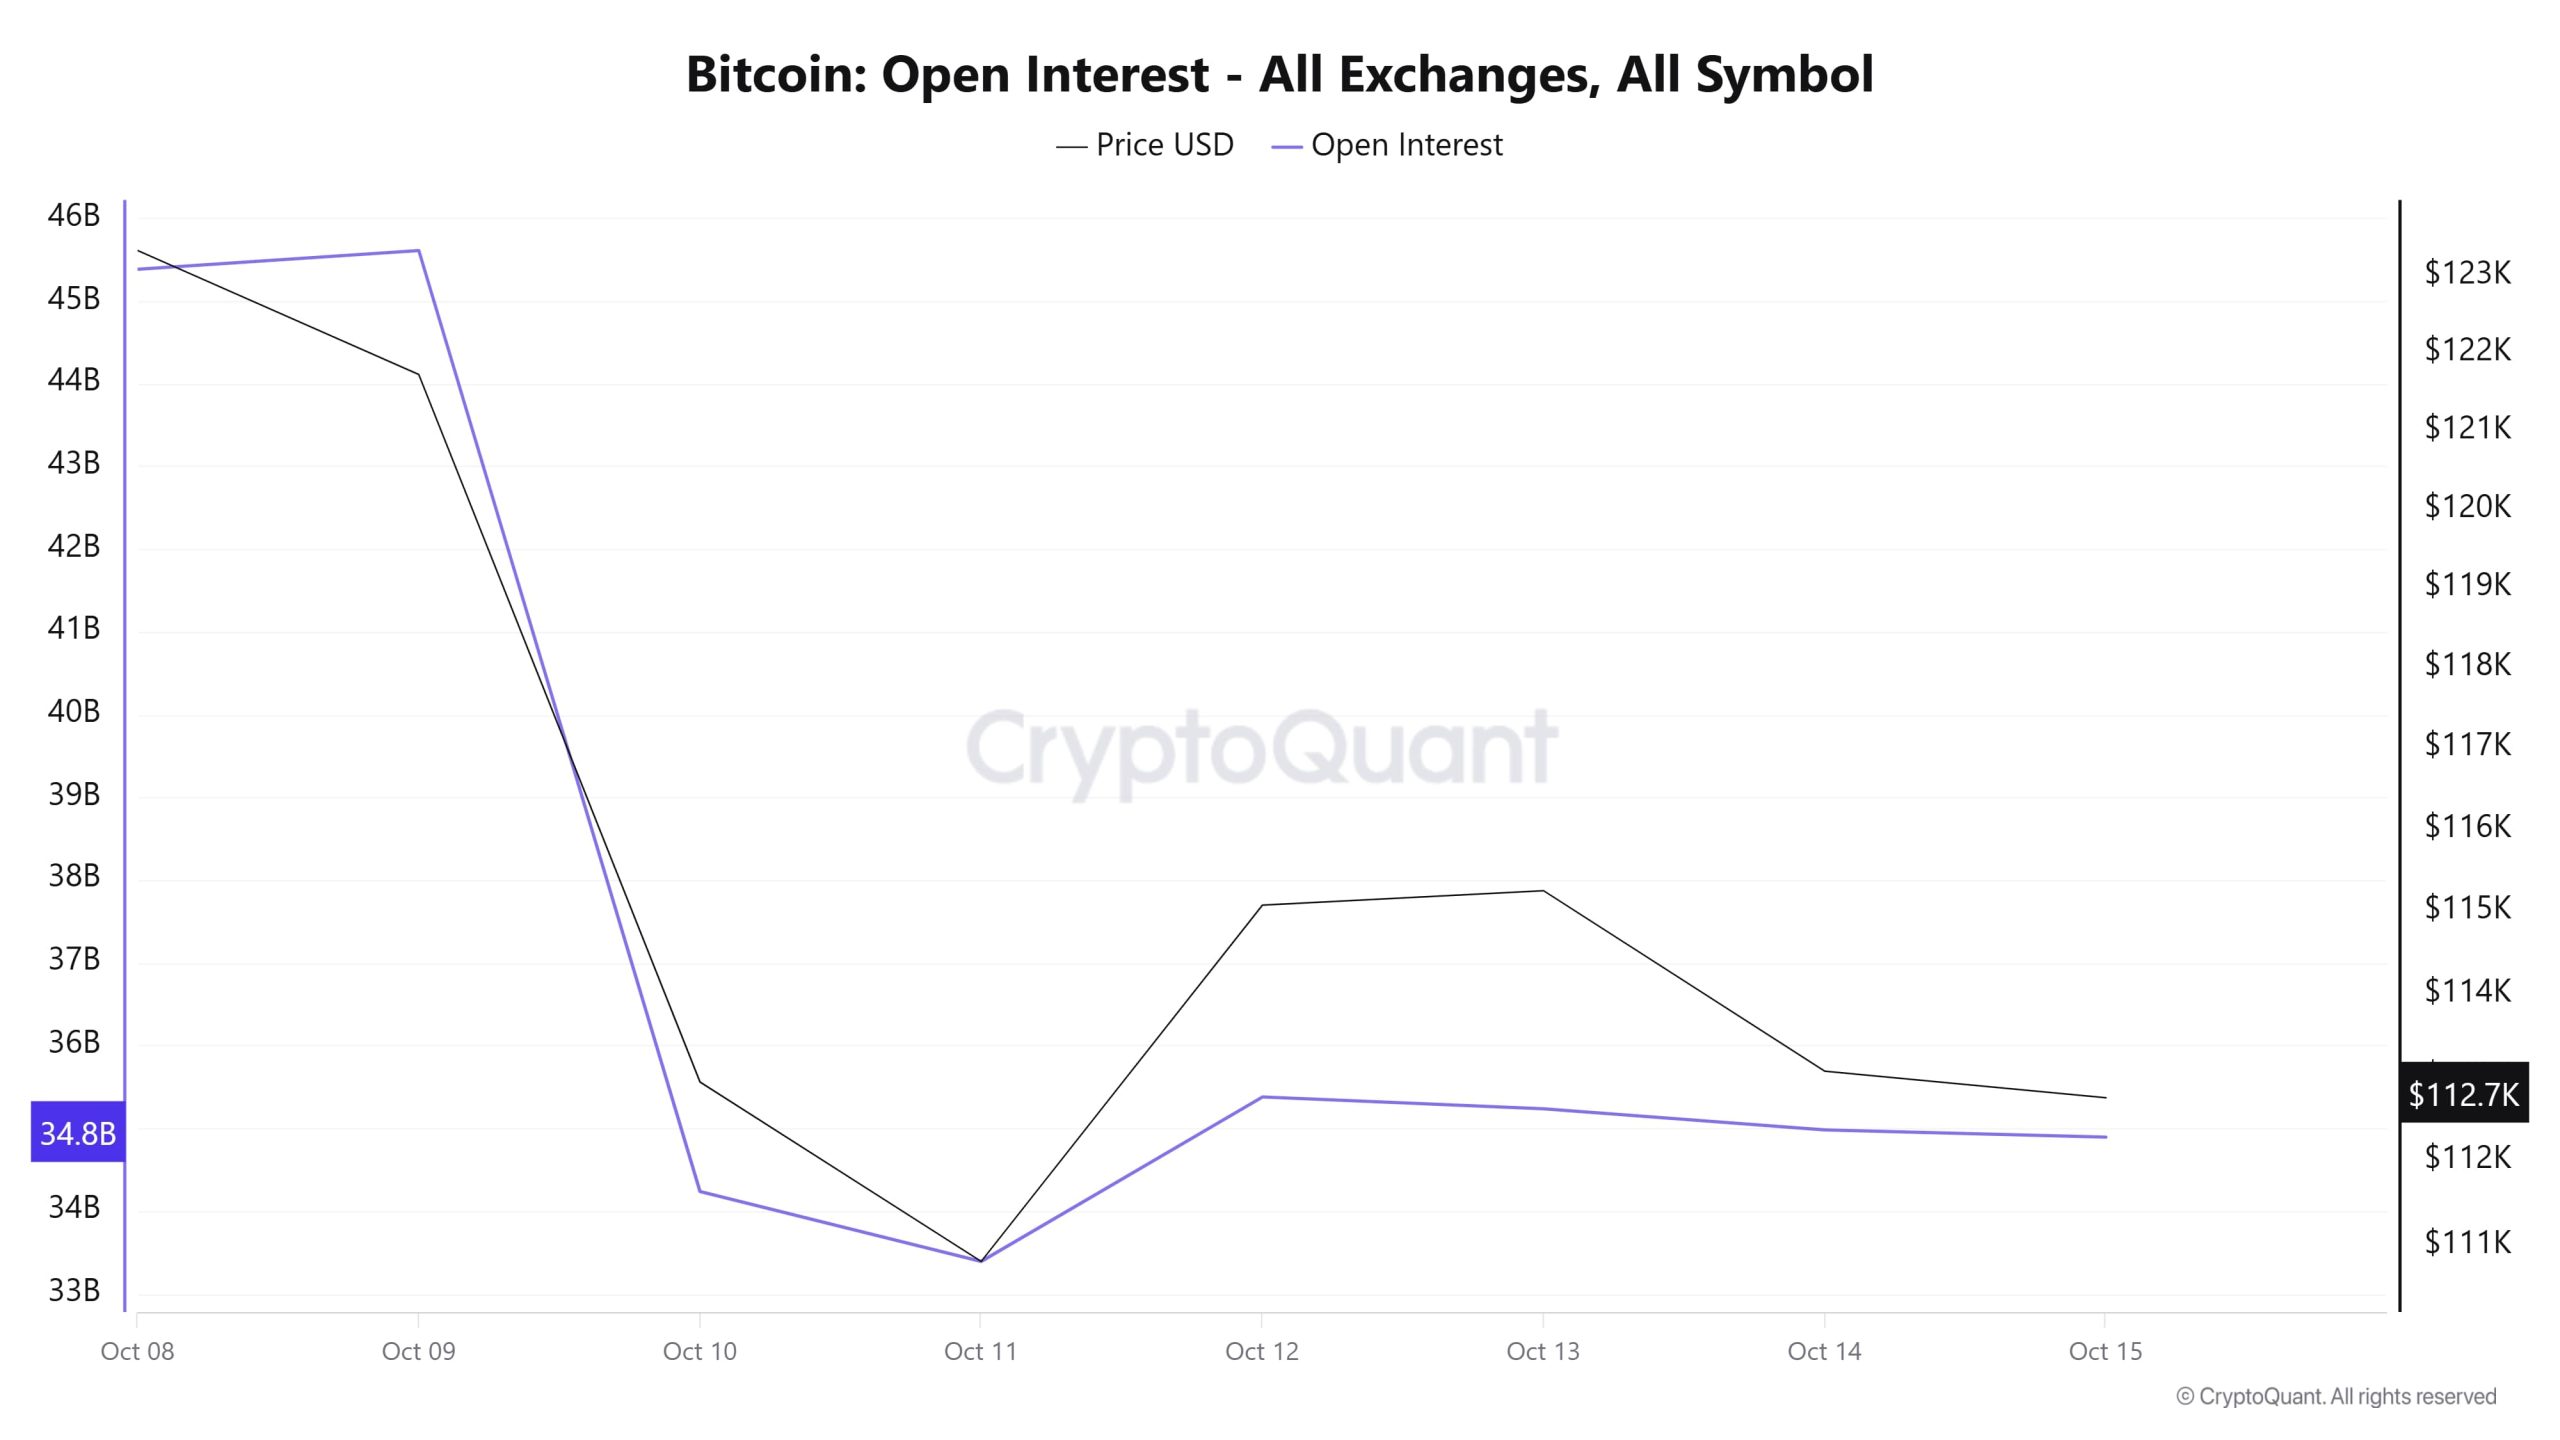
From October 8 to October 10, there is a sharp decline in both open interest and price. It can be assumed that there has been a mass closing or liquidation of leveraged positions in the market. The decline in open interest from around $45 billion to $34 billion suggests that open positions were significantly reduced. After October 10, open interest recovered slightly but failed to reach previous levels, indicating that investor interest remained weak. The price also rose slightly during the same period, but as of October 15, it was flat around $112,700. Overall, the chart shows that risk appetite in the market has diminished in the short term and investors are adopting a cautious, wait-and-see approach.
Funding Rate
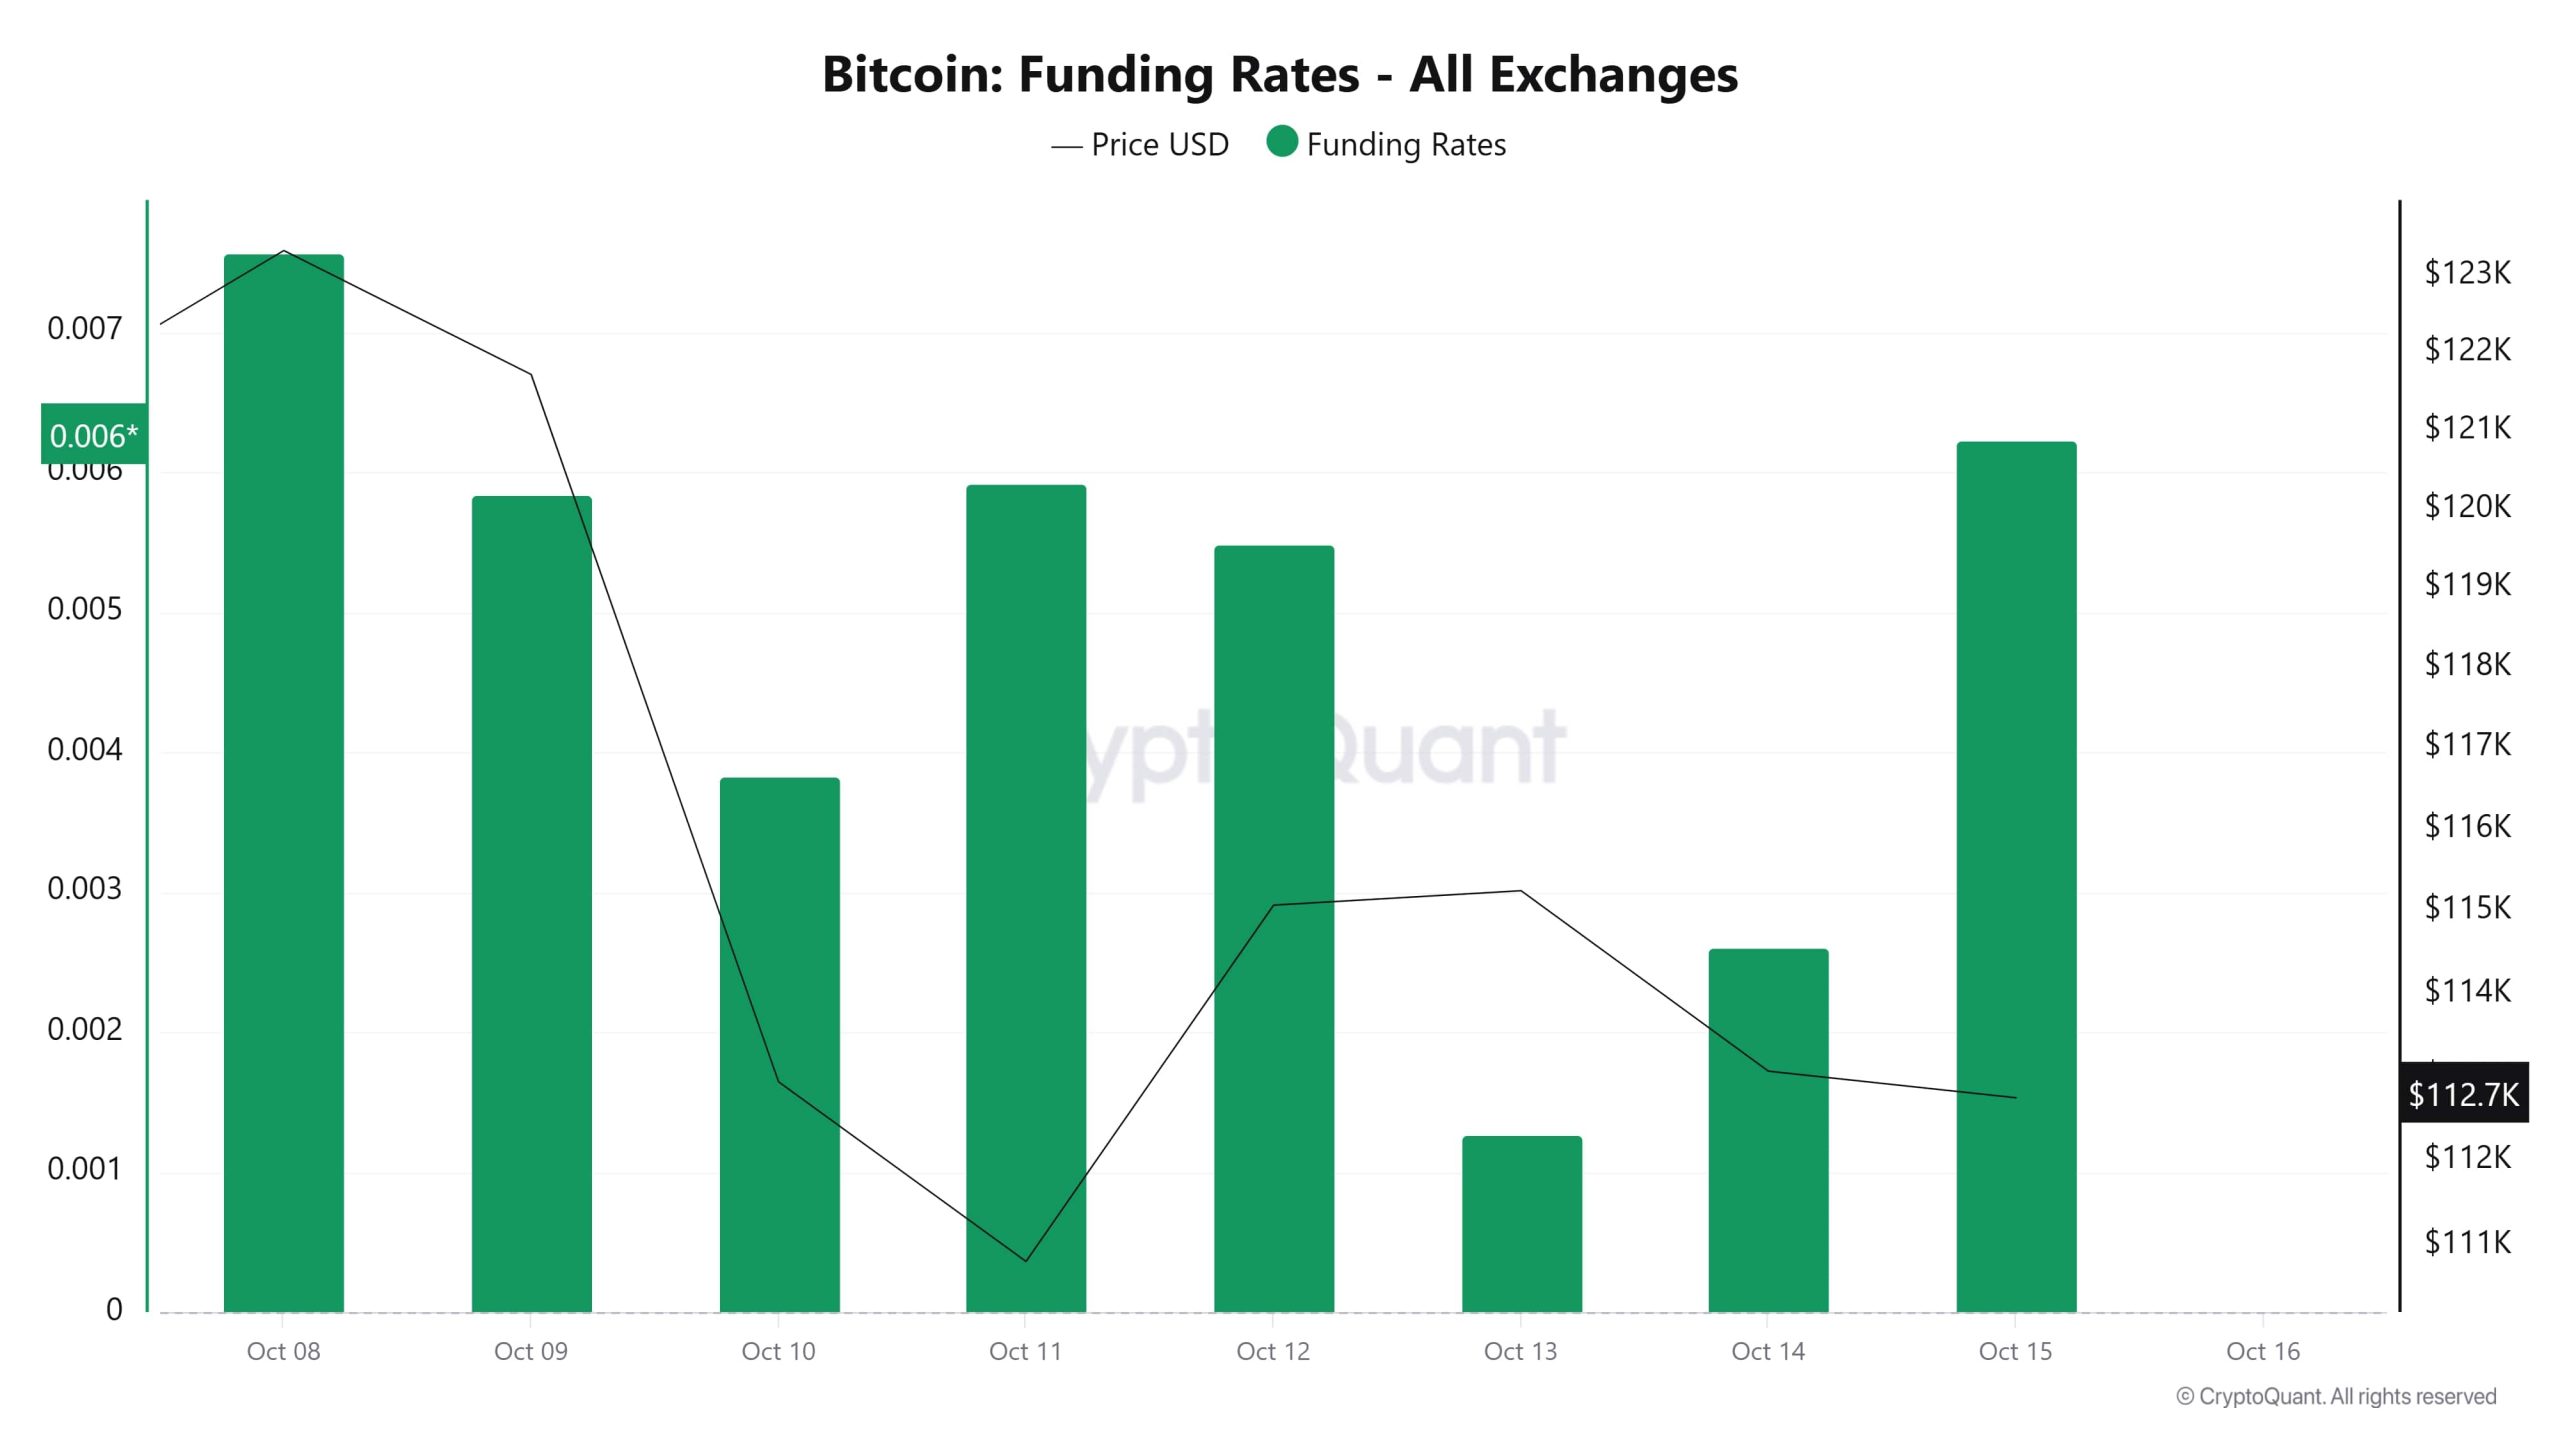 On October 8 and 9, funding rates were high, indicating that the market was predominantly long and that investors maintained bullish expectations. However, after October 9, both the price and funding rates fell sharply, indicating that this optimism quickly weakened and long positions were closed. As of October 11, there has been a gradual recovery in rates, but the reaction on the price side remains limited. Towards the end of the week, especially on October 15th, funding rates rose again, indicating that traders were back to a positive short-term expectation. The overall picture suggests that the market has stabilized after the liquidation of excessive long positions and investors have started to take risks in a controlled manner.
Long & Short Liquidations
With the sharp decline in the cryptocurrency market on Friday last week, there was a huge liquidation on BTC. 1.8 billion dollars of long and 390 million dollars of short trades were liquidated.
| Dates | Long Amount (Million $) | Short Amount (Million $) |
|---|---|---|
| 08 October | 17.90 | 59.87 |
| 09 October | 131.55 | 30.42 |
| 10 October | 1,050.48 | 133.69 |
| 11 October | 441.31 | 27.82 |
| 12 October | 32.39 | 71.33 |
| 13 October | 19.87 | 30.97 |
| 14 October | 145.35 | 36.88 |
| Total | 1,838.85 | 390.98 |
Supply Distribution
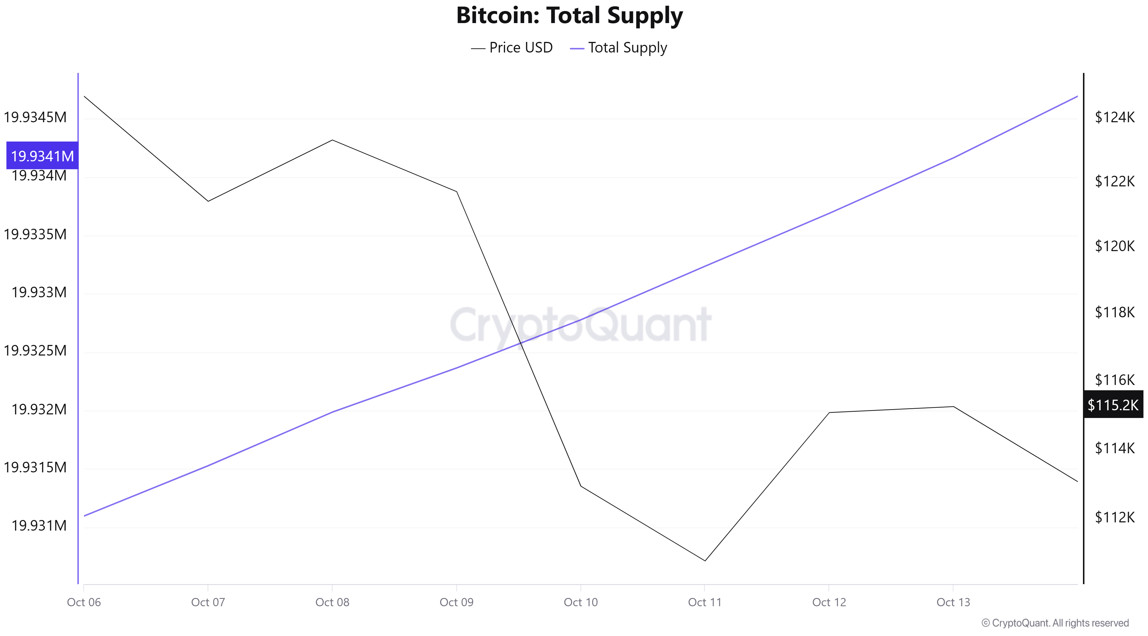
Total Supply: 19,934,164 units, up about 0.015% from last week.
New Supply: The amount of BTC produced this week was 3,068.
Velocity: Velocity, which was 12.11 last week, was 12.13 as of October 13.
| Wallet Category | 06.10.2025 | 13.10.2025 | Change (%) |
|---|---|---|---|
| < 1 BTC | 8.4364% | 8.4366% | 0.0024% |
| 1 – 10 BTC | 11.3598% | 11.3536% | -0.0546% |
| 10 – 100 BTC | 24.5350% | 24.5032% | -0.1296% |
| 100 – 1k BTC | 30.3649% | 30.4374% | 0.2383% |
| 1k – 10k BTC | 17.5290% | 17.5146% | -0.0823% |
| 10k+ BTC | 7.7751% | 7.7543% | -0.2679% |
According to the latest weekly data, Bitcoin wallet distribution has been mixed. The share of wallets holding <1 BTC increased from 8.4364% to 8.4366%, an increase of about 0.0024%. The 1-10 BTC range decreased from 11.3598% to 11.3536%, down about 0.05%. In the 10-100 BTC group, the share slipped slightly from 24.5350% to 24.5032%, down by about 0.13%. The 100-1,000 BTC range saw an increase of about 0.24%, rising from 30.3649% to 30.4374%. The 1,000-10,000 BTC band decreased from 17.5290% to 17.5146% , down about 0.08%. The share of 10,000+ BTC wallets decreased by about 0.27%, from 7.7751% to 7.7543%.
Exchange Supply Ratio
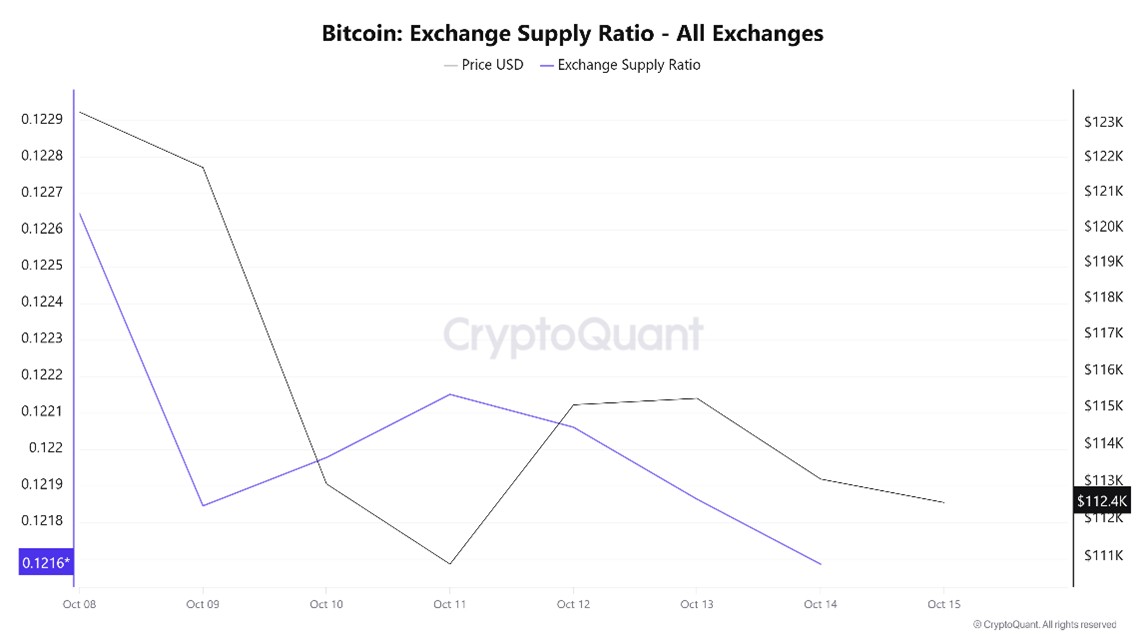
Data from the Bitcoin Exchange Supply Ratio table, which shows how much of Bitcoins are held on exchanges compared to the total supply of Bitcoins, showed low rates this week. With the arrival of the new ATH ratio for Bitcoin, the general trend is for a positive correlation between the price of Bitcoin and the rate of supply entering exchanges, with the two variables dominated by a positive correlation. It shows that most of the Bitcoins have started to be removed from wallets and the market is ready to buy.
Between October 8 and October 15, the Bitcoin Exchange Supply Ratio decreased from 0.12264602 to 0.12168517. During this period, the Bitcoin price dropped from $123,000 to $113,000. Especially this week, the two variables moved in the same direction, indicating that despite the price rise, the amount of Bitcoin supplied to exchanges has decreased, possibly indicating that long-term investors have stopped holding their assets. The price of Bitcoin is likely to be dominated by uncertainty.
Exchange Reserve
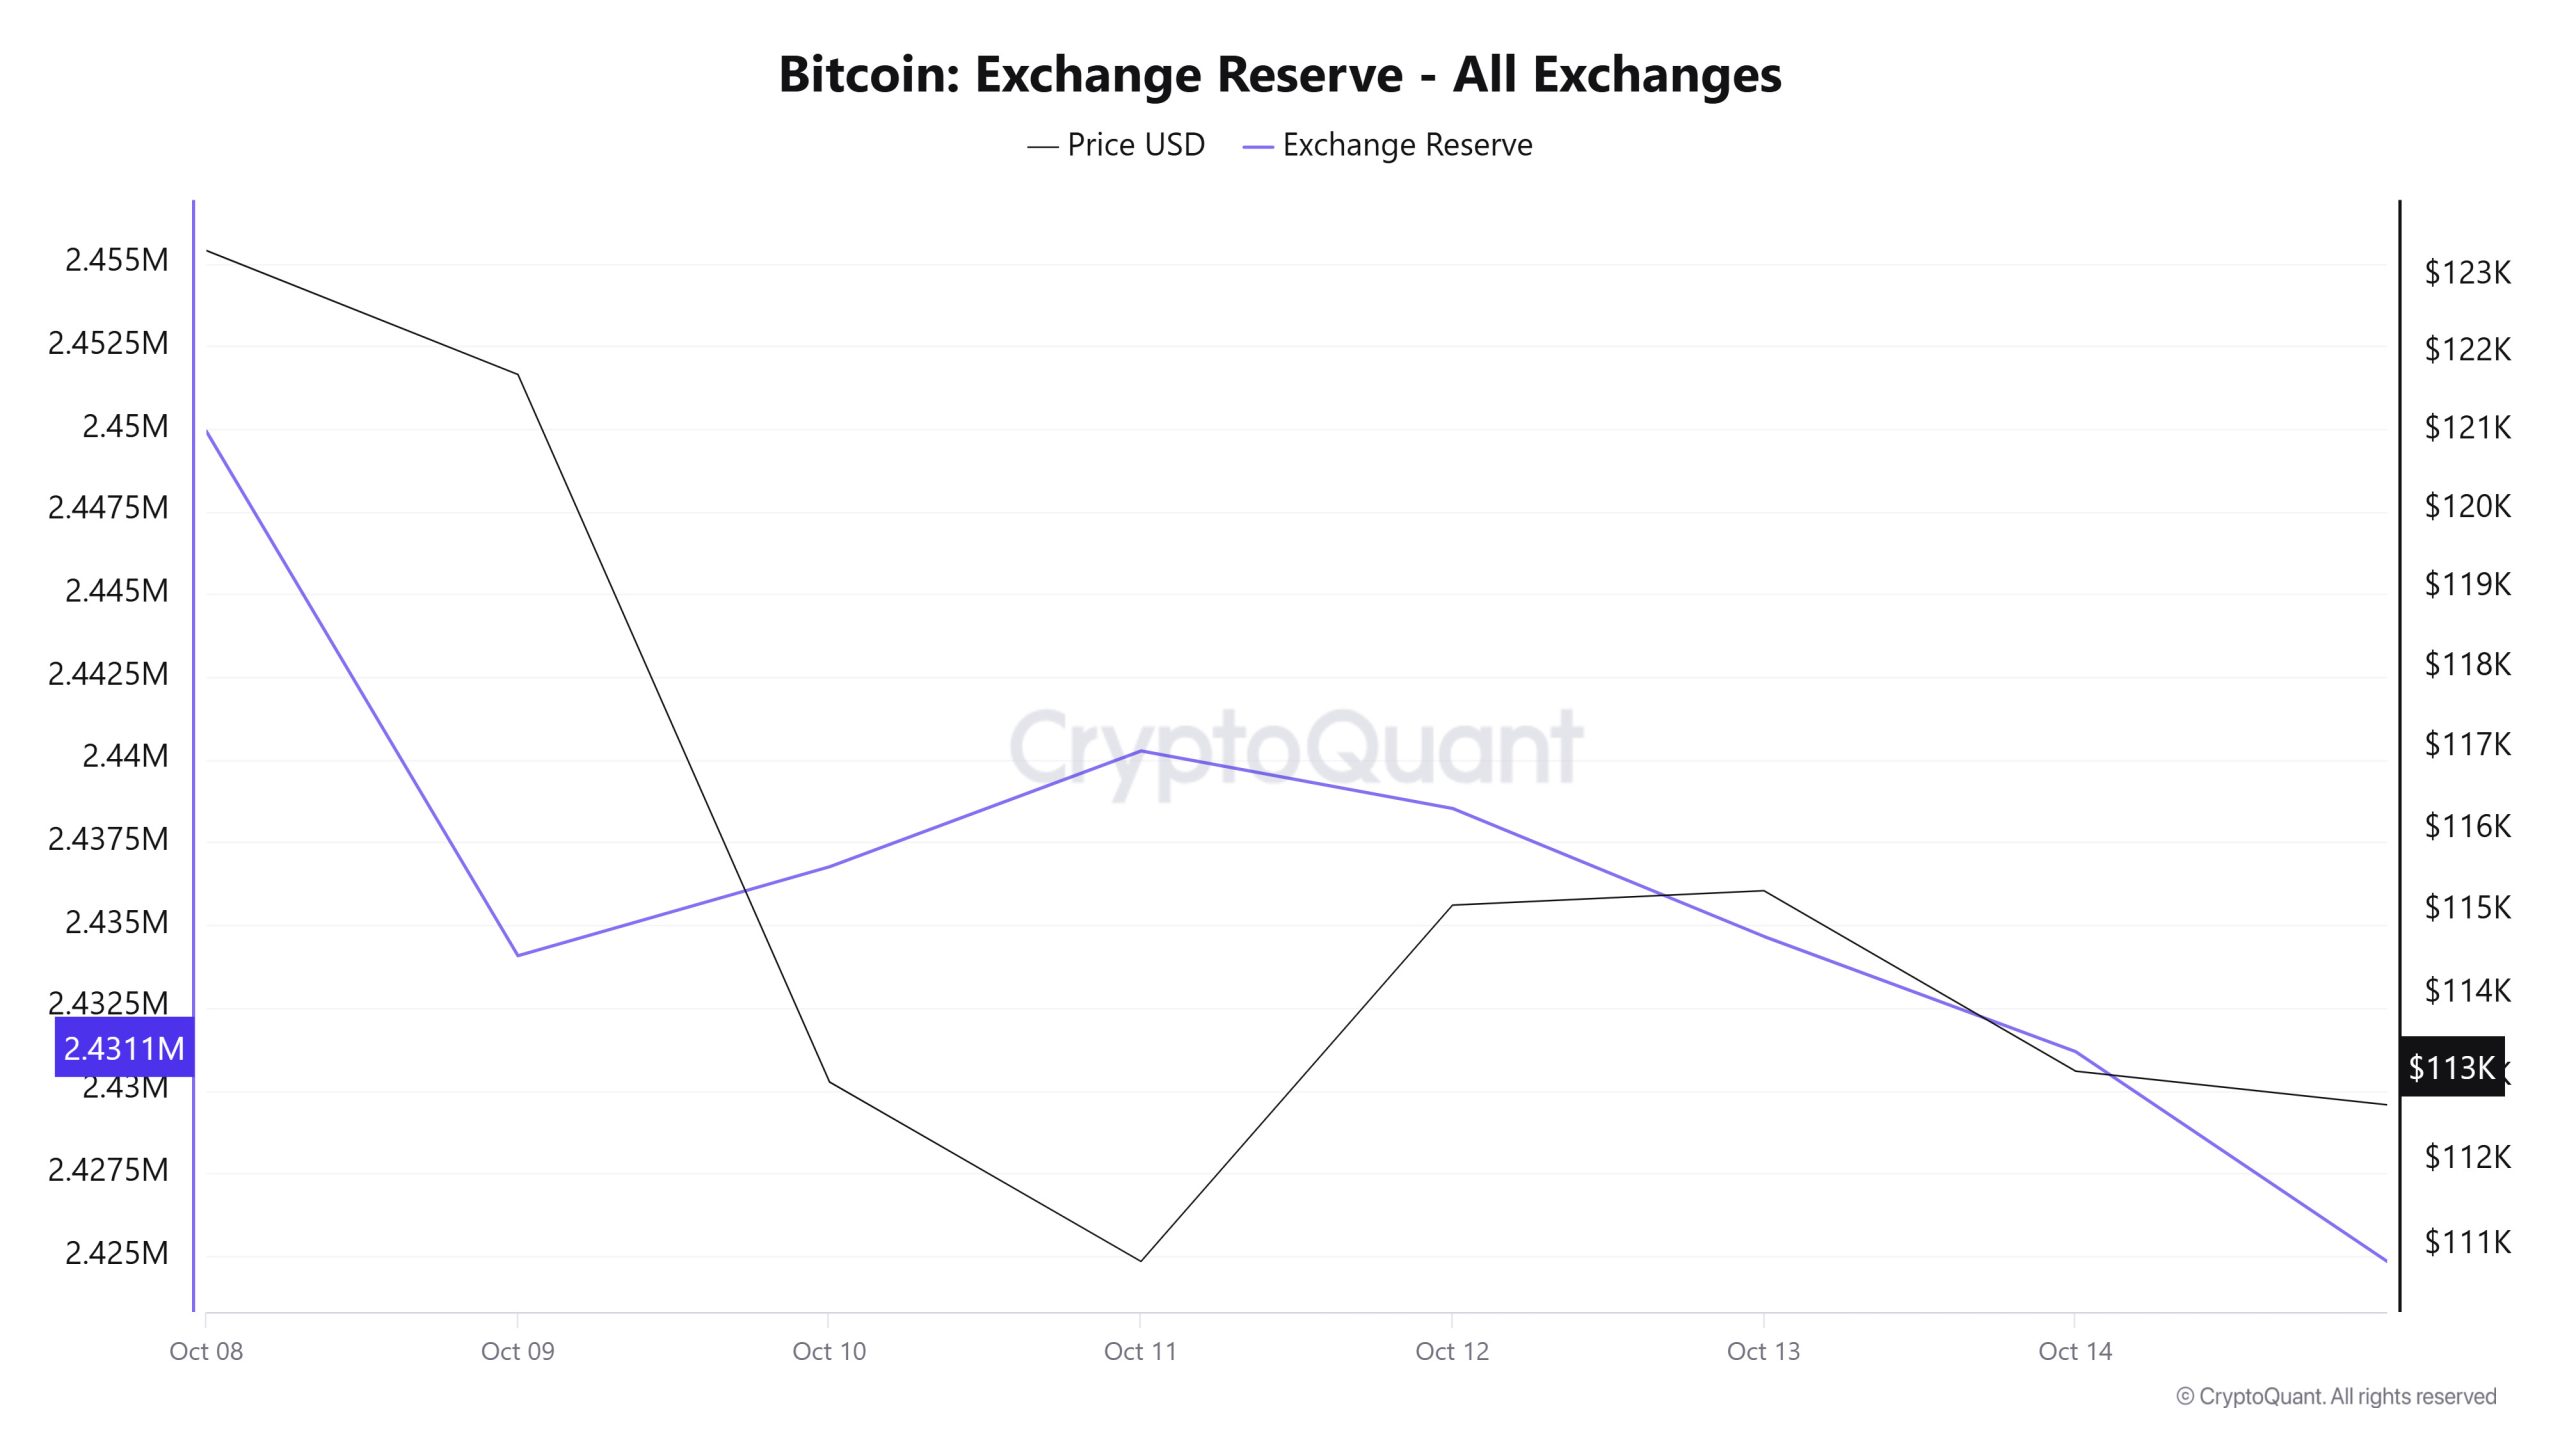
Between October 8-14, 2025, Bitcoin reserves on exchanges decreased from approximately 2,455,386 BTC to 2,431,172 BTC, for a total net outflow of 24,214 BTC. In this process, reserves decreased by about 0.99%. In the same period, the BTC price fell from $121,393 to $113,071, a loss of 6.86%. As the price declined, stock market reserves also decreased, indicating that investors are using this decline as an opportunity to accumulate rather than a selling opportunity. However, the selling pressure on the price is still effective and the price-supporting effect of the outflows has remained weak. In the short term, prices are likely to be pressured downwards as selling pressure continues to prevail. However, if the downtrend in reserves continues, this may create a new supply crunch in the medium and long term.
| Date | 08-Oct | 09-Oct | 10-Oct | 11-Oct | 12-Oct | 13-Oct | 14-Oct |
|---|---|---|---|---|---|---|---|
| Exchange Inflow | 39,696 | 32,872 | 41,974 | 46,129 | 21,068 | 25,413 | 48,009 |
| Exchange Outflow | 45,162 | 48,796 | 39,285 | 42,626 | 22,806 | 29,285 | 51,489 |
| Exchange Netflow | -5,466 | -15,924 | 2,689 | 3,503 | -1,738 | -3,872 | -3,480 |
| Exchange Reserve | 2,449,920 | 2,434,070 | 2,436,759 | 2,440,261 | 2,438,523 | 2,434,651 | 2,431,172 |
| BTC Price | 121,393 | 121,721 | 112,941 | 110,816 | 115,075 | 115,250 | 113,071 |
Fees and Revenues
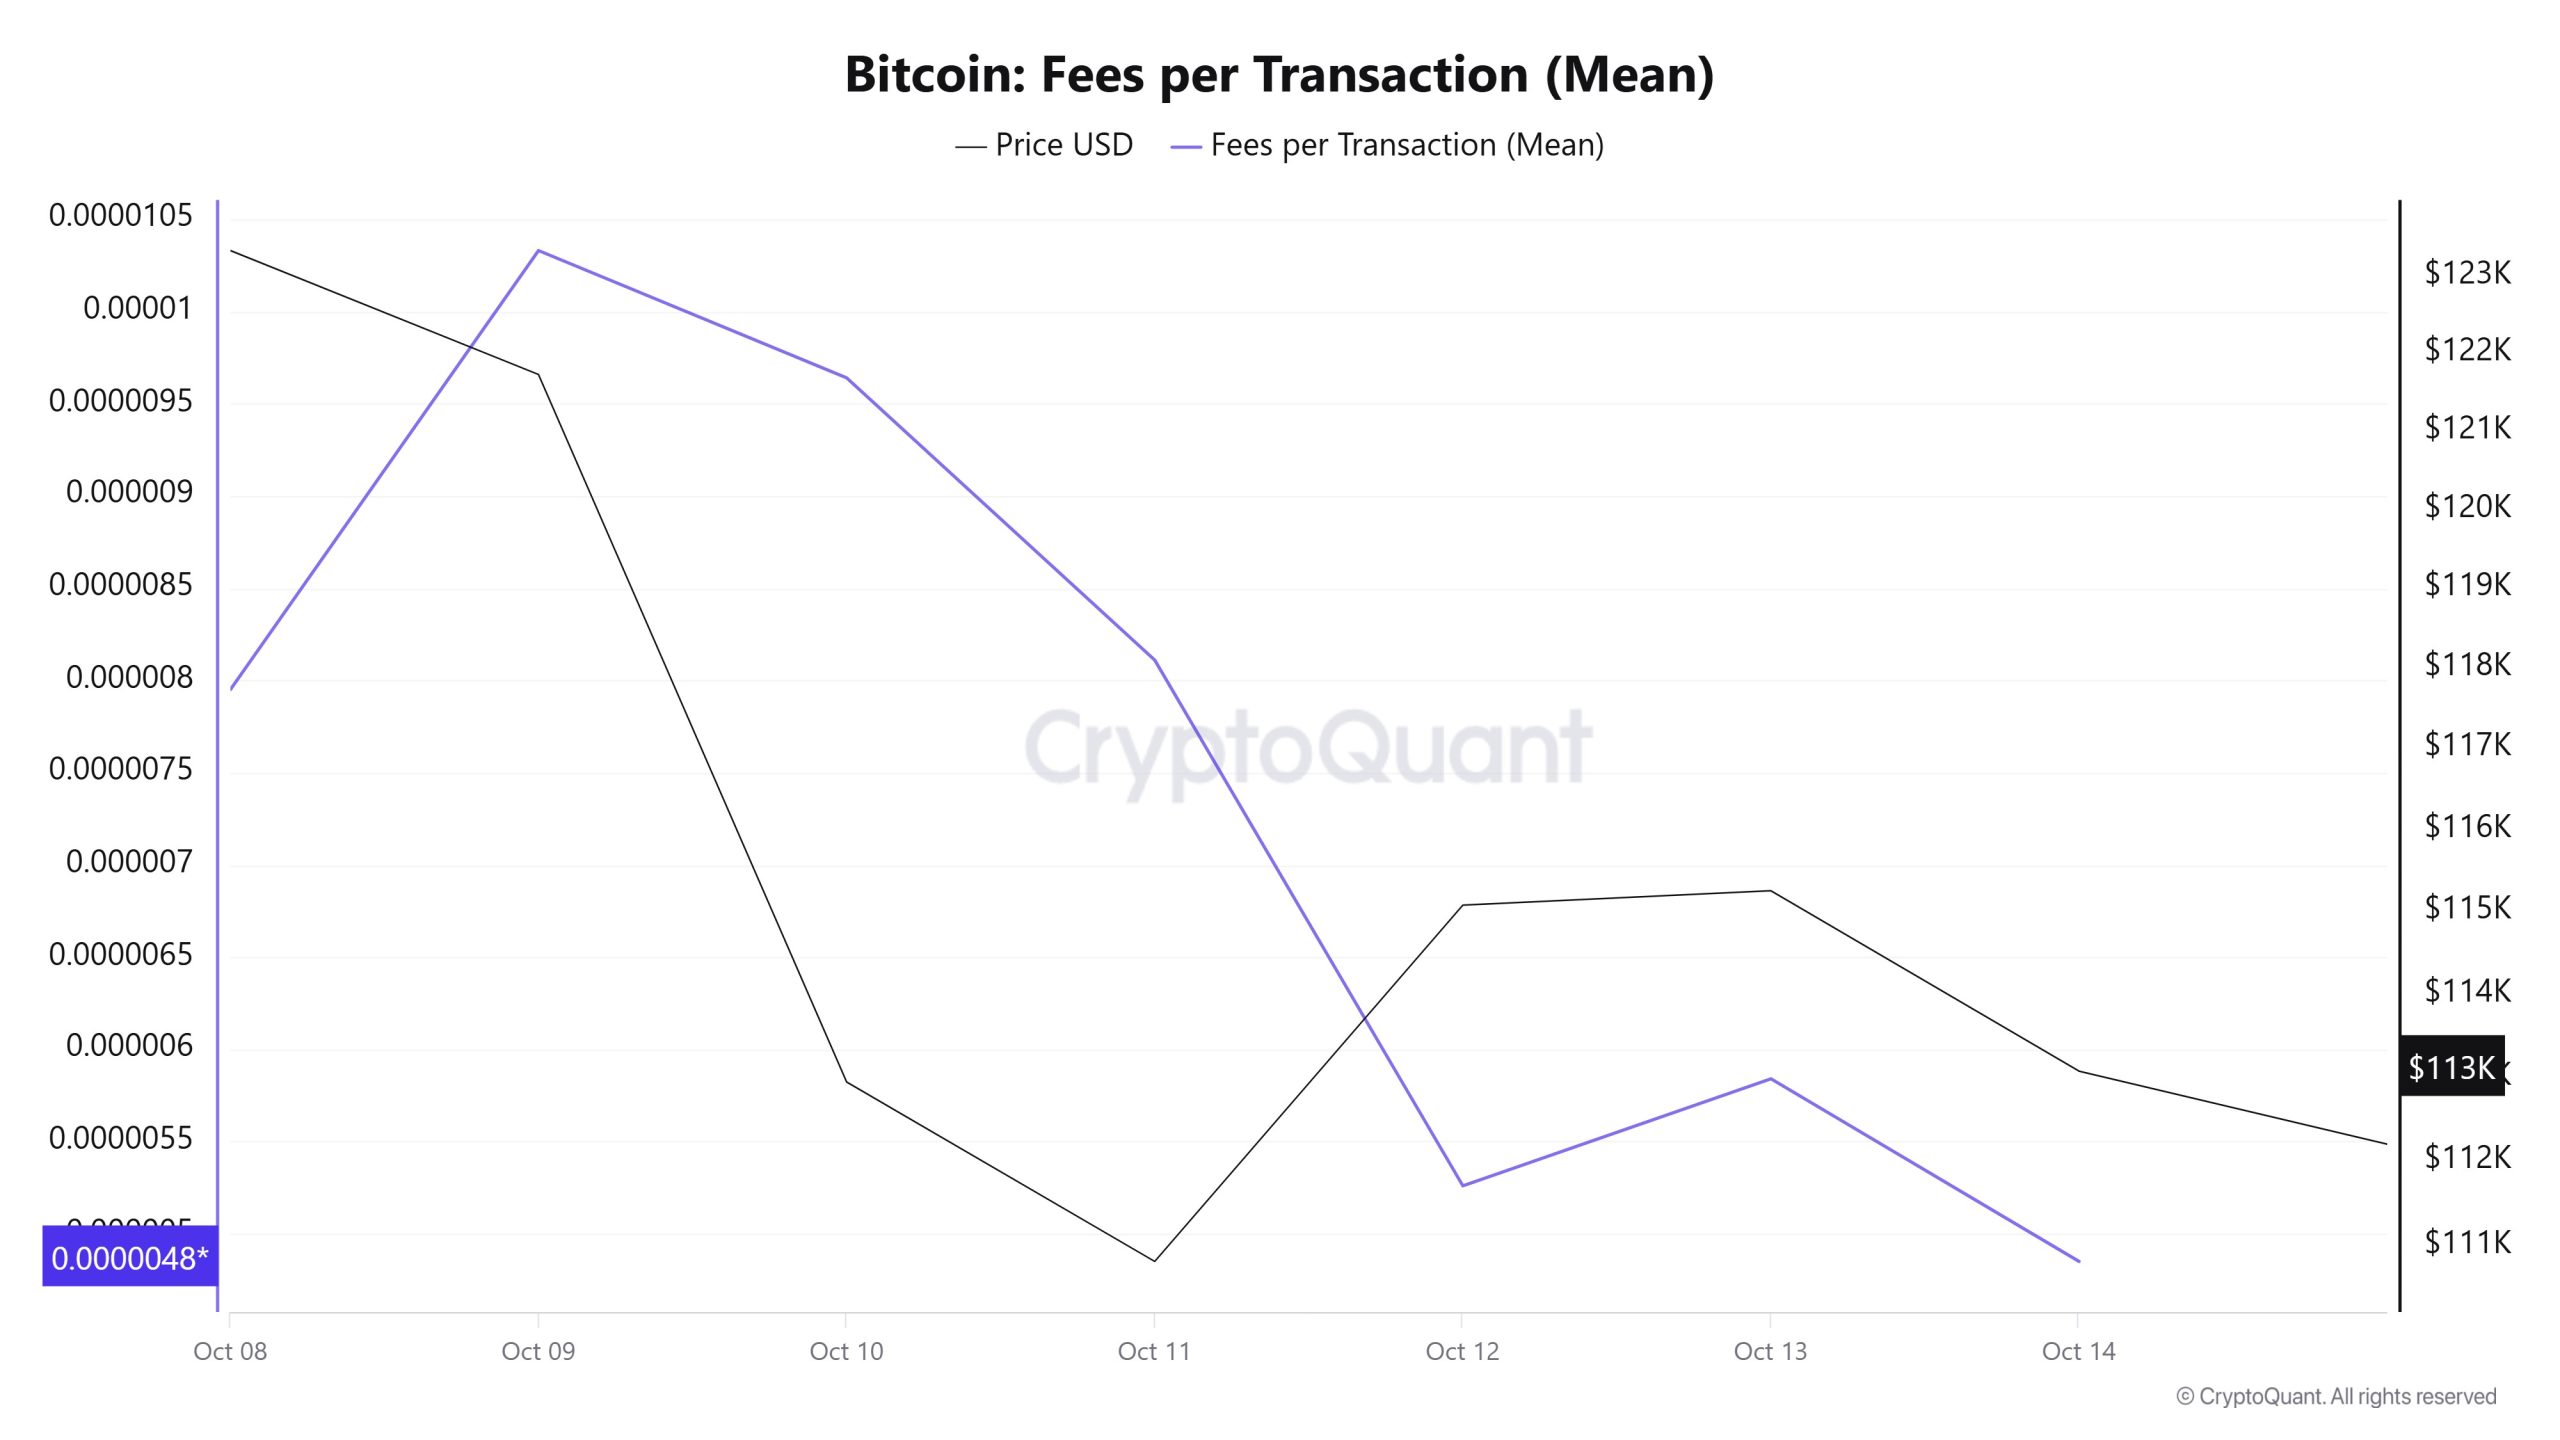
Analyzing the Bitcoin Fees per Transaction (Mean) data between October 8-14, it is seen that the indicator was realized at 0.00000795 on October 8, the first day of the week.
After peaking on October 9, the value followed a fluctuating course due to the volatility in Bitcoin price and fell to 0.00000526 on October 12.
Although the Bitcoin Fees per Transaction (Mean) indicator resumed an upward trend in the following days, it fell to 0.00000485 on October 14, the last day of the week, and closed the week at its lowest value.
Bitcoin: Fees (Total)
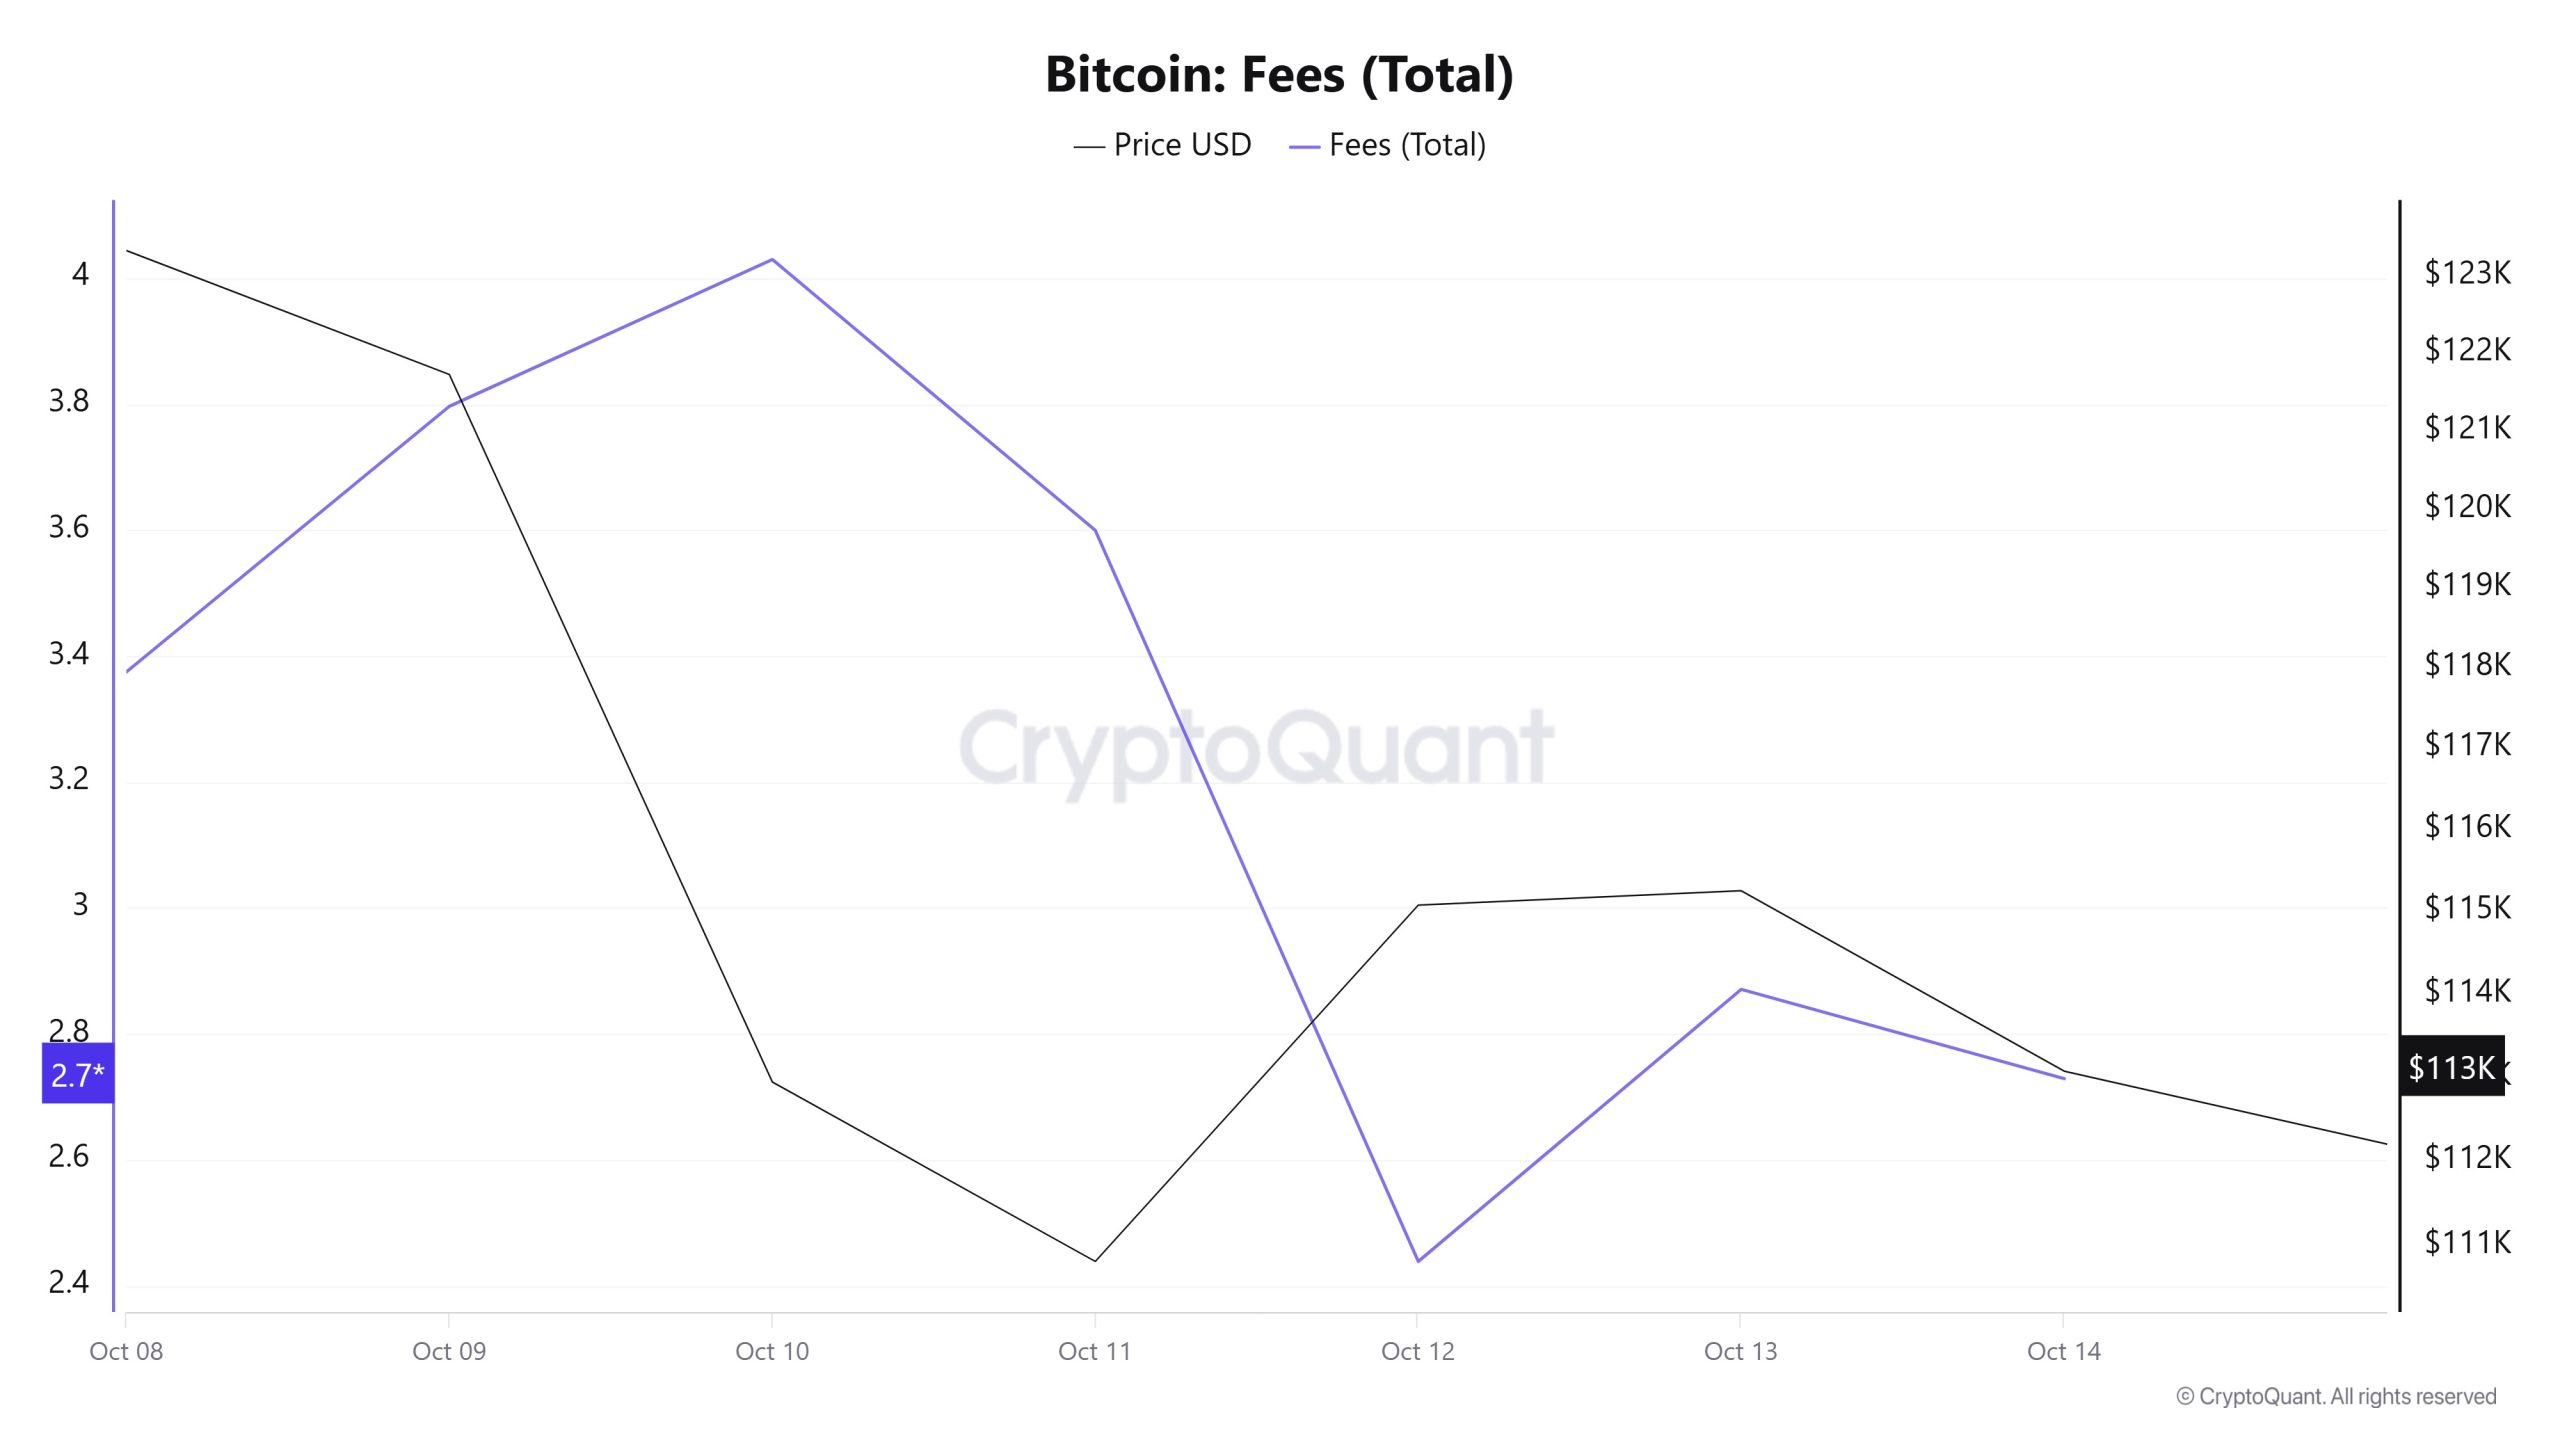
Similarly, when Bitcoin Fees (Total) data for October 8-14 are analyzed, it is seen that the indicator was realized at 3.37475238 on October 8, the first day of the week.
Peaking on October 10, the value fluctuated after this date due to the volatility in the Bitcoin price and fell to 2.43852623 on October 12.
Although the Bitcoin Fees (Total) indicator resumed an upward trend in the following days, it fell to 2.72882829 on October 14, the last day of the week, closing the week at its lowest value.
Miner Flows
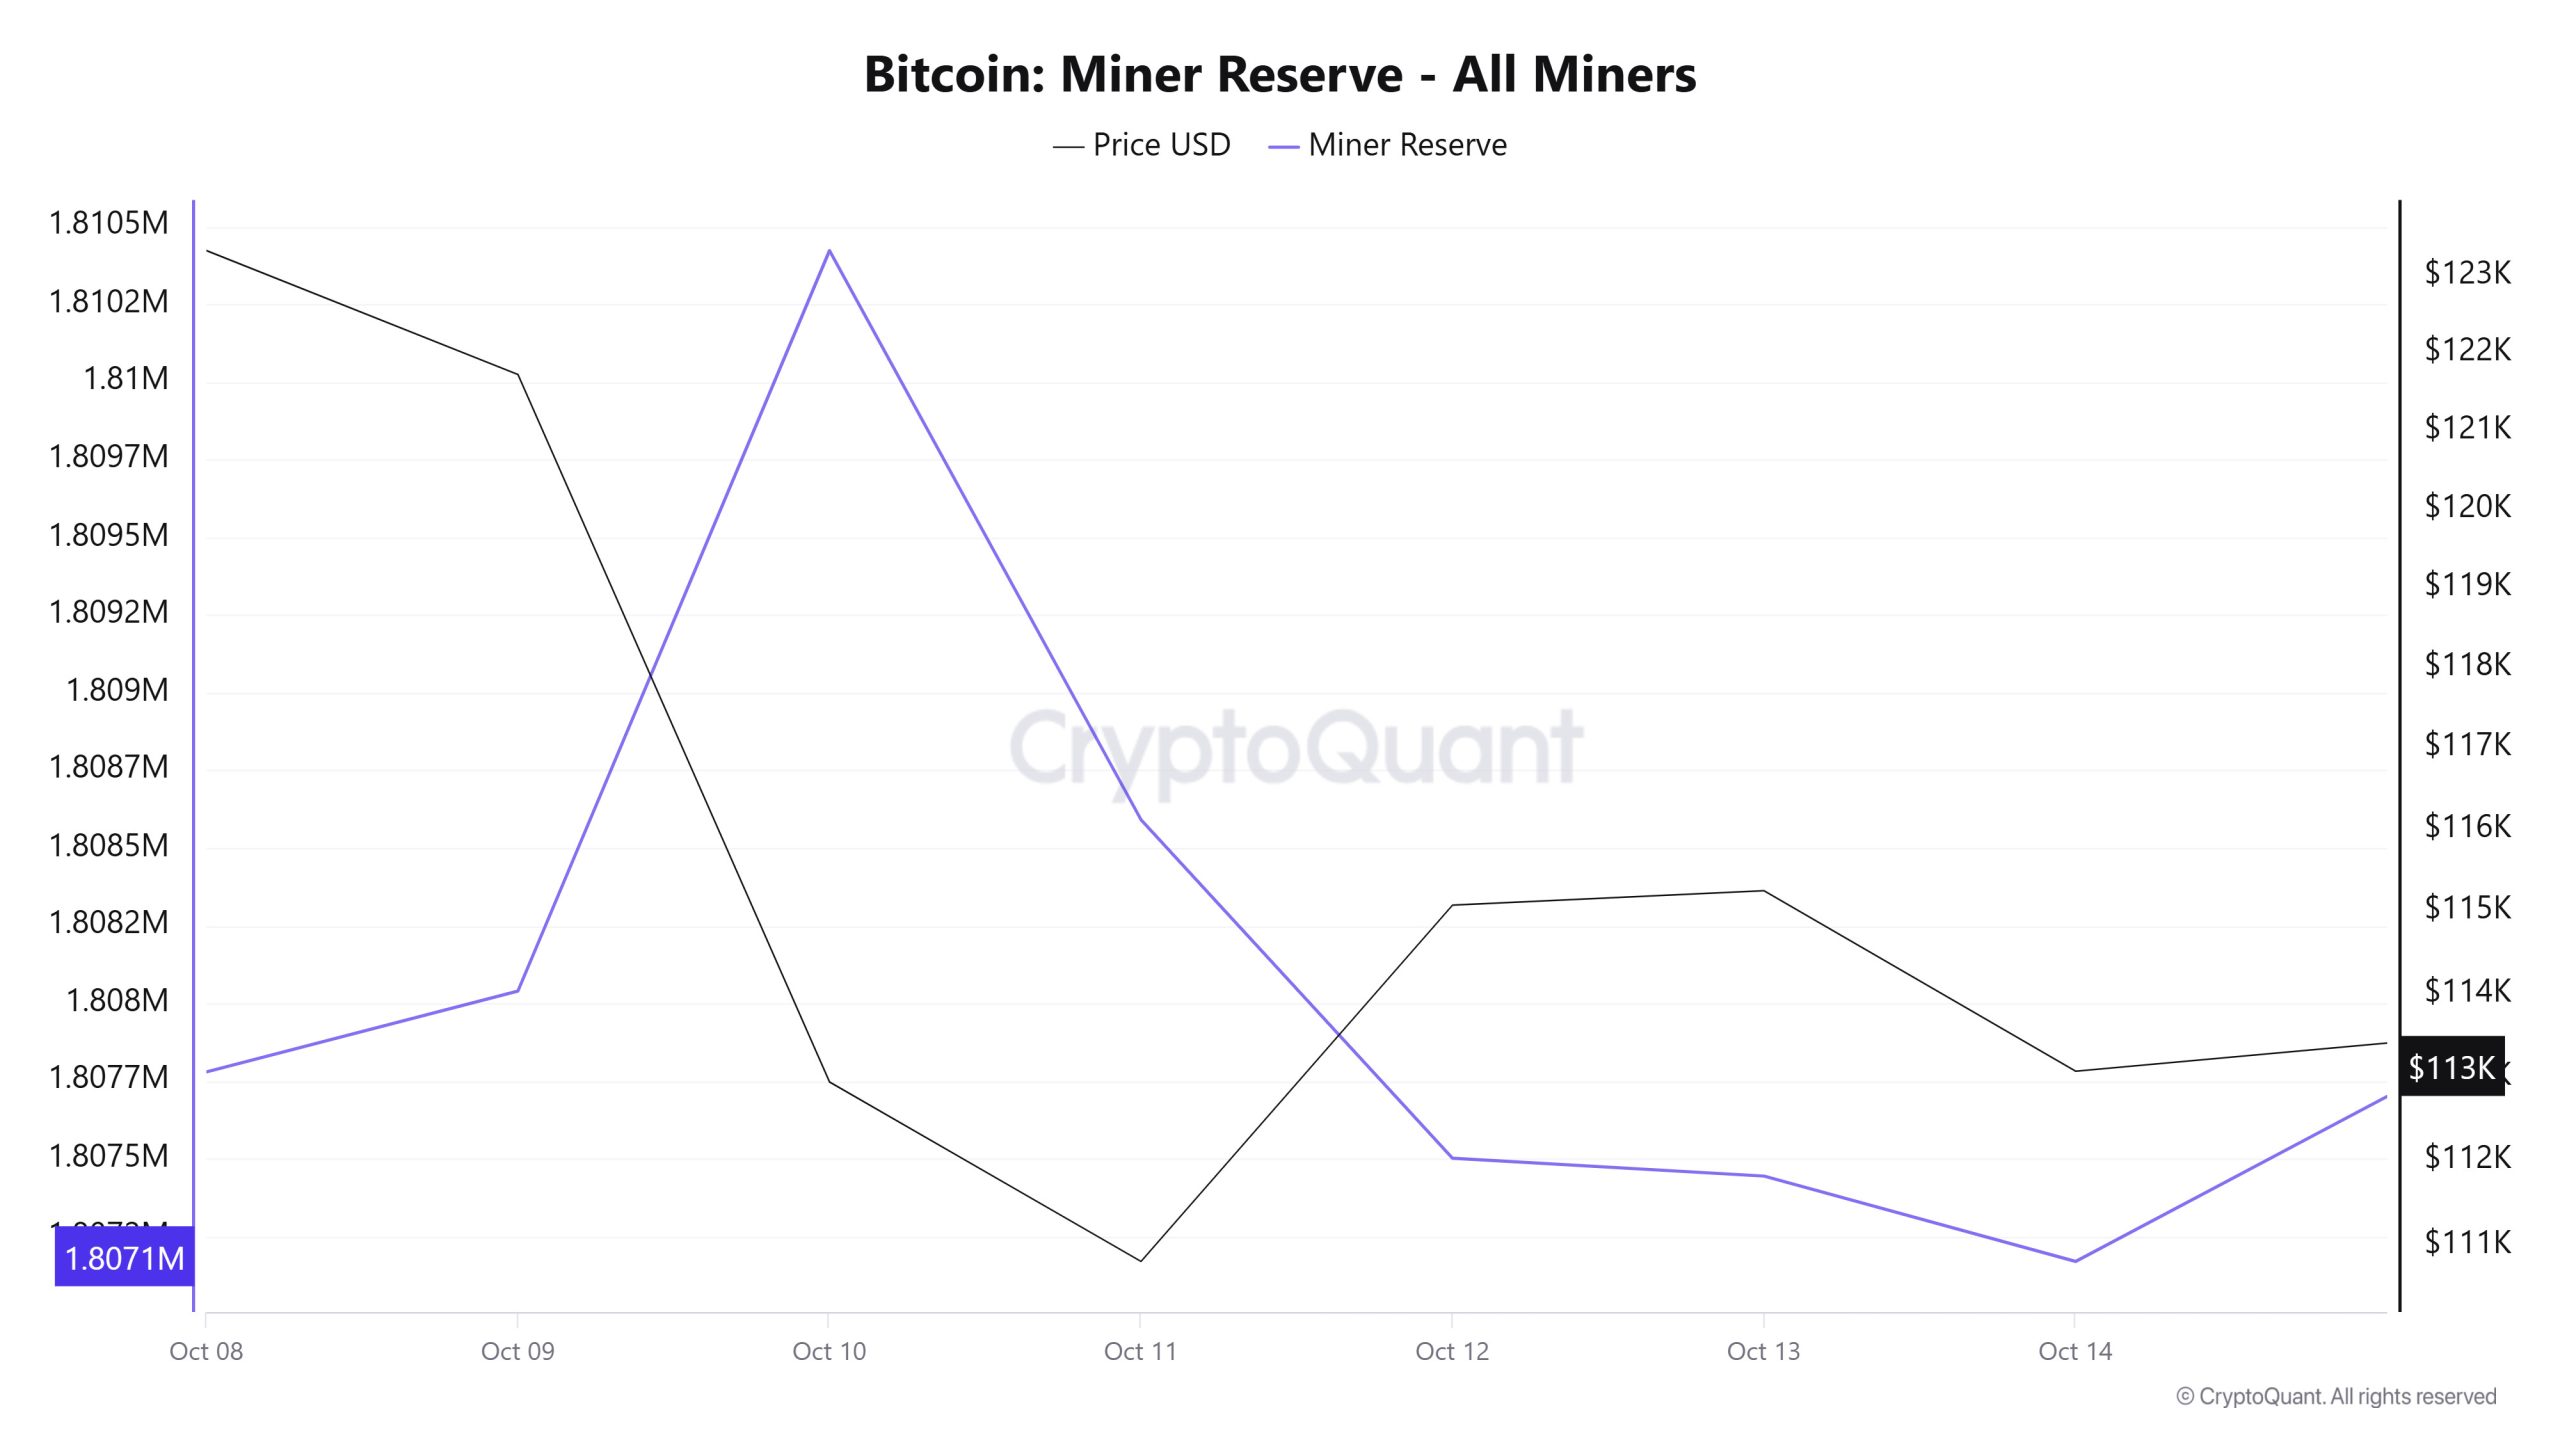
According to the data obtained from the Miner Reserve table, there has been a slight decrease in Bitcoin reserves held in miners’ wallets this week. A time-varying correlation structure was observed between Bitcoin price and miner reserve over the time period analyzed. However, the general trend suggests that a negative correlation predominates between these two variables.
Miner Inflow, Outflow and Netflow
Between October 08 – 14, 59,289 Bitcoins were outflowed from miners’ wallets and 58,570 Bitcoins were inflowed into miners’ wallets between the same dates. The Miner Netflow for this week was -719 Bitcoin. Meanwhile, the Bitcoin price was $123,328 on October 08 and $113,070 on October 14.
For the week, the net flow (Miner Netflow) was negative as Bitcoin inflow into miner wallets (Miner Inflow) was less than Bitcoin outflow from miner wallets (Miner Outflow).
| Oct. 08 | Oct. 09 | Oct. 10 | Oct. 11 | Oct. 12 | Oct. 13 | Oct. 14 | |
|---|---|---|---|---|---|---|---|
| Miner Inflow | 7,794.69 | 5,499.41 | 10,616.78 | 14,296.71 | 5,584.77 | 5,961.77 | 8,816.41 |
| Miner Outflow | 7,903.93 | 5,239.25 | 8,234.09 | 16,128.28 | 6,674.13 | 6,018.98 | 9,091.13 |
| Miner Netflow | -109.24 | 260.16 | 2,382.69 | -1,831.57 | -1,089.37 | -57.21 | -274.72 |
Transaction
![]()
Last week, there were 3,051,412 transactions on the Bitcoin network, while this week the number of transactions increased by 3.94% to 3,171,664. The week’s highest transaction volume was 562,622 on October 14, while the lowest was 367,662 on October 9. The period between October 9 and 14 continued with steady transaction increases. The increase in the number of transactions compared to the previous period and the fact that the number of transactions continues to rise at the weekend creates an interesting situation that has been seen for 2 weeks in a row. When the relationship between transaction count and price is analyzed, it is seen that the number of positive and negative correlations are balanced throughout the week.
Tokens Transferred
While a total of 5,528,990 BTC was transferred last week, this week the transfer amount increased by 6.92% to 5,911,874 BTC. The highest daily transfer volume of the week was 1,186,086 BTC on October 14, while the lowest transfer volume was 694,158 BTC on October 12. The correlation between the amount of tokens transferred and the price followed a negative weight and fluctuating course throughout the period. Onchain activity reached its highest level on a daily basis since the end of February 2025, with rapidly rising transfer increases, especially between October 12-14.
Considering the 3.94% increase in the number of transactions and 6.92% increase in the amount of tokens transferred, it is possible to say that users with high volume transactions increased their activity during this period. In addition, the increase in general network activity in all directions and the fact that it has been a very volatile week can be interpreted as the onchain activity after the decline is generally aimed at reducing risk or profit realization.
Whale Activities
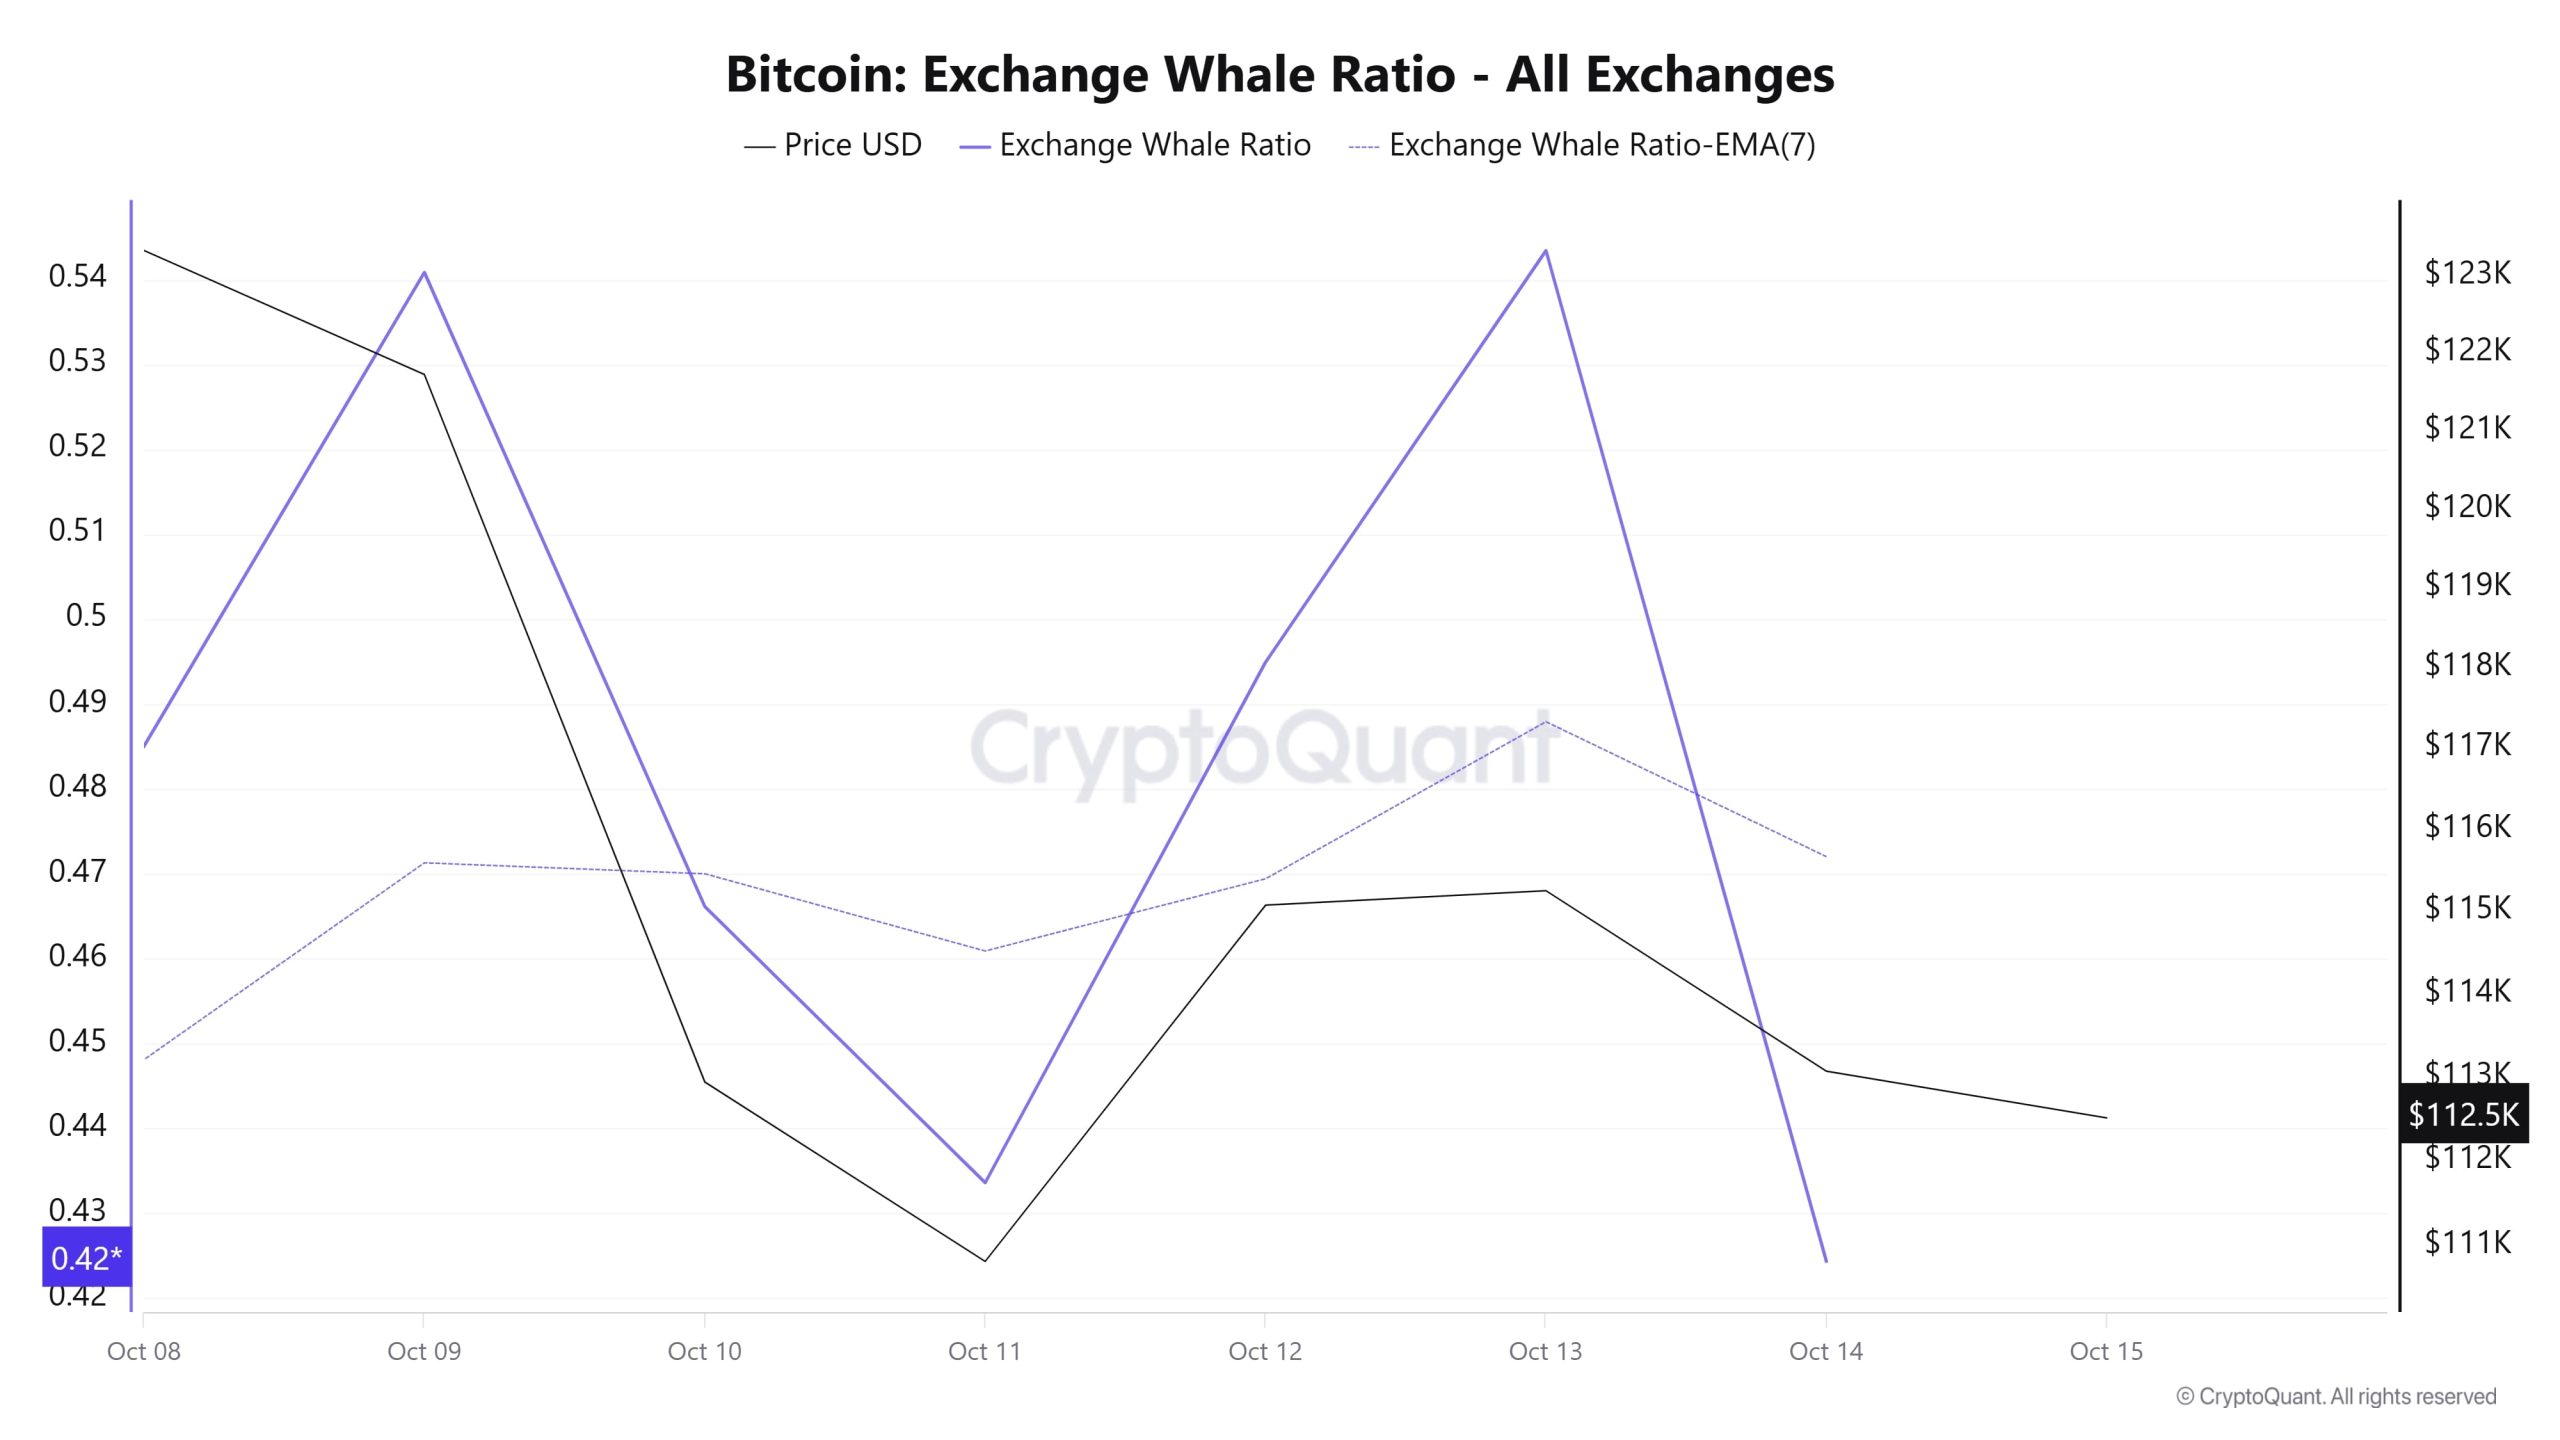
Whales Data:
According to the data in the cryptocurrency market in the last 7 days, whale activity on the central exchange moved in a narrow band from the beginning to the end of the process. When we look at the Exchange Whale Ratio metric, the rate of whales using central exchanges was 0.484 on October 8, the first day of the 7-day process. On October 13, it reached 0.543, forming the peak of the process. When this ratio is above the 0.35 – 0.45 band, it usually means that whales use central exchanges frequently. The metric, currently at 0.424, remains in a narrow band and is also the bottom of the process. BTC is currently priced at $112,500, although it has fallen to $102,000 after a big drop from $124,000 in this process. At the same time, it is seen that 5,911,788 BTC moved in total BTC transfer, up 7% compared to last week. On-chain data shows that the addresses of whales holding BTC between $10,000 and $100,000 continue to decline. With market-wide uncertainty and high liquidations, the downtrend does not seem to be over yet. Market signals continue to provide early warnings of potential selling pressure as some whales appear ready to take their profits. This could signal possible selling pressure or a price decline in the coming period. As a result, Bitcoin’s current on-chain dynamics have signaled that the market is subject to selling pressure. This selling pressure coincided with Bitcoin’s decline from $124,000 to as low as $102,000, adding to the pessimism.
BTC Onchain Overall
| Metric | Positive 📈 | Negative 📉 | Neutral ➖ |
|---|---|---|---|
| Active Addresses | ✓ | ||
| Breakdowns | ✓ | ||
| Derivatives | ✓ | ||
| Supply Distribution | ✓ | ||
| Exchange Supply Ratio | ✓ | ||
| Exchange Reserve | ✓ | ||
| Fees and Revenues | ✓ | ||
| Miner Flows | ✓ | ||
| Transaction | ✓ | ||
| Whale Activities | ✓ |
*The metrics and guidance in the table do not, in and of themselves, describe or imply an expectation of future price changes for any asset. The prices of digital assets may vary depending on many different variables. The onchain analysis and related guidance are intended to assist investors in their decision-making process, and making financial investments based solely on the results of this analysis may result in harmful transactions. Even if all metrics produce a positive, negative or neutral result at the same time, the expected results may not be seen according to market conditions. Investors reviewing the report would be well advised to heed these caveats.
Legal Notice
The investment information, comments and recommendations contained in this document do not constitute investment advisory services. Investment advisory services are provided by authorized institutions on a personal basis, taking into account the risk and return preferences of individuals. The comments and recommendations contained in this document are of a general type. These recommendations may not be suitable for your financial situation and risk and return preferences. Therefore, making an investment decision based solely on the information contained in this document may not result in results that are in line with your expectations.
NOTE: All data used in Bitcoin onchain analysis is based on Cryptoqaunt.

