Active Adresses
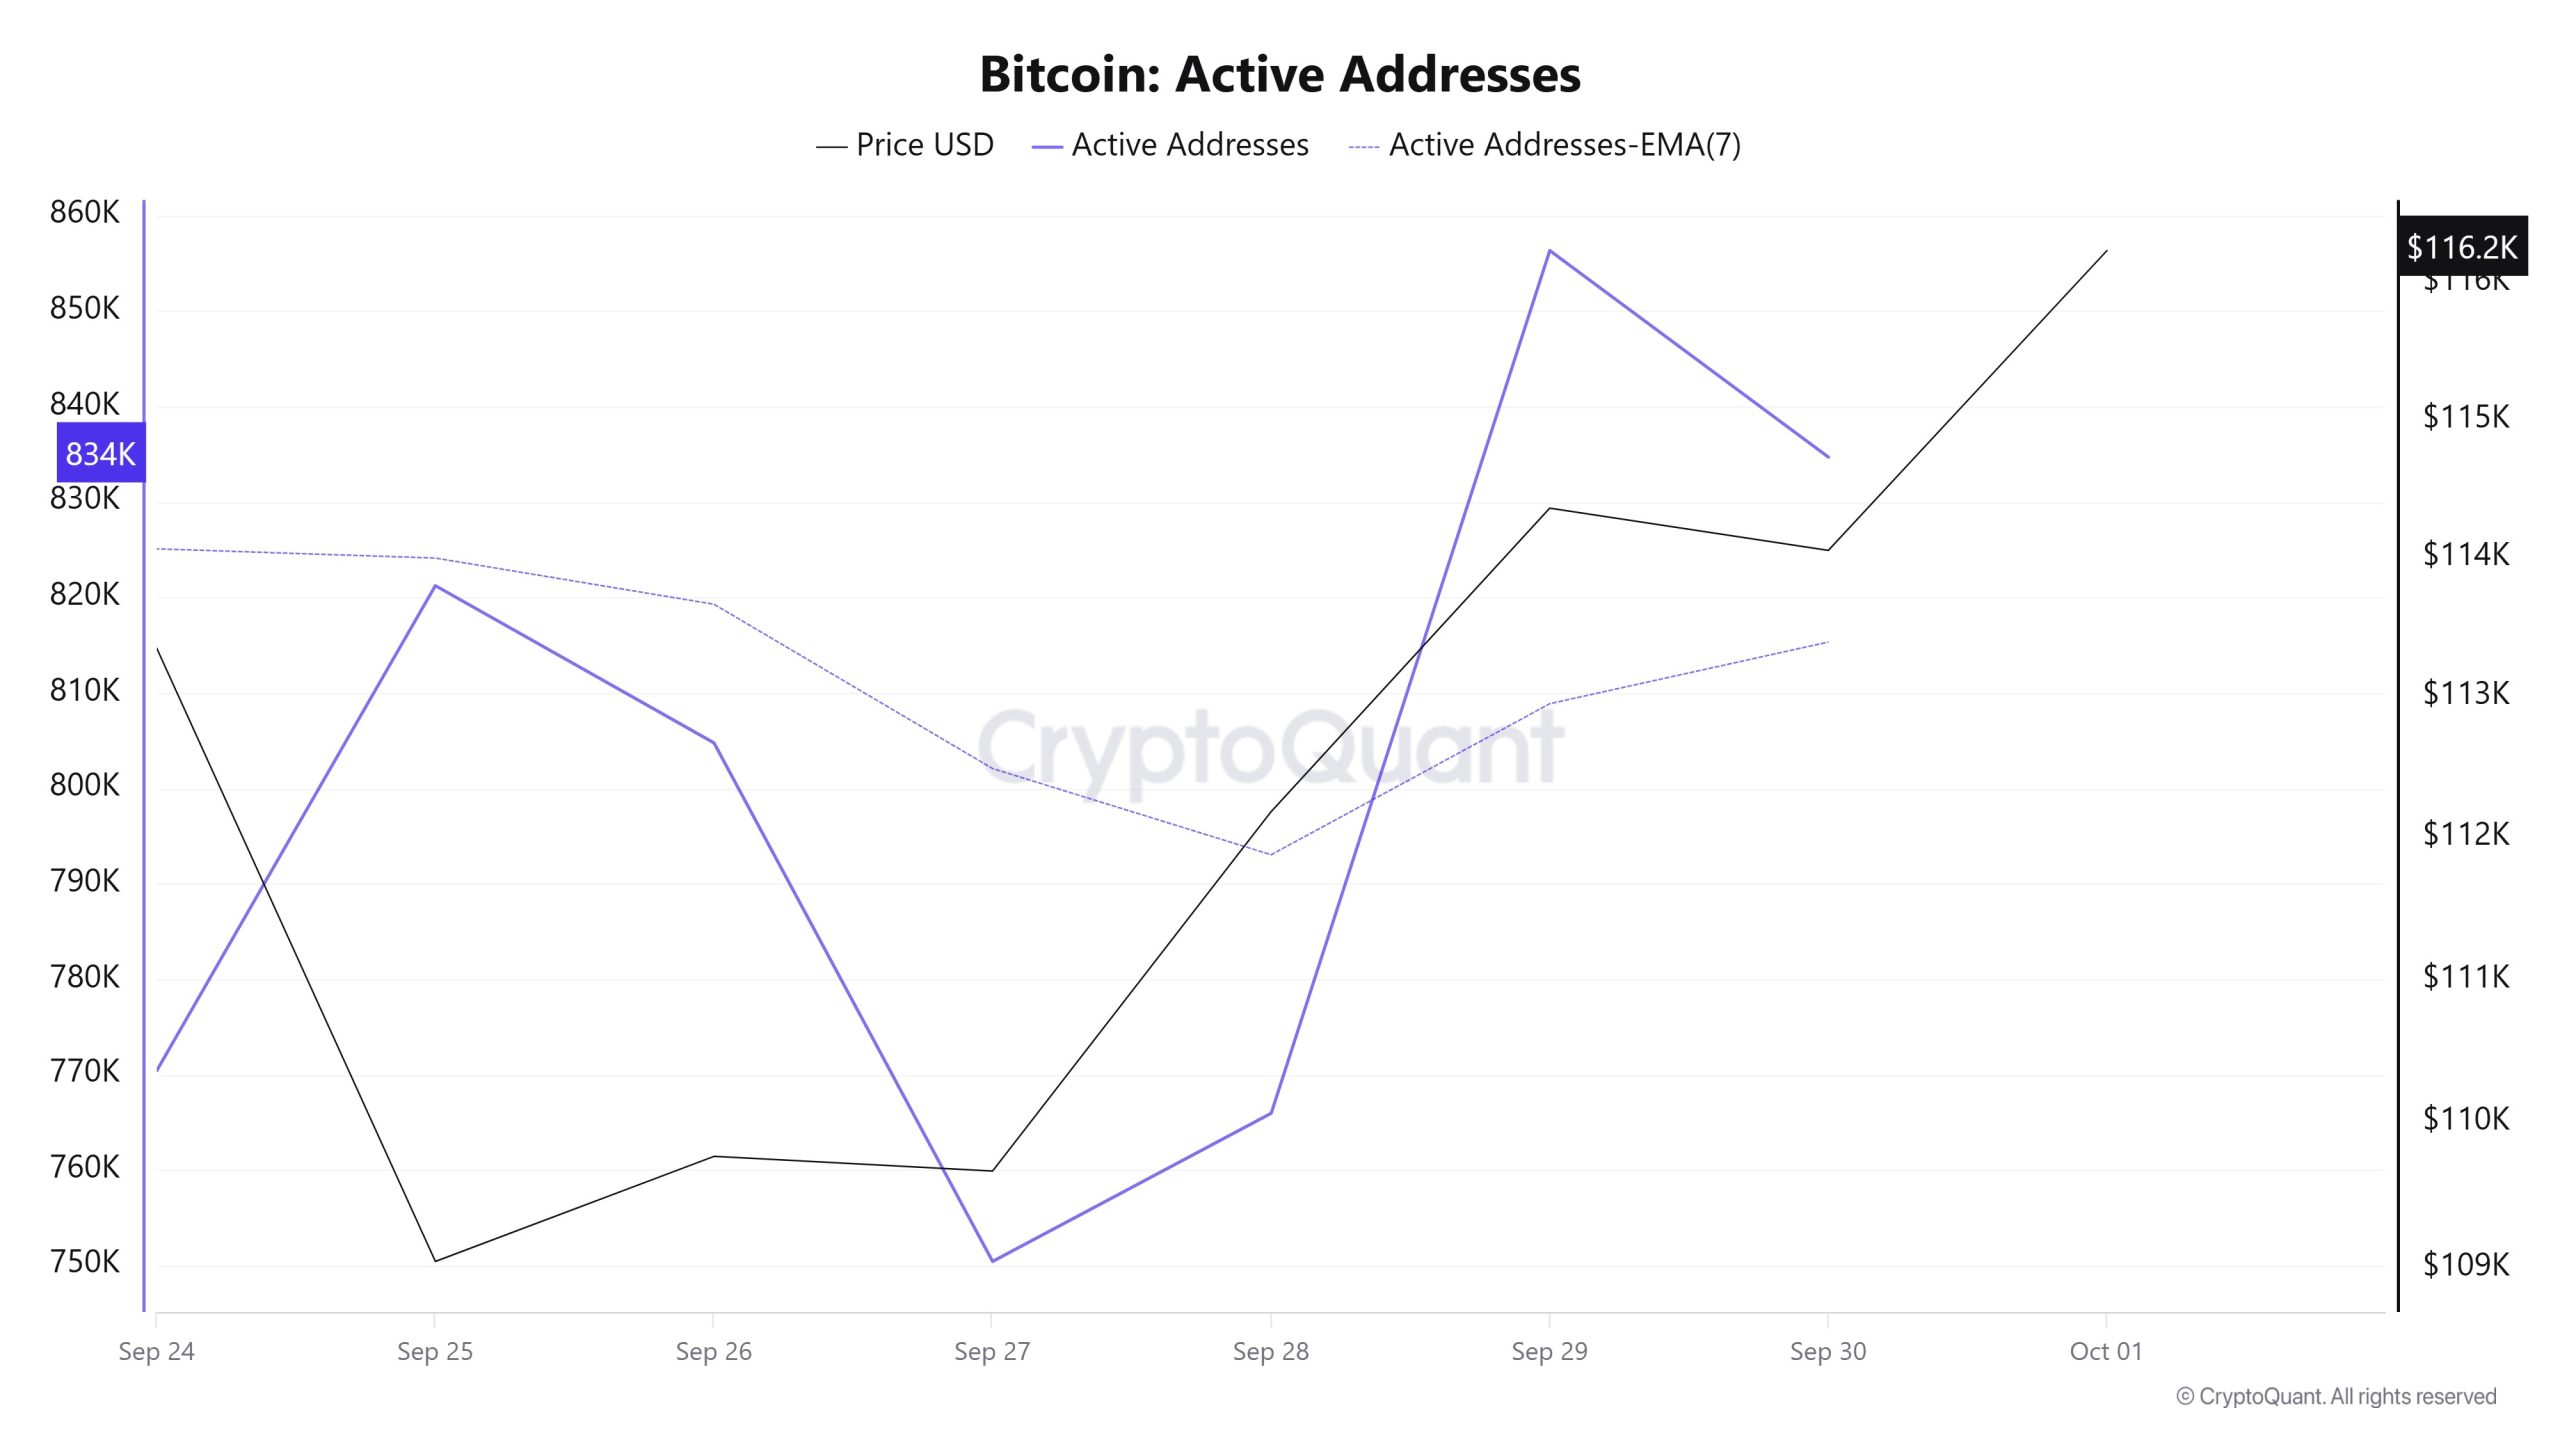
Between September 24 and October 1, 856,326 active addresses entered the Bitcoin network. During this period, the Bitcoin price rose as high as $116,000. The decline in the number of active addresses, especially on September 27, moved the price towards $114,000. From a technical perspective, it is noteworthy that the 7-day simple moving average (SMA) is moving upwards. This technical signal indicates buying on the market.
Active Sending Addresses
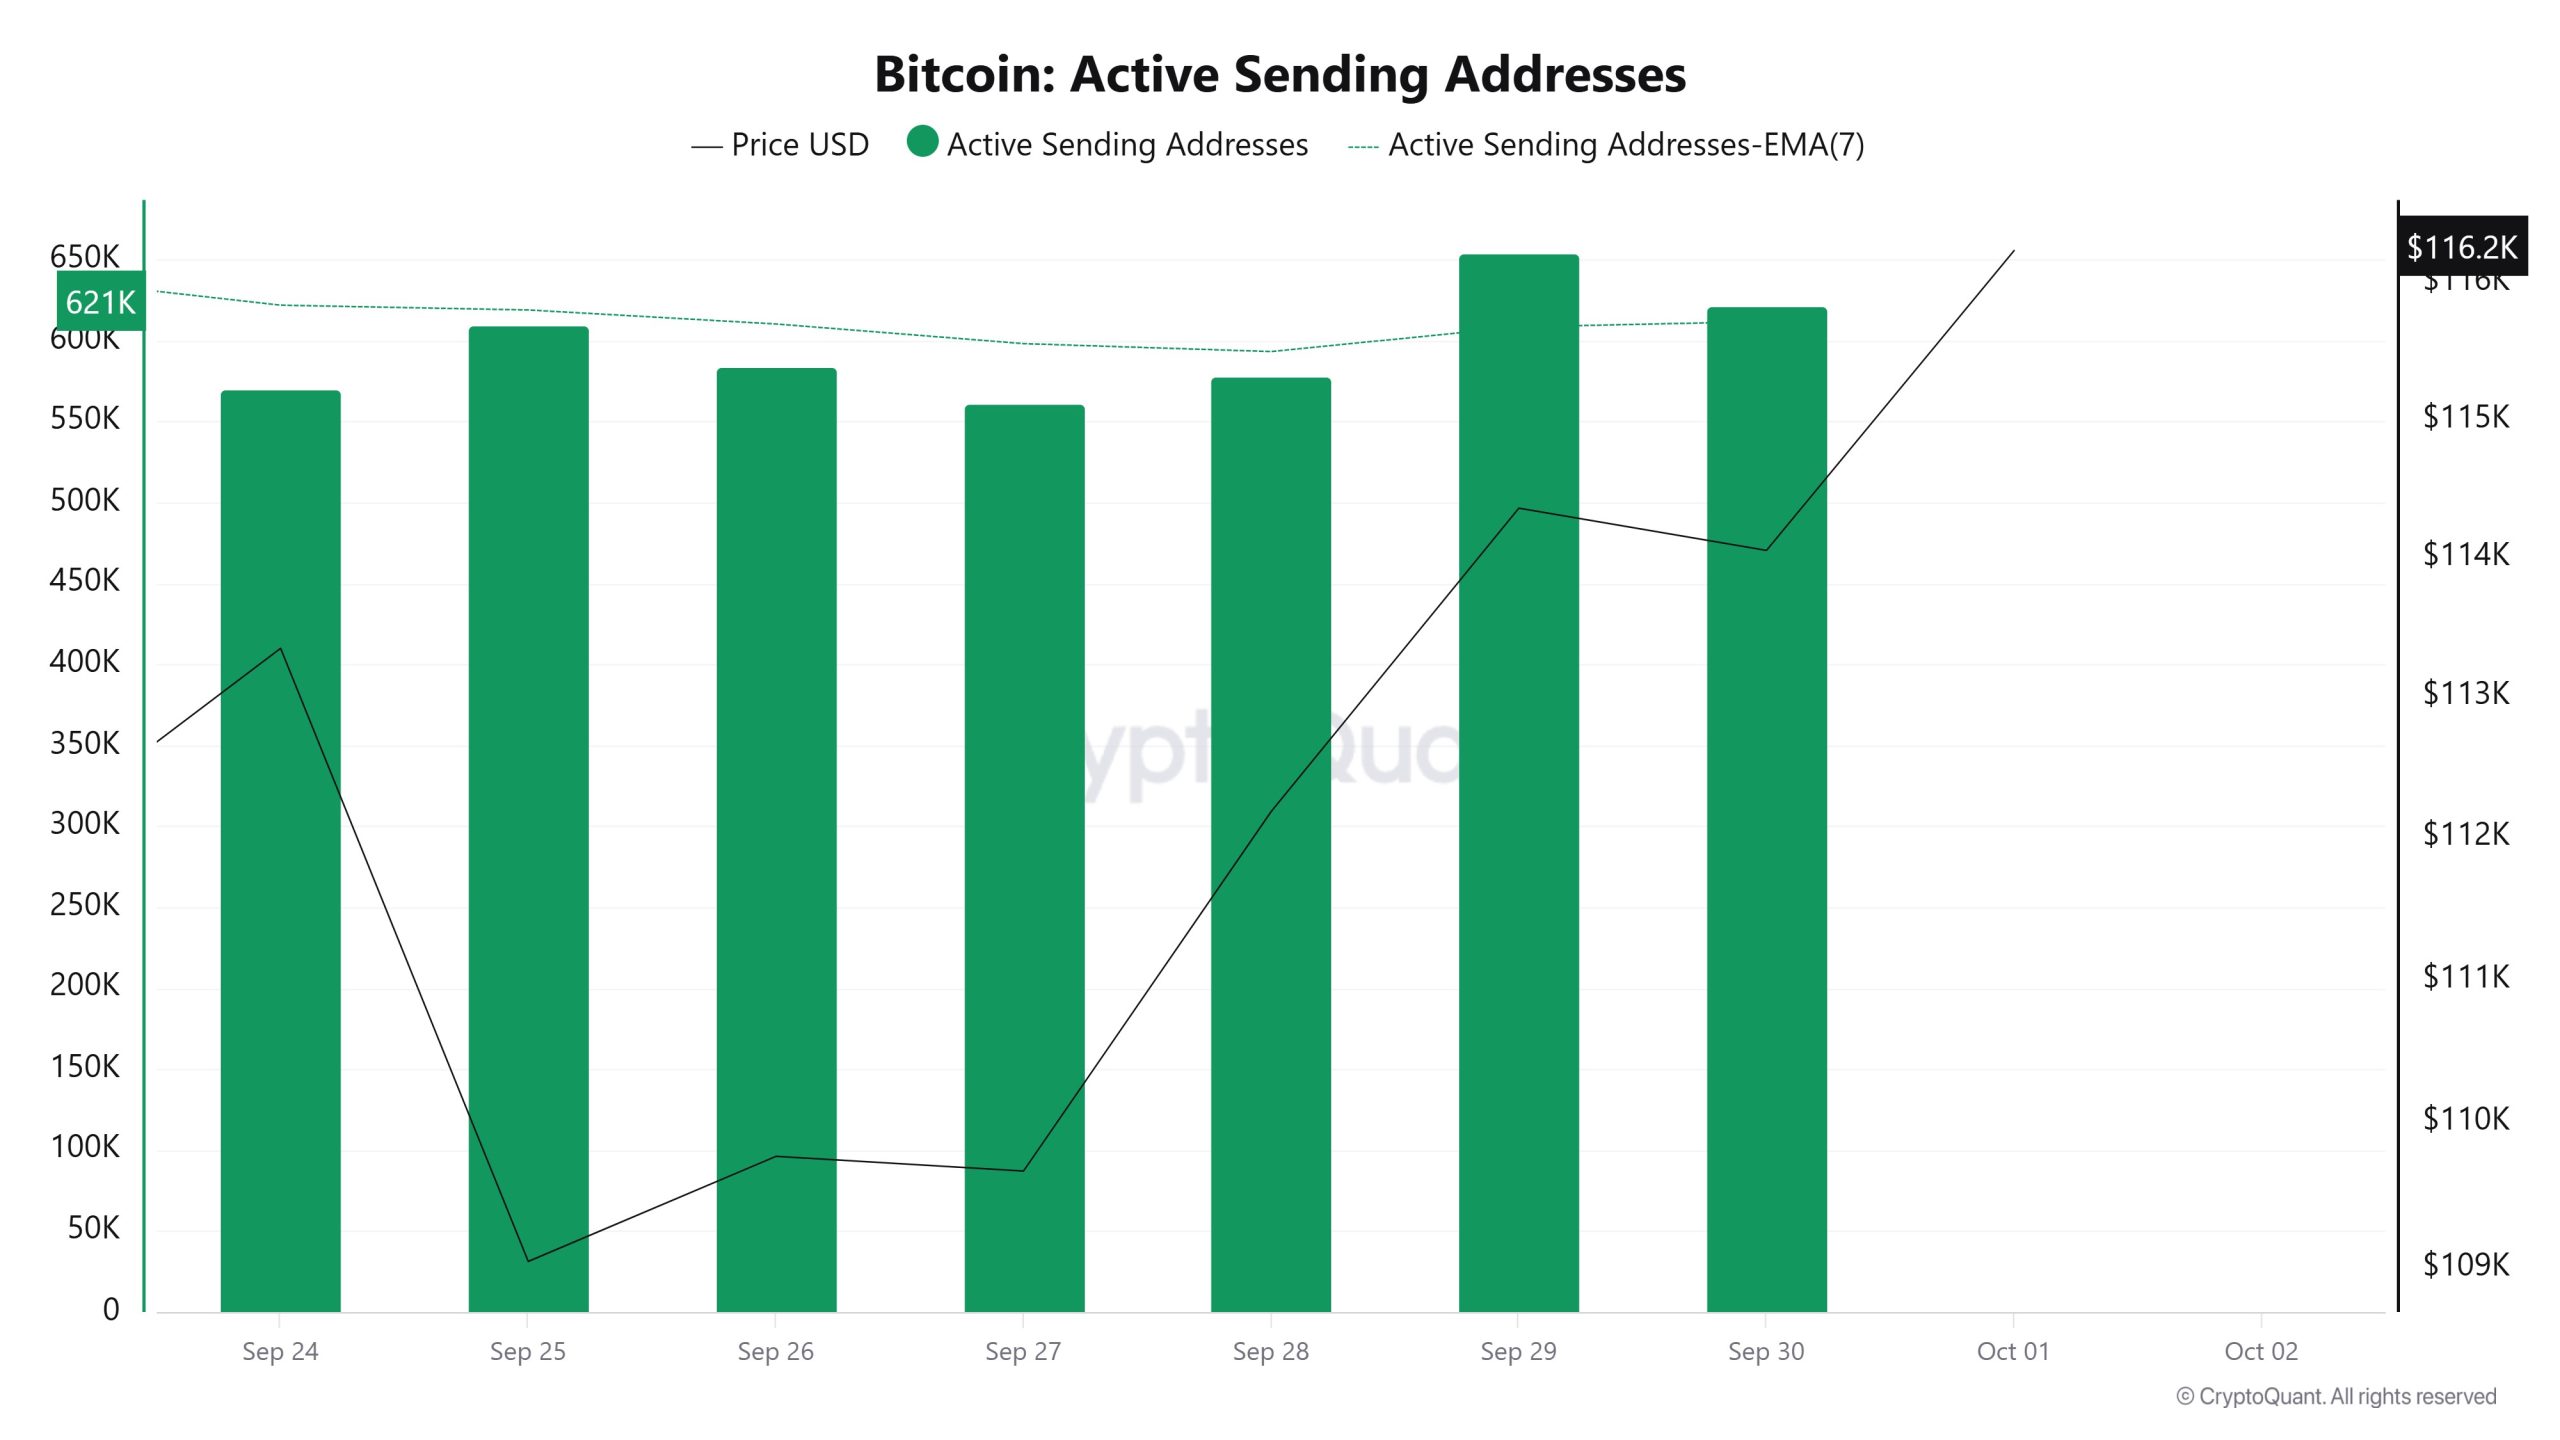 Between September 24 and October 1, there was an upward trend in the “Active Sending Addresses” metric. On the day of the price high, this metric stood at 654,152, indicating that user activity on the Bitcoin network has moved in tandem with the price. This data shows that the $114,000 level is supported not only by price, but also by buying in terms of on-chain address activity. Overall, the Active Sending Addresses metric trended upwards during this period.
Active Receiving Addresses
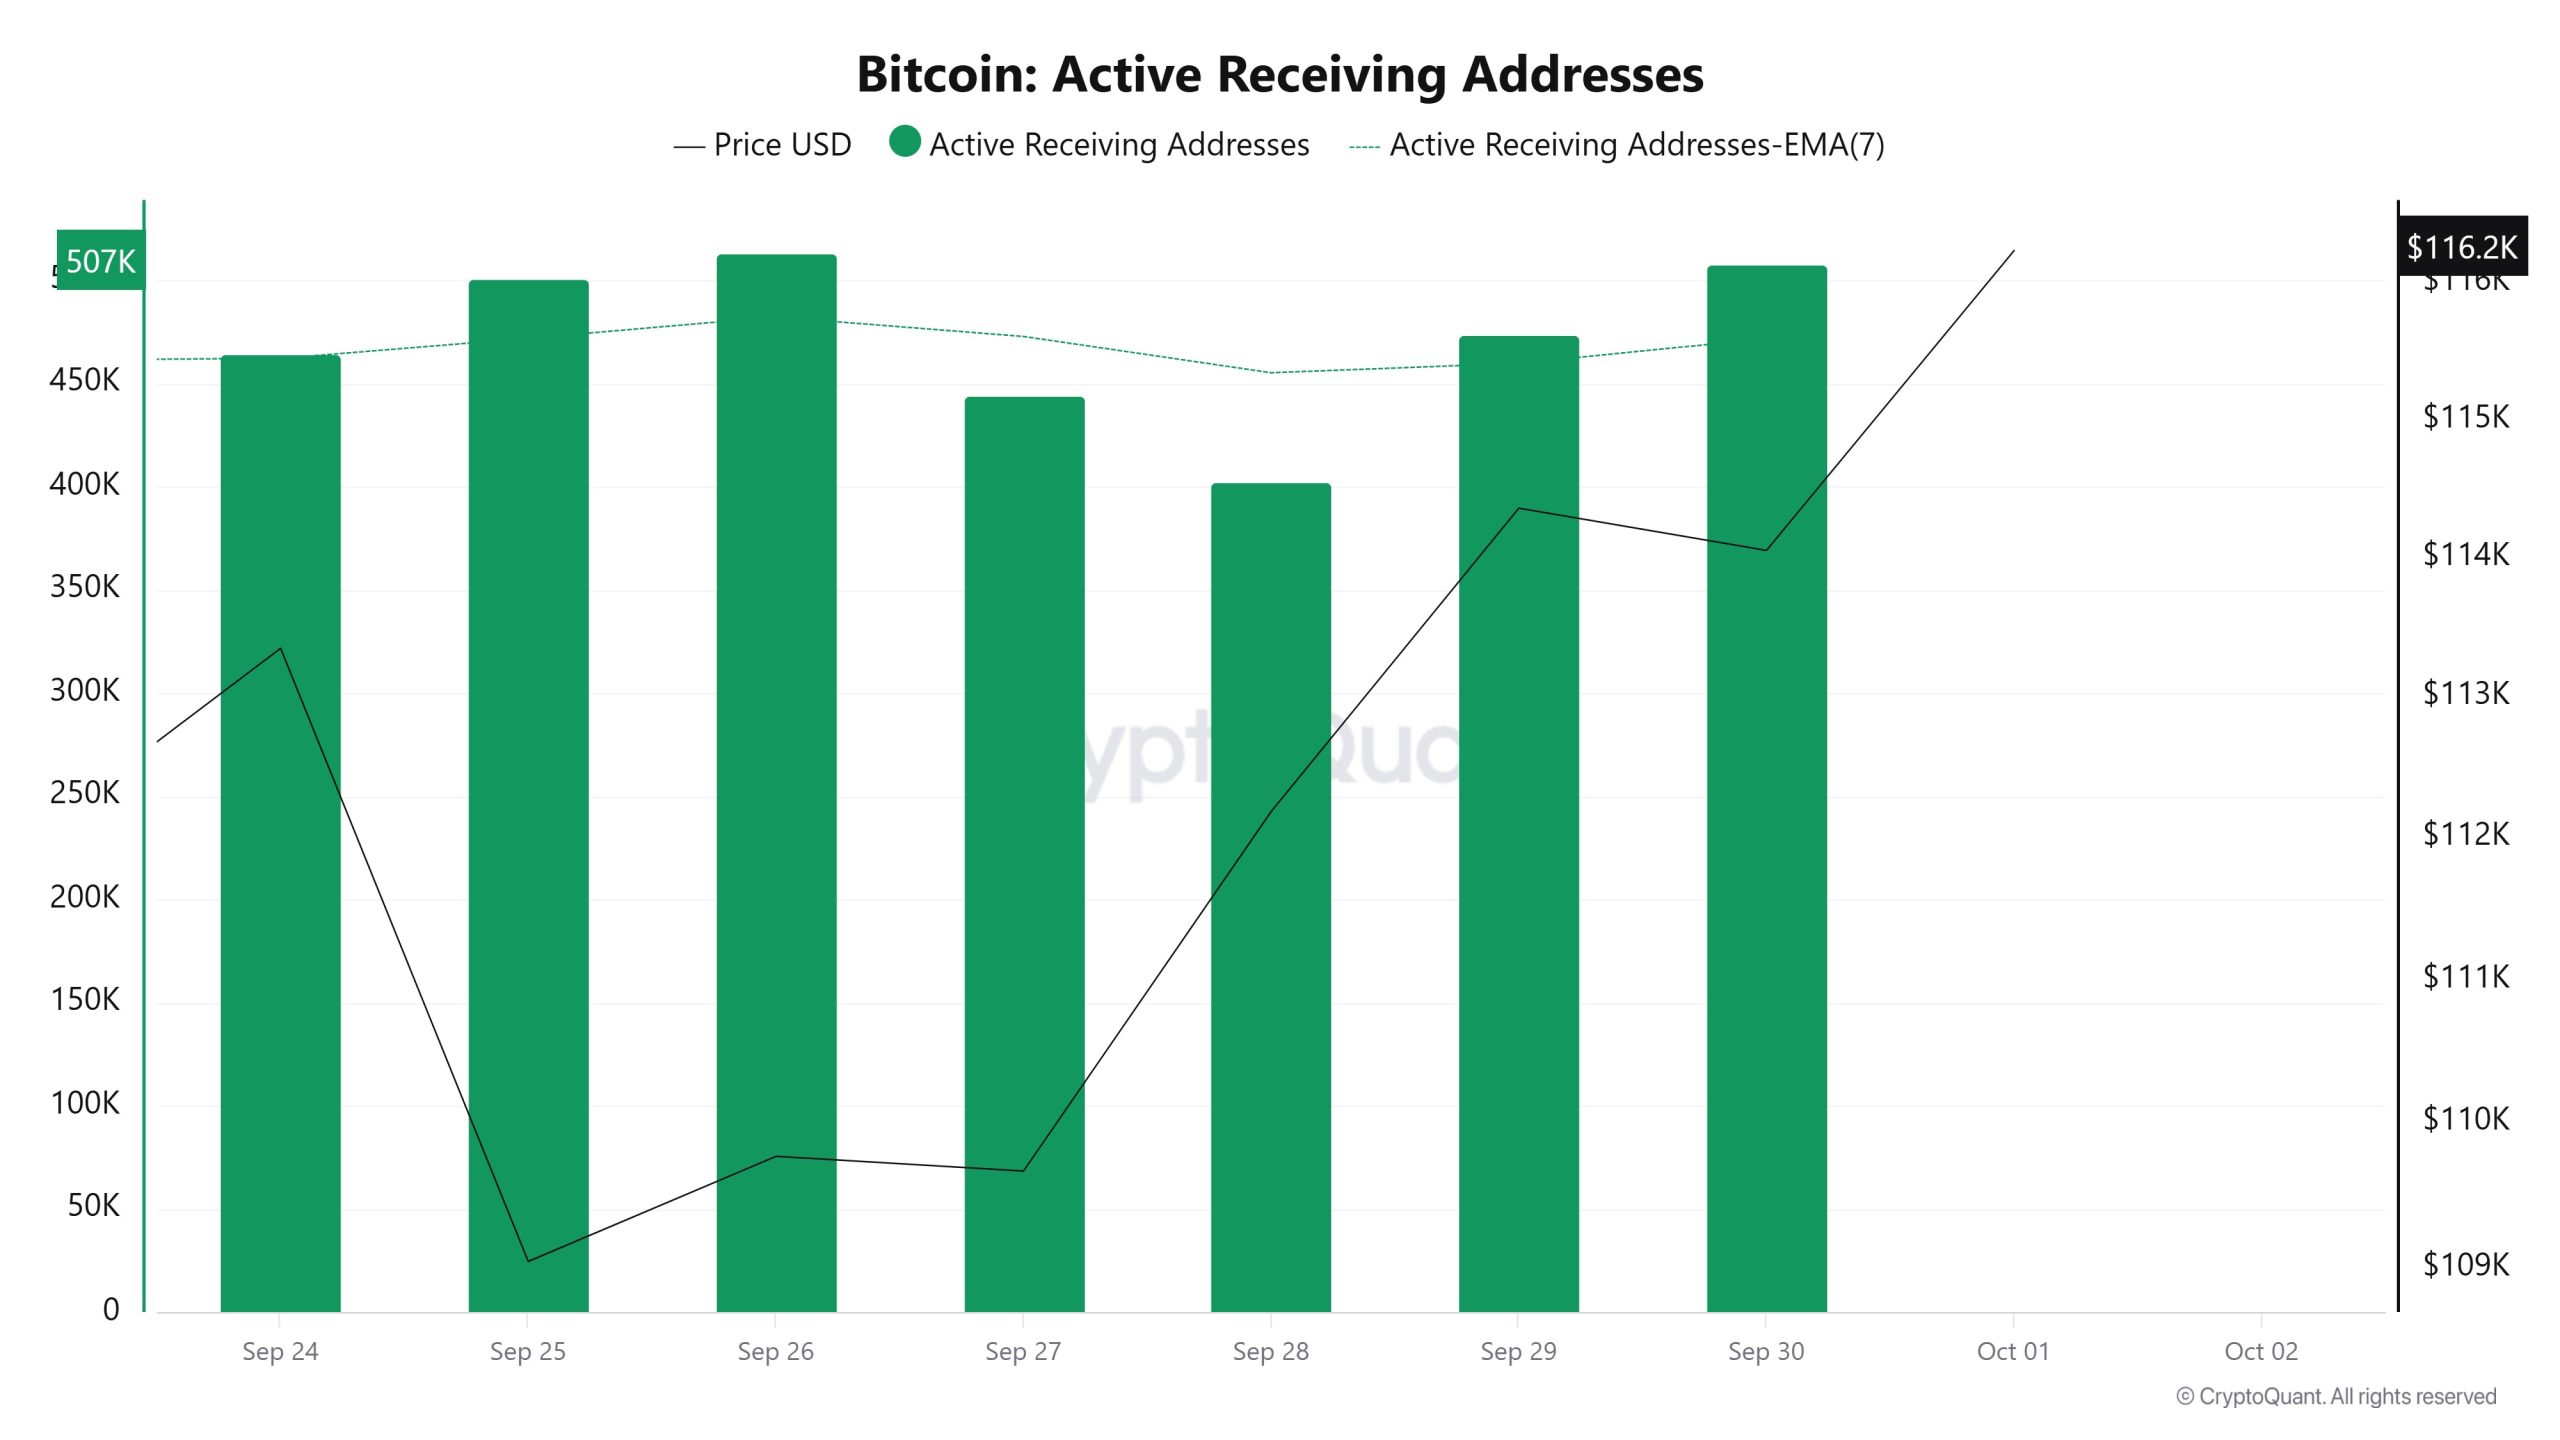 Between September 24th and October 1st, there was a regular rise in active buy addresses with the Black Line (price line). On the day of the price high, active buying addresses rose as high as 513,312, indicating that buyers were buying Bitcoin at $115,000.
Breakdowns
MRVR
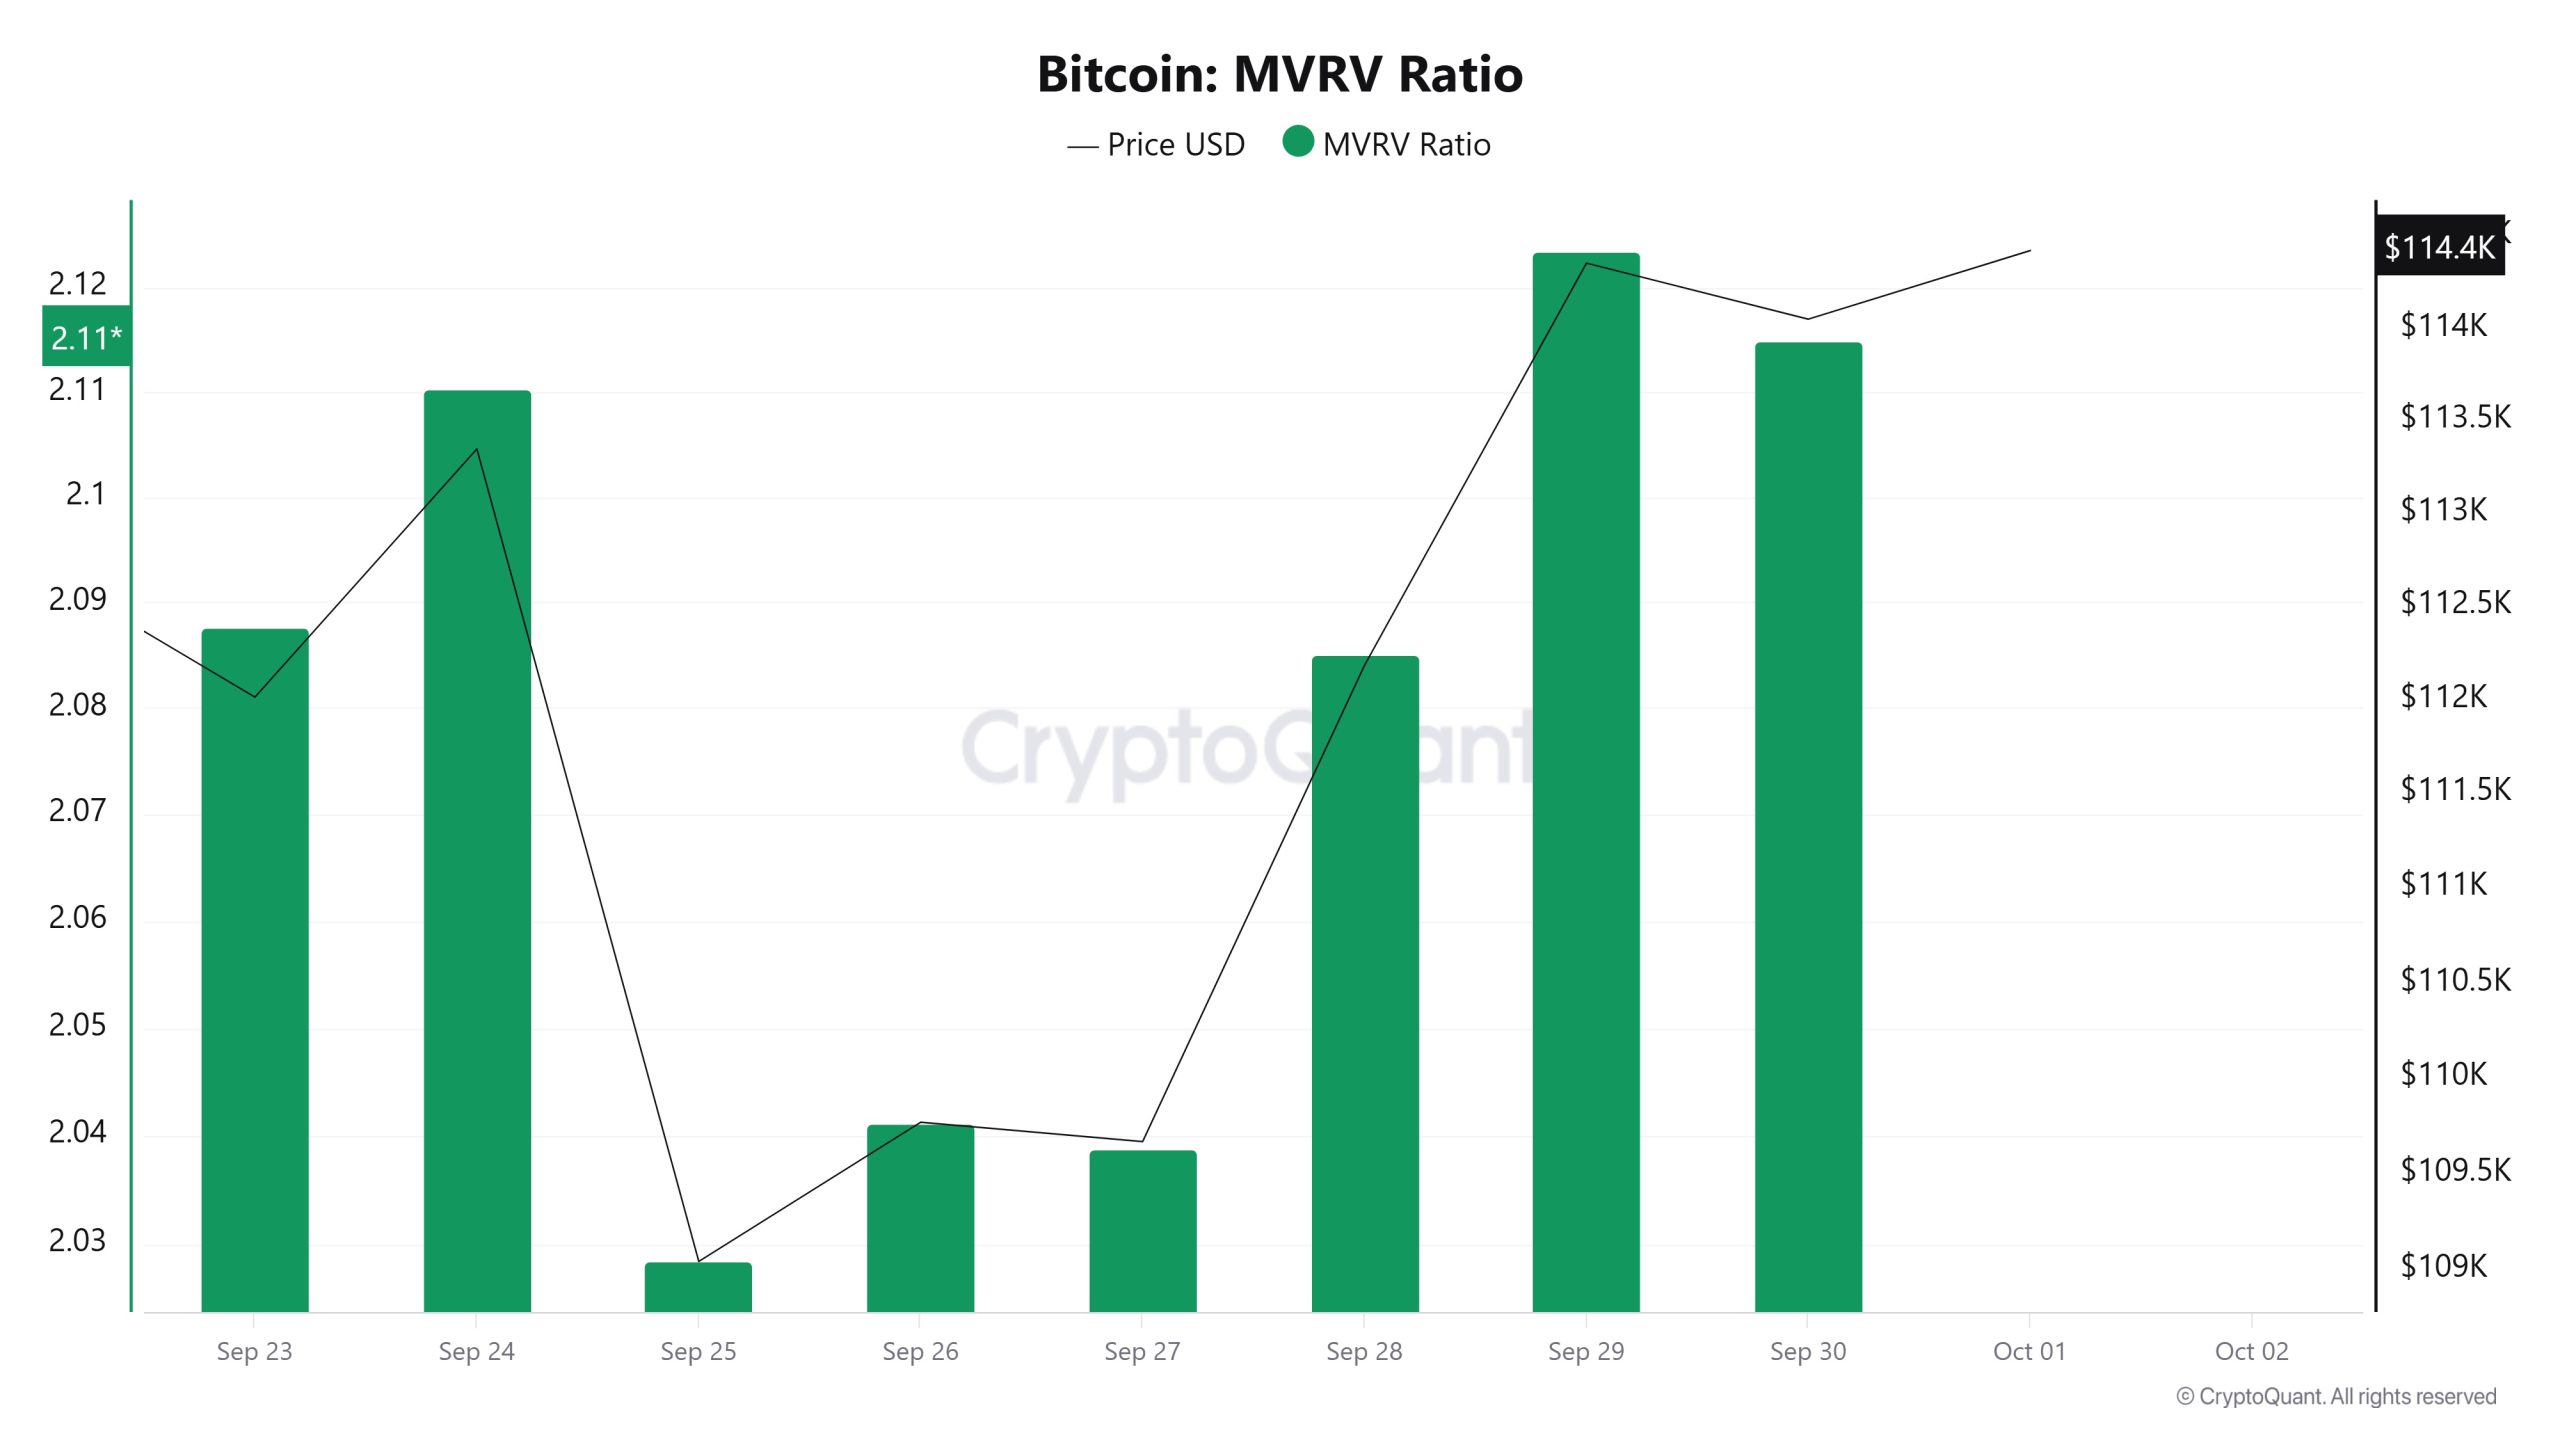 On September 24, the Bitcoin price was at $113,347 while the MVRV Ratio was 2.110.
As of September 30, the Bitcoin price rose to $114,051, an increase of 0.62%, while the MVRV Ratio rose to 2.114, an increase of 0.19%.
Realized Price
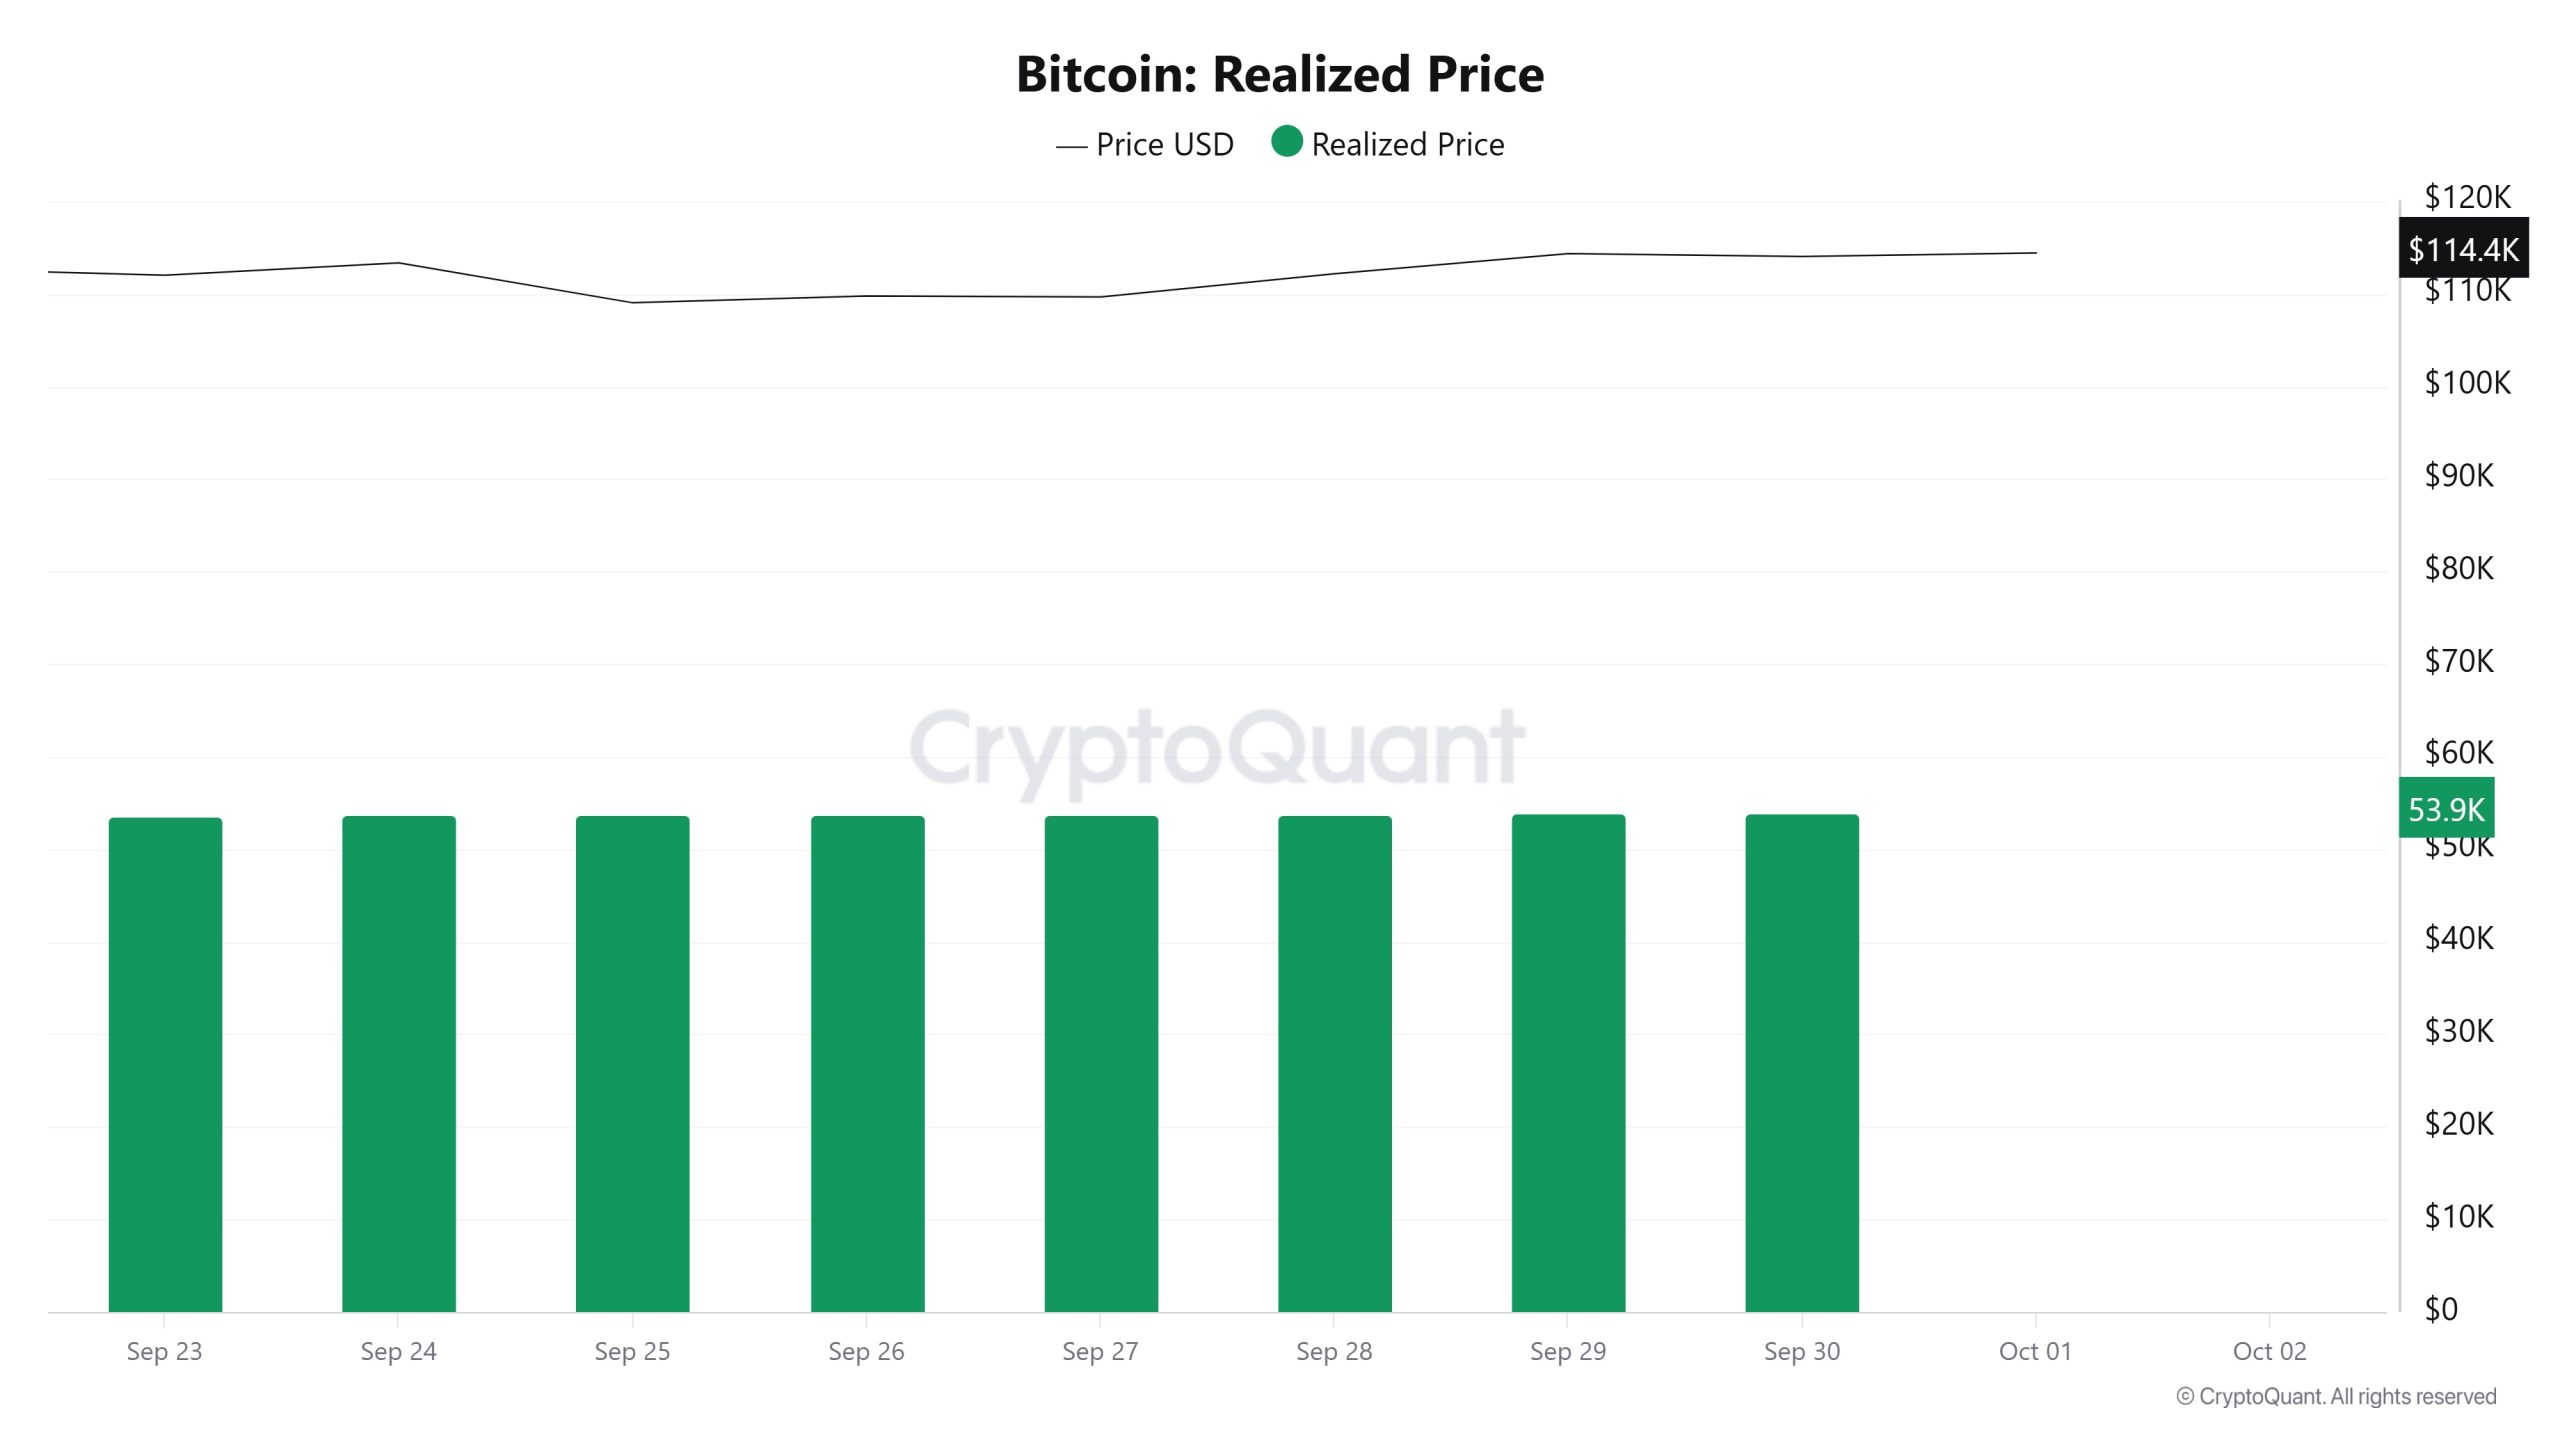 On September 24th, Bitcoin price was at $113,347 while Realized Price was at 53 709.
As of September 30, the Bitcoin price rose to $114,051, an increase of 0.62%, while the Realized Price rose to 53 928, an increase of 0.41%.
Spent Output Profit Ratio (SOPR)
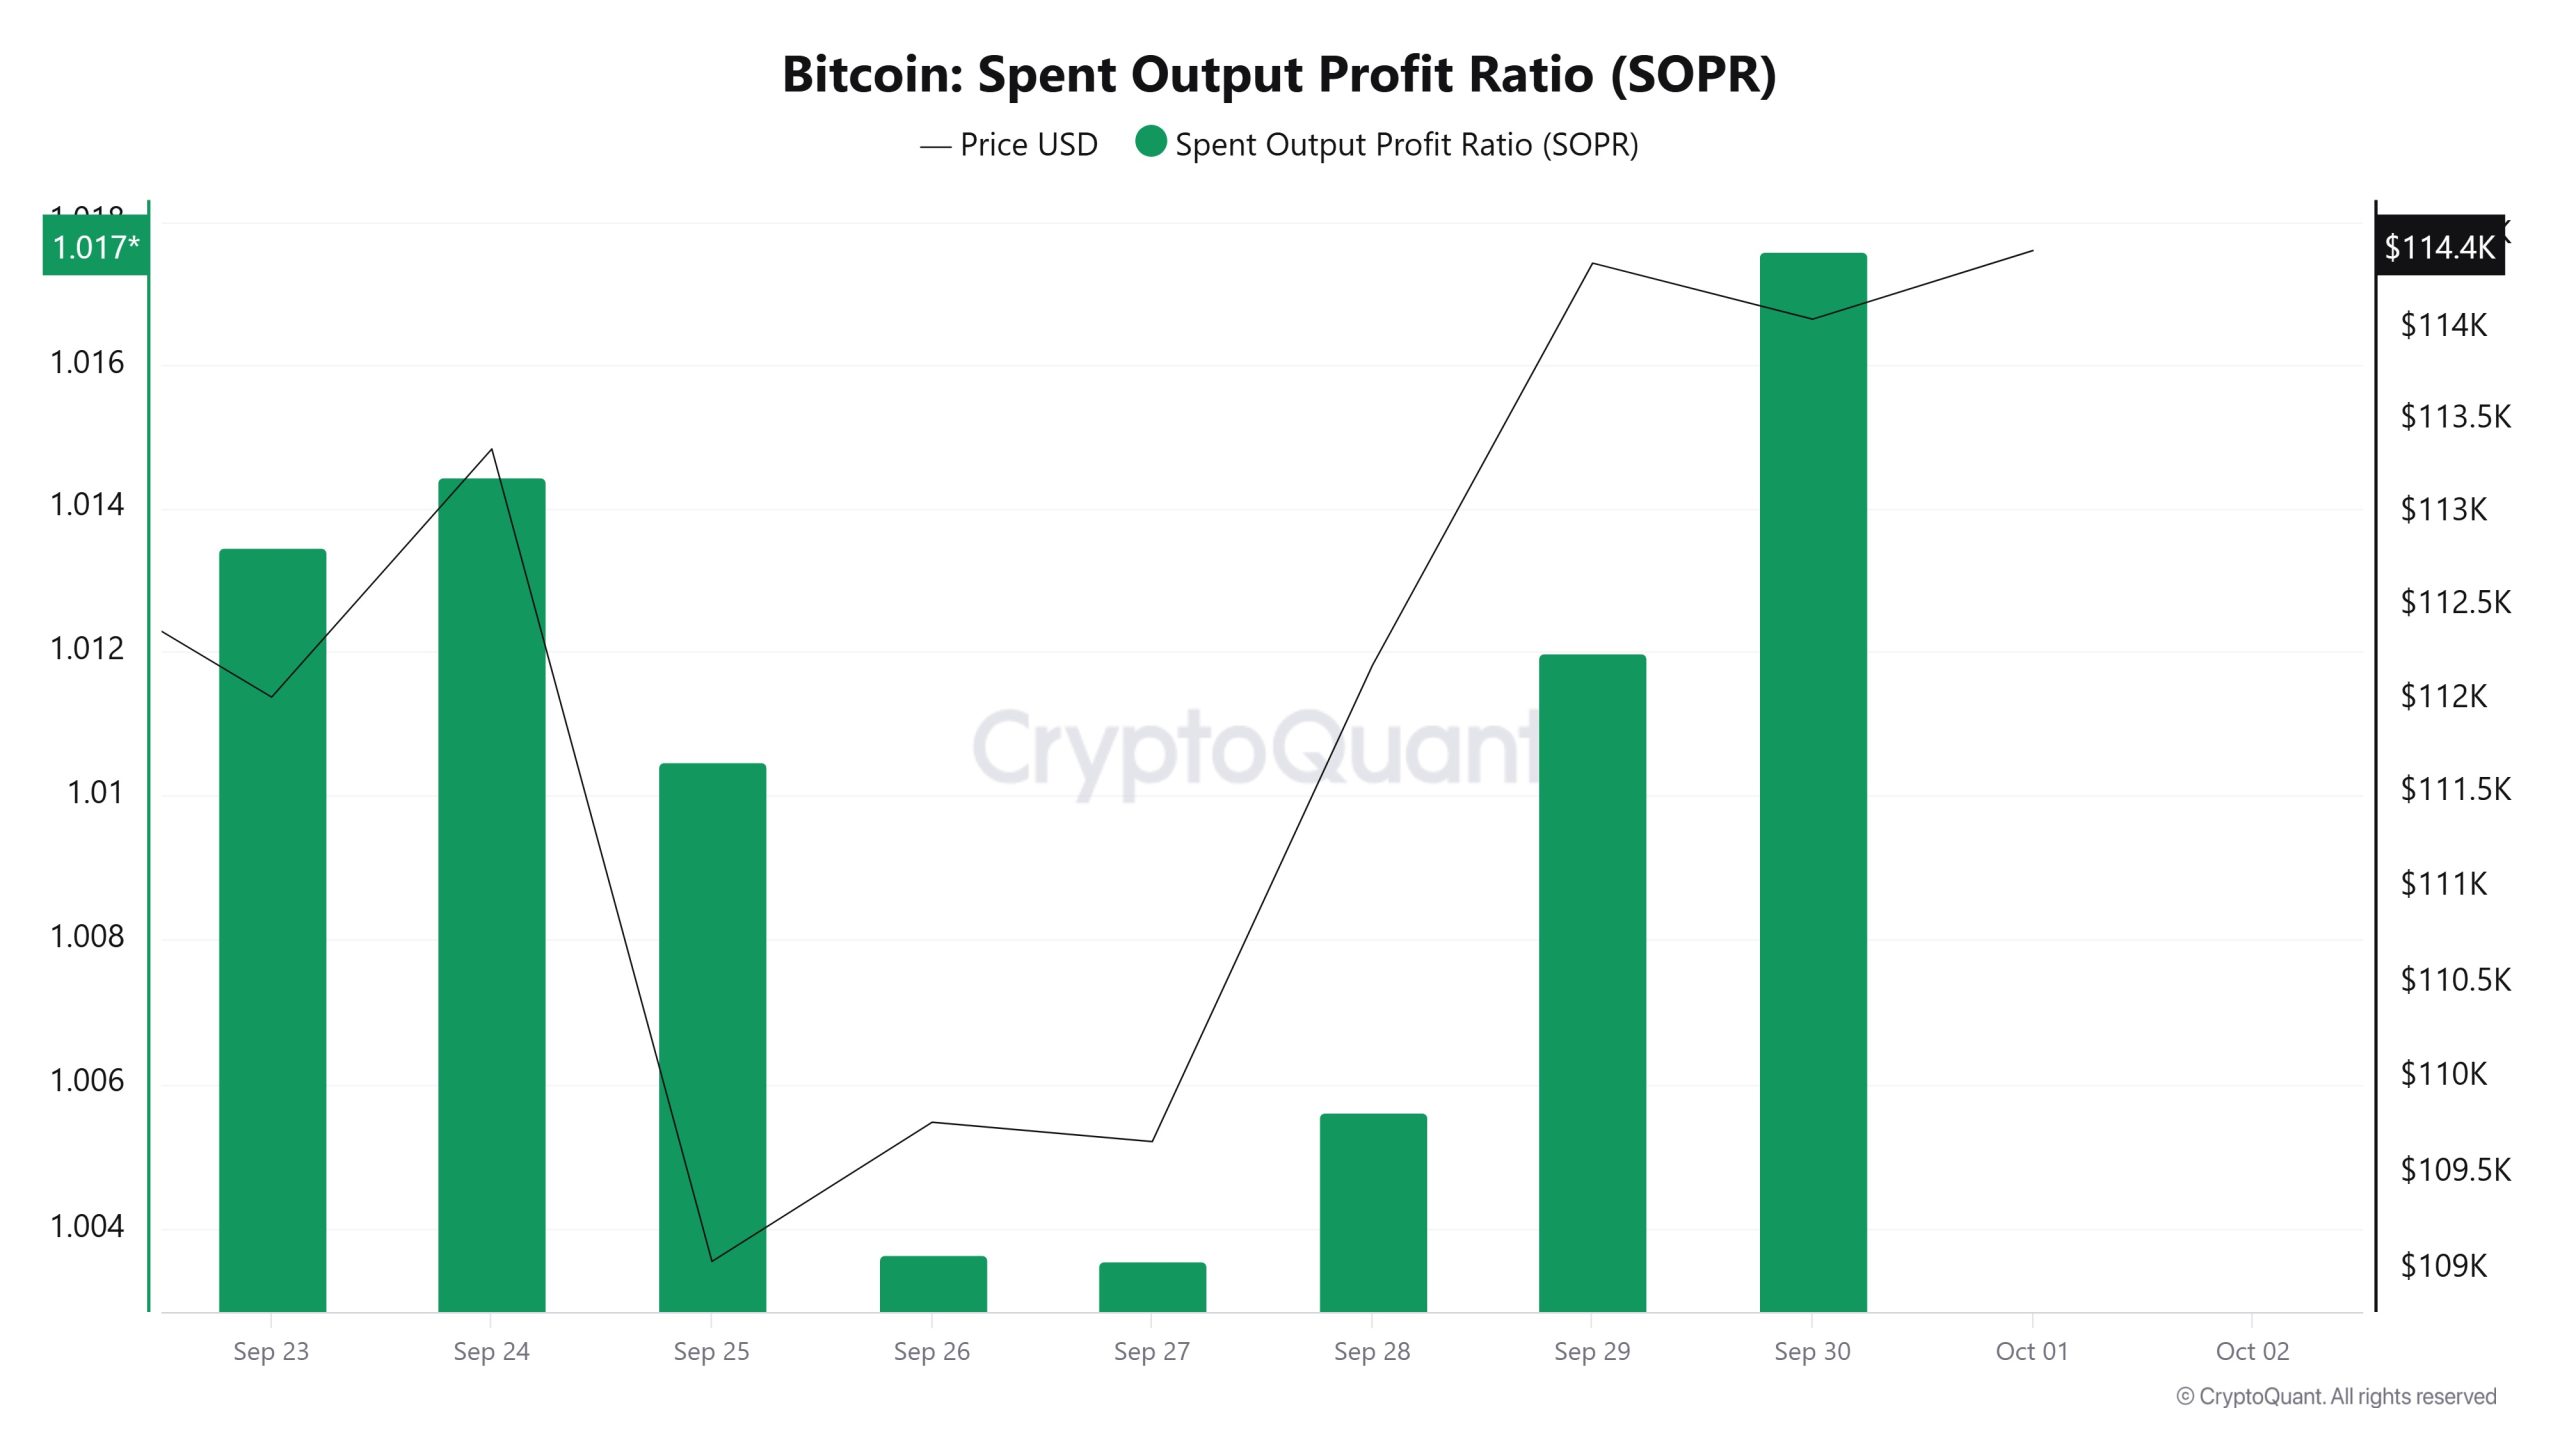 On September 24, the Bitcoin price was at $113,347 while the SOPR metric was at 1,014.
As of September 30, the Bitcoin price rose to $114,051, an increase of 0.62%, while the SOPR metric rose to 1,017, an increase of 0.30%.
Derivatives
Open Interest
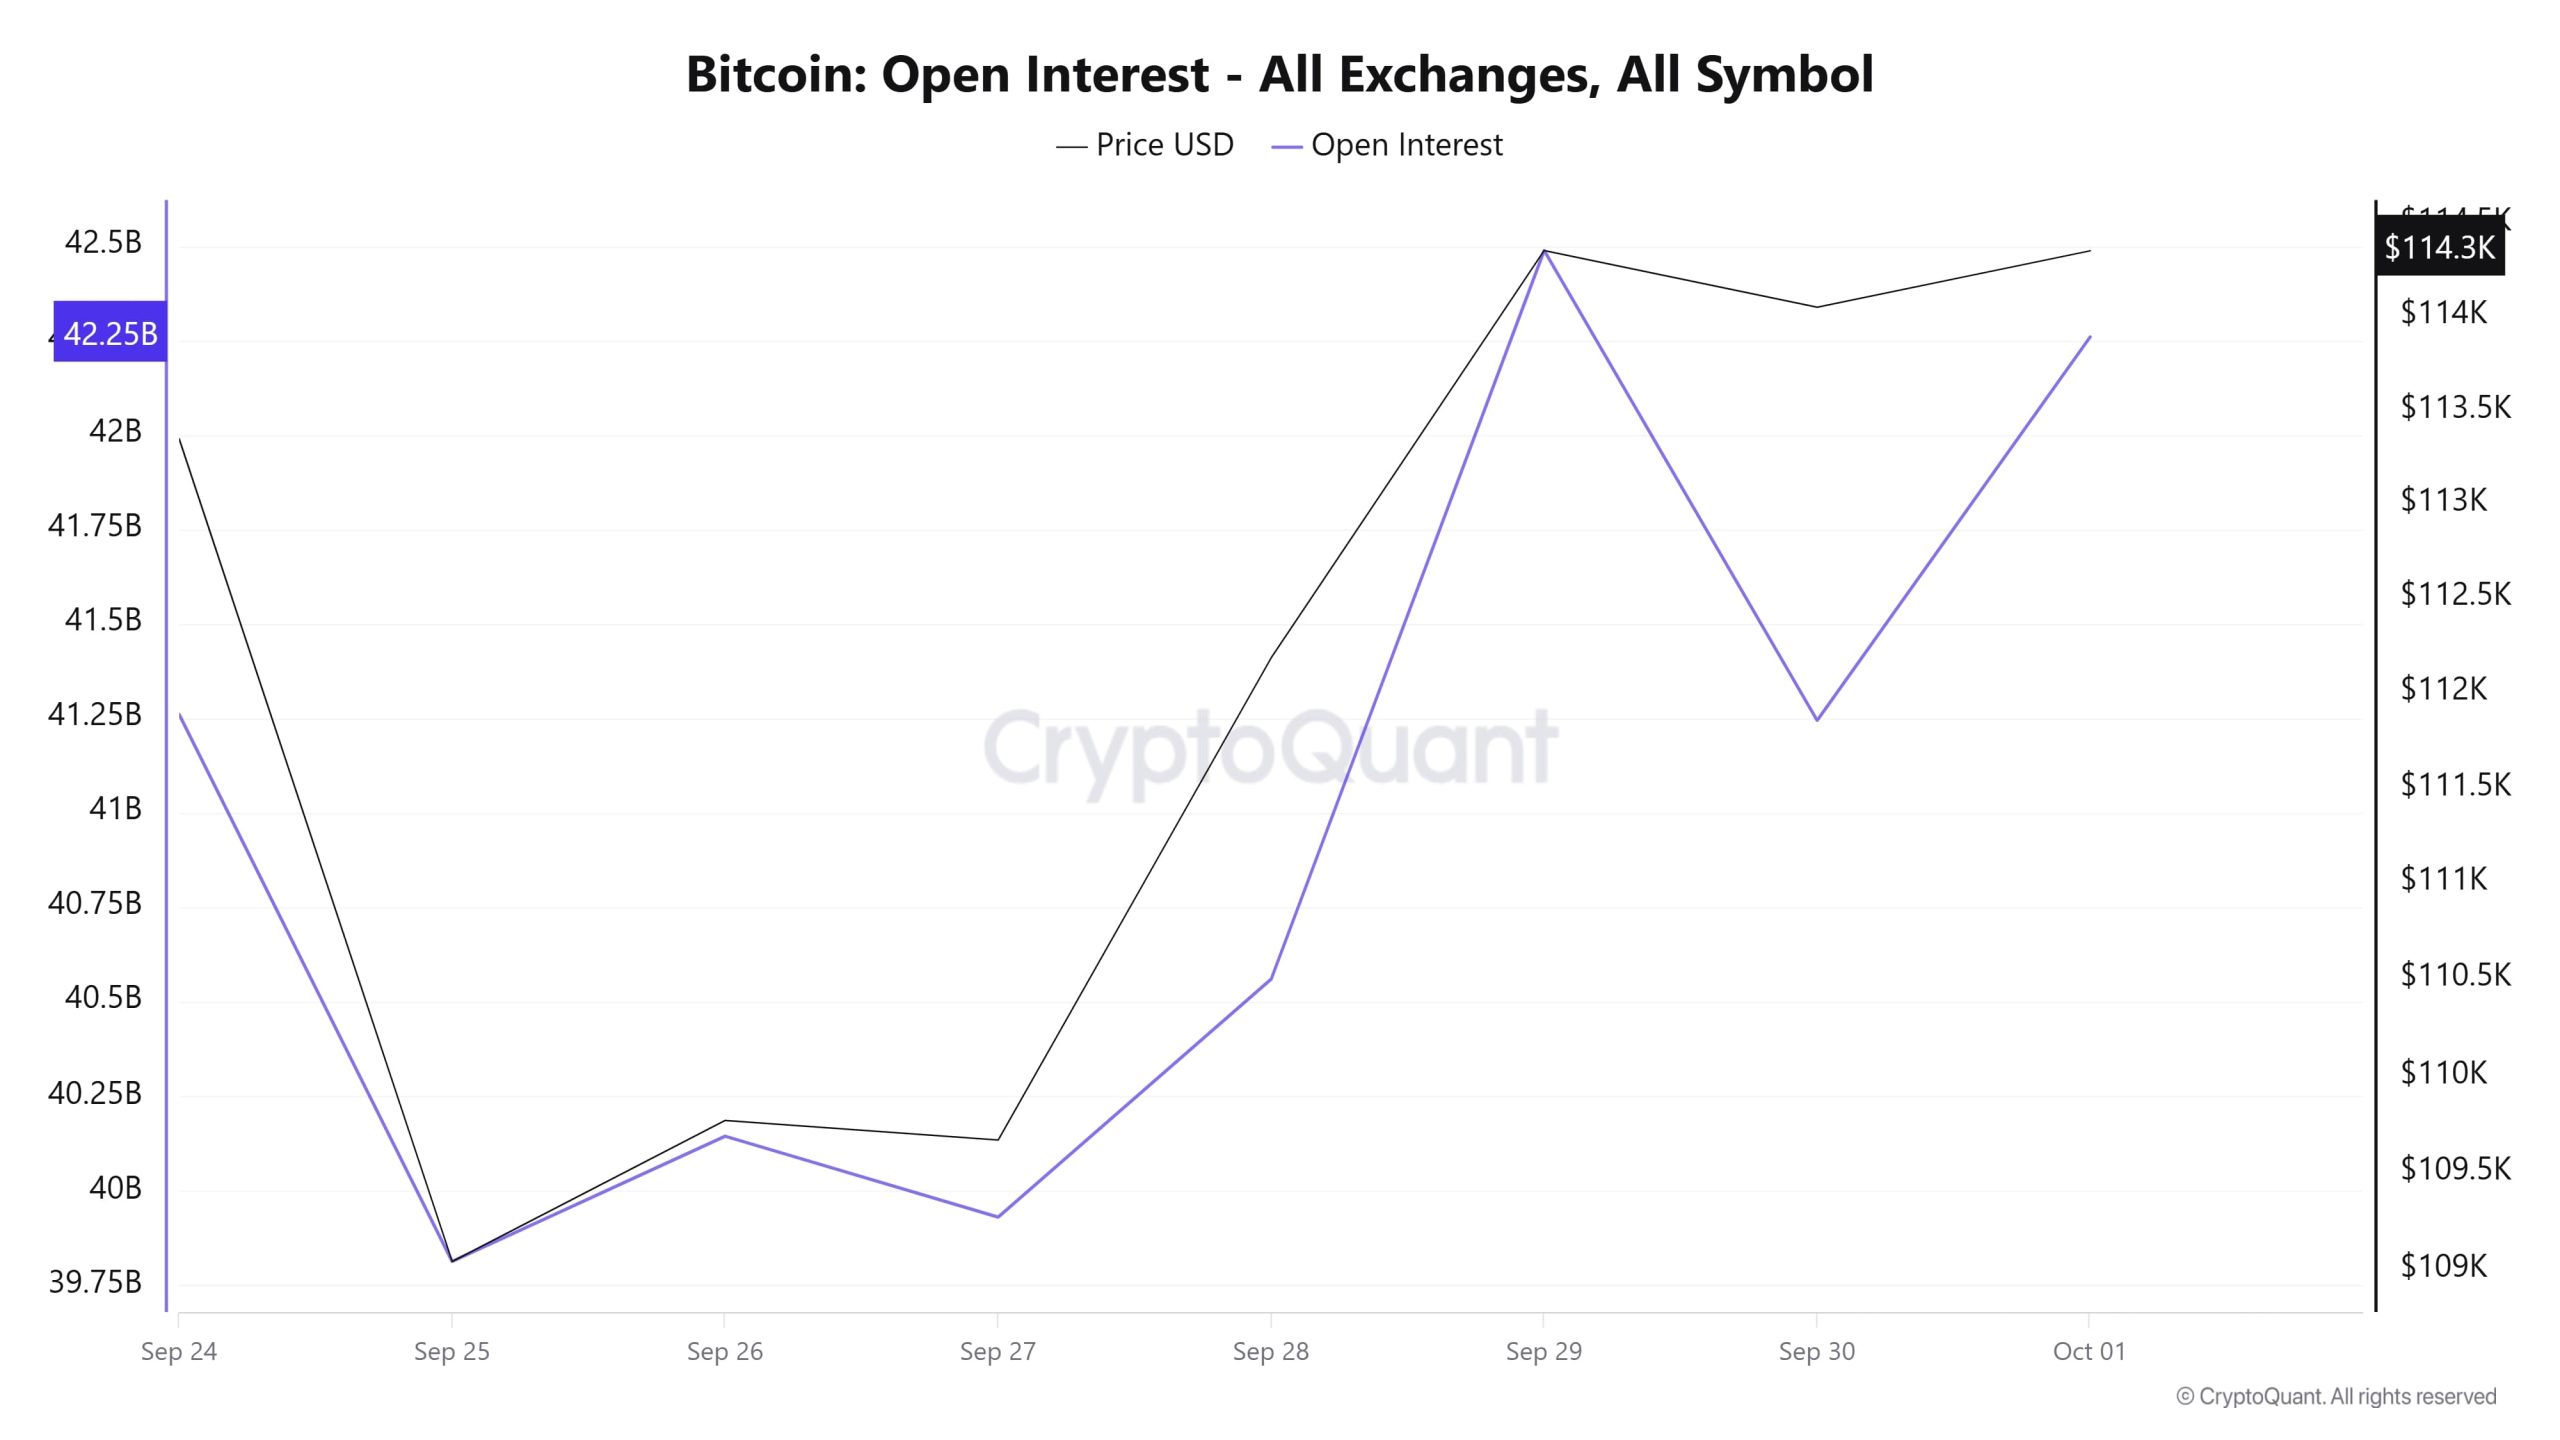
Around September 24, both price and open interest were at high levels, while there was a sharp decline on September 25. At this point, there seems to be a serious liquidation or position closure in both price and open interest. Thereafter, a horizontal trend at low levels was observed for a few days, and it is possible to say that there was more cautious activity in the market during this period. Starting from September 28, both price and open interest started to rise rapidly, reaching a peak on September 29. This rise indicates that new position openings came along with the price increase and that there was a strong entry into the market. However, on September 30, open interest fell sharply while the price did not retreat at the same rate, indicating that short-term positions were liquidated but the price remained relatively strong. Finally, on October 1, open interest rebounded while the price maintained its high level. The overall picture shows that price movements and open interest have been largely in line, especially after the peak on September 29, when the market tried to stabilize a bit more. Increasing open interest supports the upward trend as long as it is in line with the price, but sudden declines can often be read as a sign of short-term liquidation.
Funding Rate
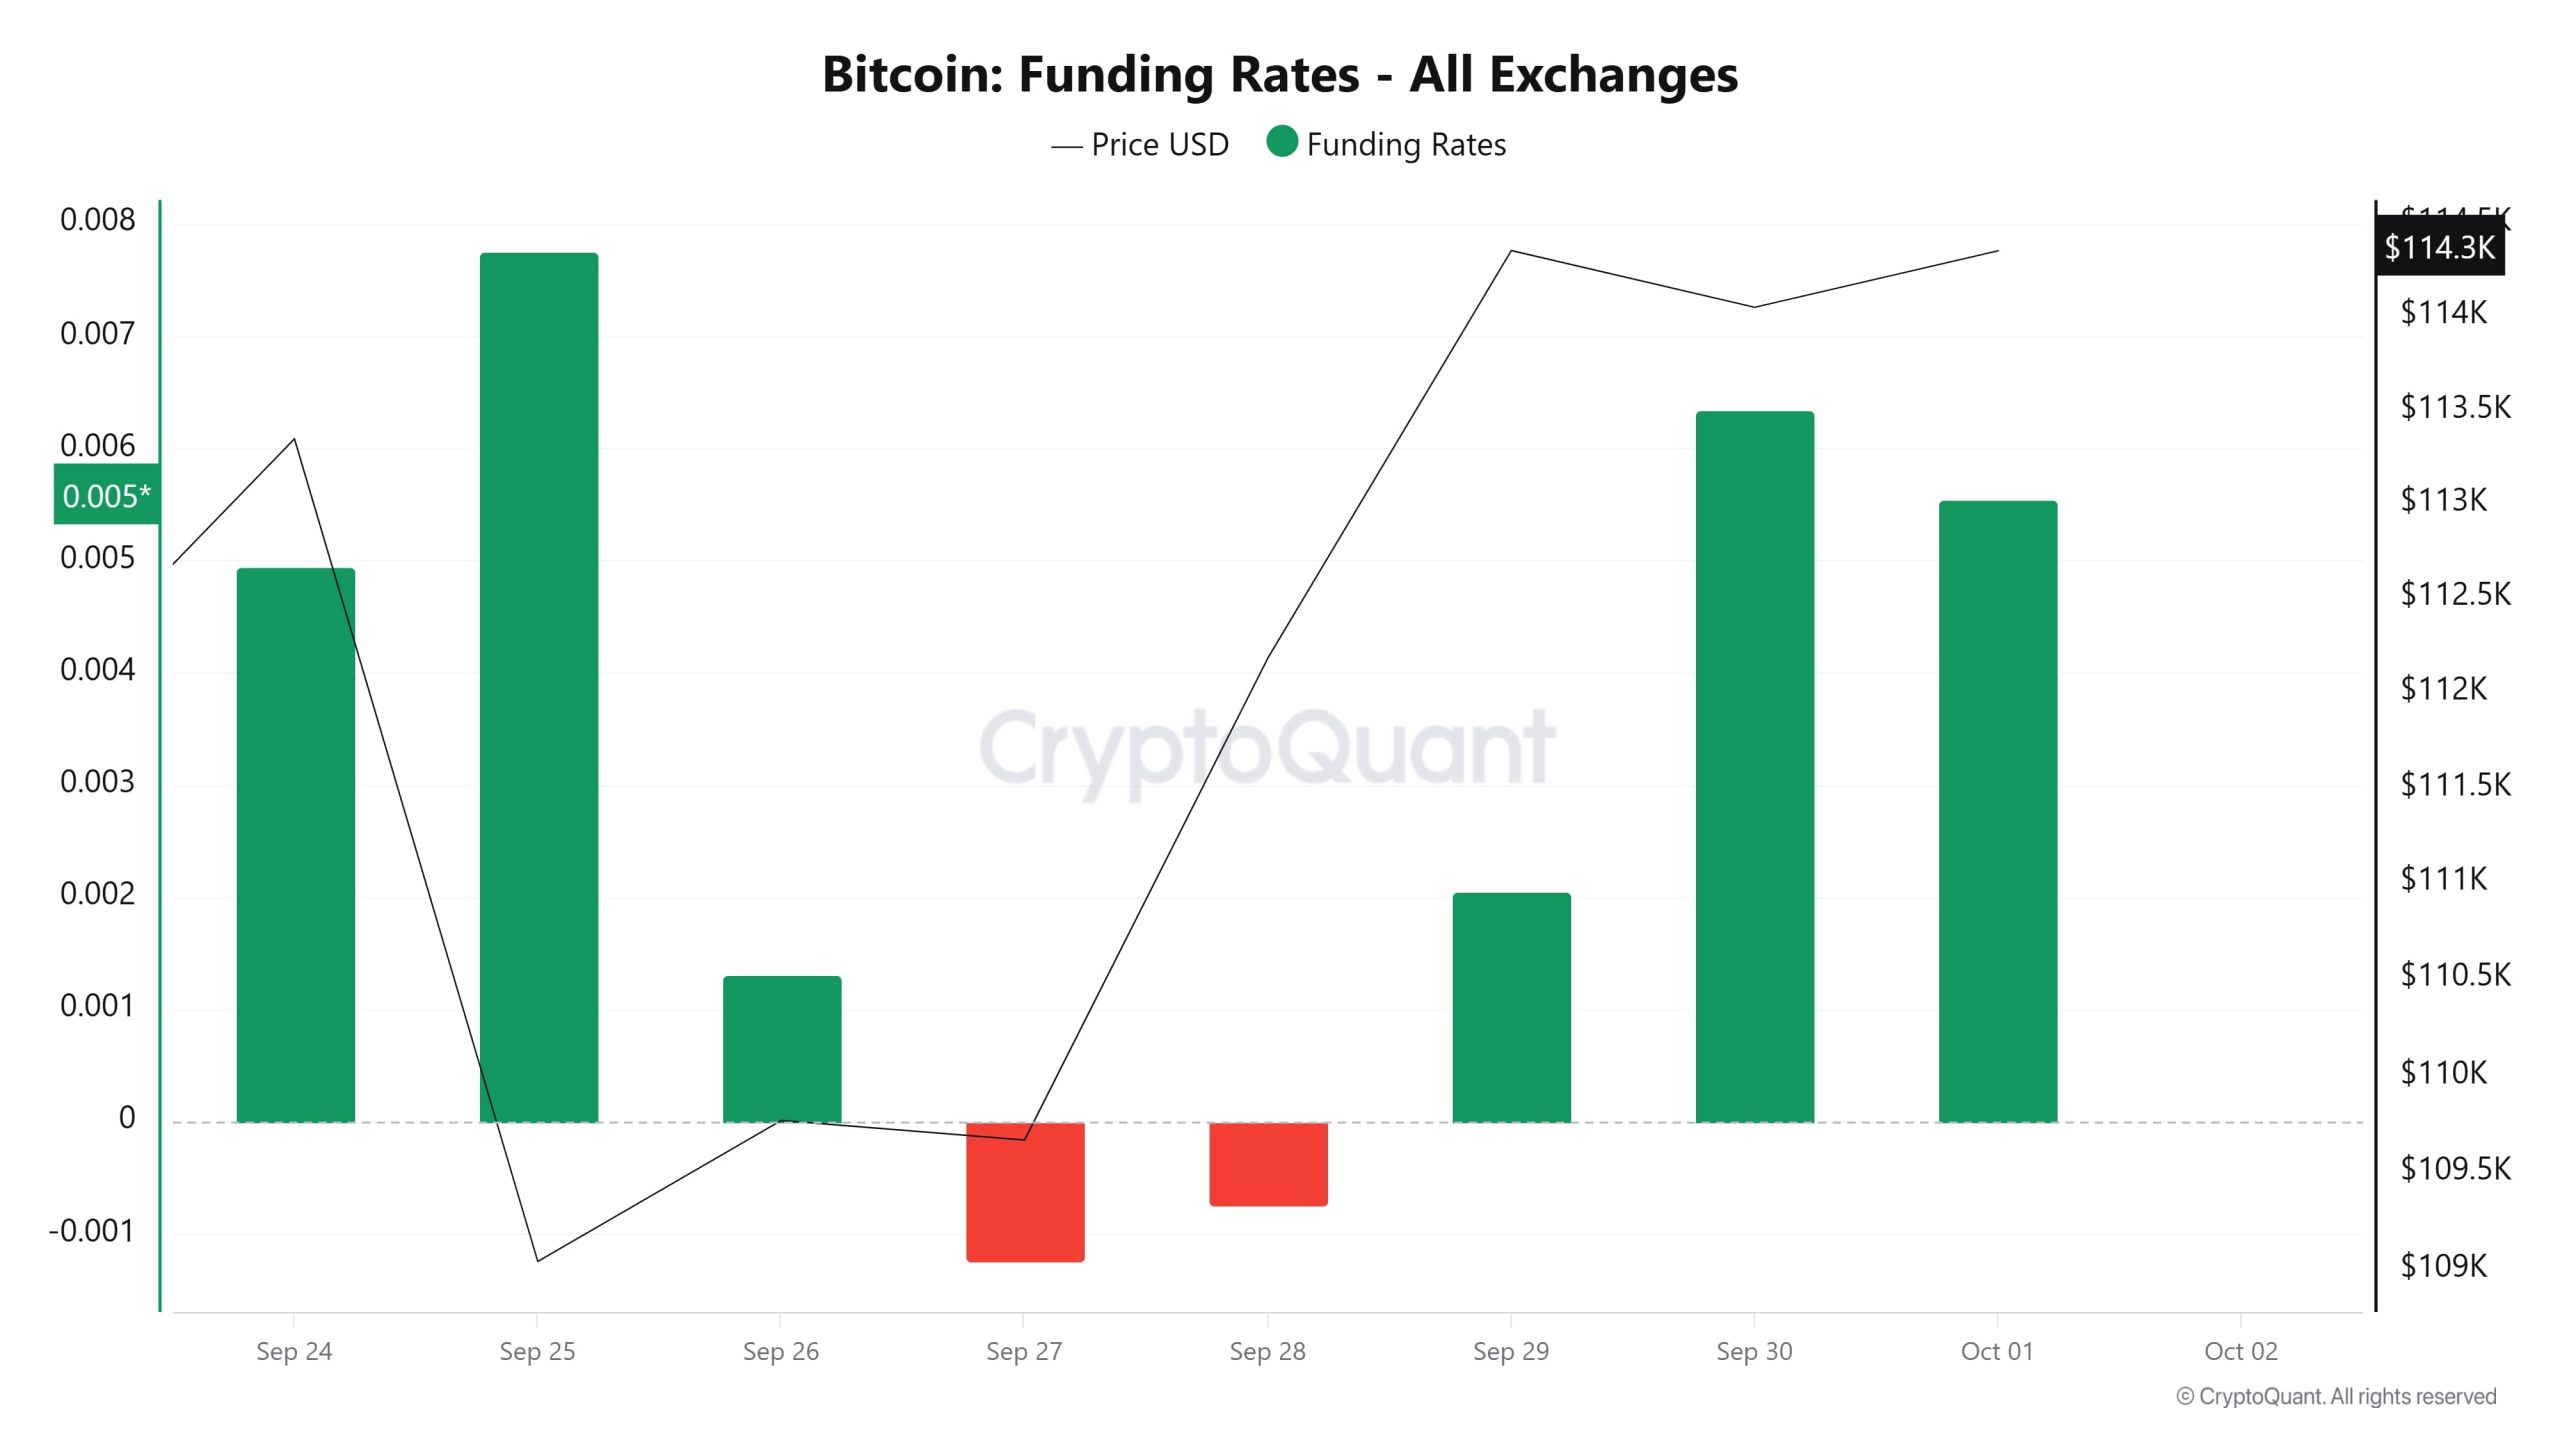 On September 24, when the price is at a strong level, the funding rate is positive, meaning that long positions are more dominant. On September 25, when the price starts to decline, the funding rate also increases rapidly, indicating that the long side is dominating even when the price is falling, suggesting an imbalance in the market. In the period of September 26-28, funding rates turn negative before the price starts to recover, indicating that short positions prevail in the short term. At this point, there is a high probability that shorts were liquidated when the price turned up again while bearish positions increased. From September 29, as the price rallies sharply, the funding rate turns positive again and remains strongly positive, especially on September 30 and October 1. Such a fluctuating movement of the funding rate suggests that the rise was supported by long positions and that market participants acted with bullish expectations. However, a persistently high positive funding rate usually indicates excessive long accumulation, which could pave the way for a potential correction that could put pressure on the price in the future.
Long & Short Liquidations
Last week, BTC price, which fell from $113,500 to $108,600 with the sharp decline on September 25, gained support from this region and rose to $114,700. However, mainly long positions were liquidated. 438 million dollars of long and 153 million dollars of short trades were liquidated.
| Dates | Long Amount (Million $) | Short Amount (Million $) |
|---|---|---|
| September 24 | 30.84 | 22.80 |
| September 25 | 360.81 | 10.18 |
| September 26 | 15.29 | 9.68 |
| September 27 | 1.47 | 1.00 |
| September 28 | 1.33 | 34.25 |
| September 29 | 3.80 | 47.94 |
| September 30 | 24.97 | 27.72 |
| Total | 438.51 | 153.57 |
Supply Distribution
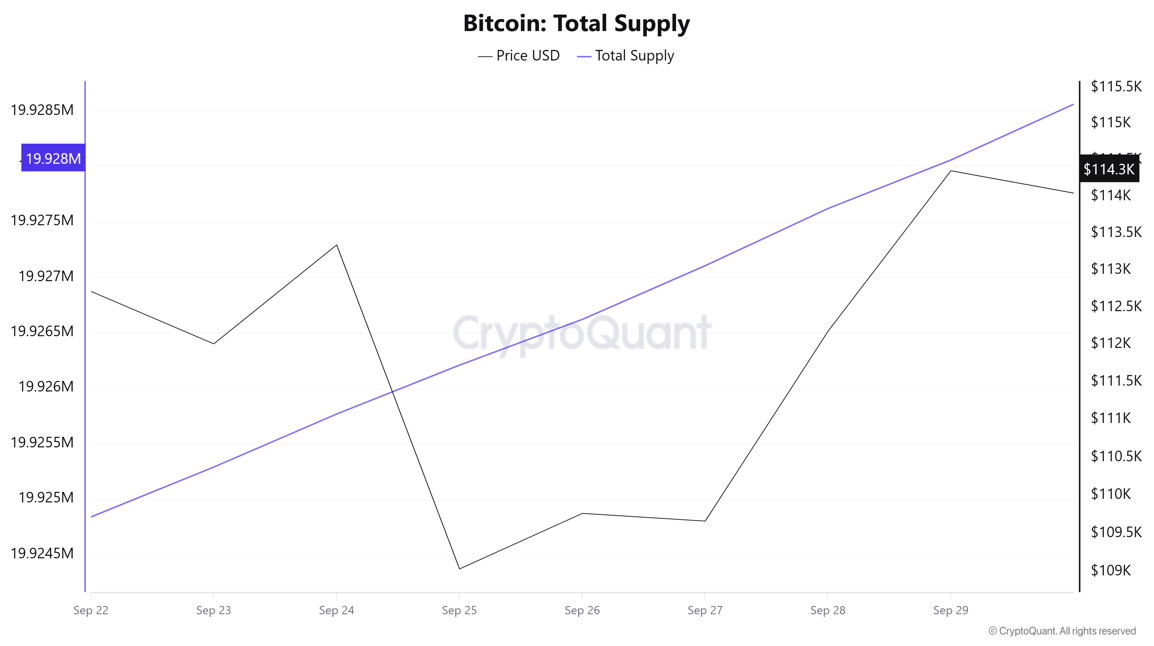
Total Supply: 19,924,839 units, up about 0.01616% from last week.
New Supply: The amount of BTC produced this week was 3,219.
Velocity: Velocity, which was 12.11 last week, was 12.10 as of September 29.
| Wallet Category | 22.09.2025 | 29.09.2025 | Change (%) |
|---|---|---|---|
| < 1 BTC | 8.4531% | 8.0581% | -4.6728% |
| 1 – 10 BTC | 11.3922% | 11.3815% | -0.0939% |
| 10 – 100 BTC | 24.5533% | 24.5373% | -0.0652% |
| 100 – 1k BTC | 29.9313% | 30.0035% | 0.2412% |
| 1k – 10k BTC | 17.7431% | 17.7176% | -0.1437% |
| 10k+ BTC | 7.9259% | 7.9101% | -0.1993% |
According to the latest weekly data, Bitcoin wallet distribution presented a mixed picture. The share of wallets holding <1 BTC decreased from 8.4531% to 8.0581%, down by about 4.67%. The 1-10 BTC range decreased from 11.3922% to 11.3815%, down about 0.09%. In the 10-100 BTC group, the share shifted from 24.5533% to 24.5373%, decreasing by about 0.07%. In the 100-1,000 BTC range, it increased from 29.9313% to 30.0035%, up by about 0.24%. The 1,000-10,000 BTC band decreased from 17.7431% to 17.7176%, down about 0.14%. The share of 10,000+ BTC wallets decreased by about 0.20%, from 7.9259% to 7.9101%.
Exchange Supply Ratio
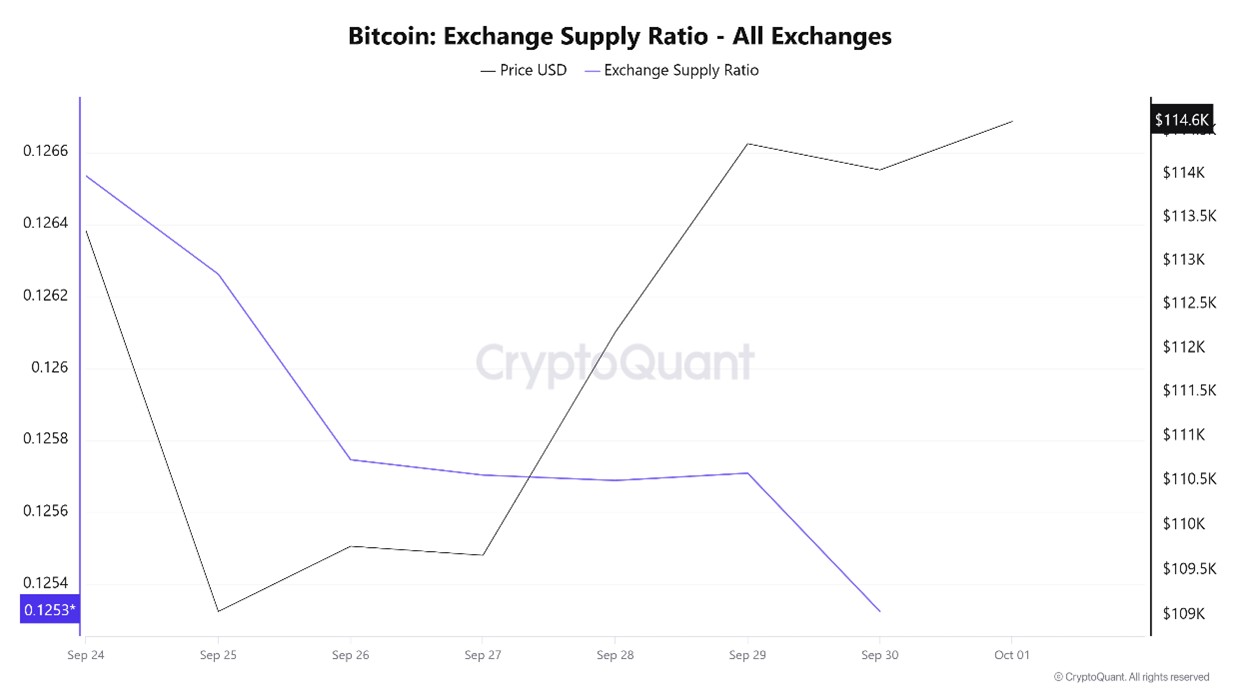
Data from the Bitcoin Exchange Supply Ratio table, which shows how much of Bitcoins are held on exchanges compared to the total supply of Bitcoins, showed high rates this week. This week’s data reveals that the general trend is for a positive correlation between the price of Bitcoin and the rate of supply entering exchanges, dominated by a positive correlation in these two variables. It shows that the majority of Bitcoins continue to be held in wallets and are available for buying in the market.
Between September 24 and October 1, the Bitcoin Exchange Supply Ratio decreased from 0.12626194 to 0.12532409. During this period, the Bitcoin price rose from $109,000 to $114,000. The divergence of the two variables, especially this week, suggests that despite the rise in price, the amount of Bitcoin supplied to exchanges has decreased, possibly indicating that long-term investors have stopped holding their assets. It is seen that the Bitcoin price is generally bearish.
Exchange Reserve
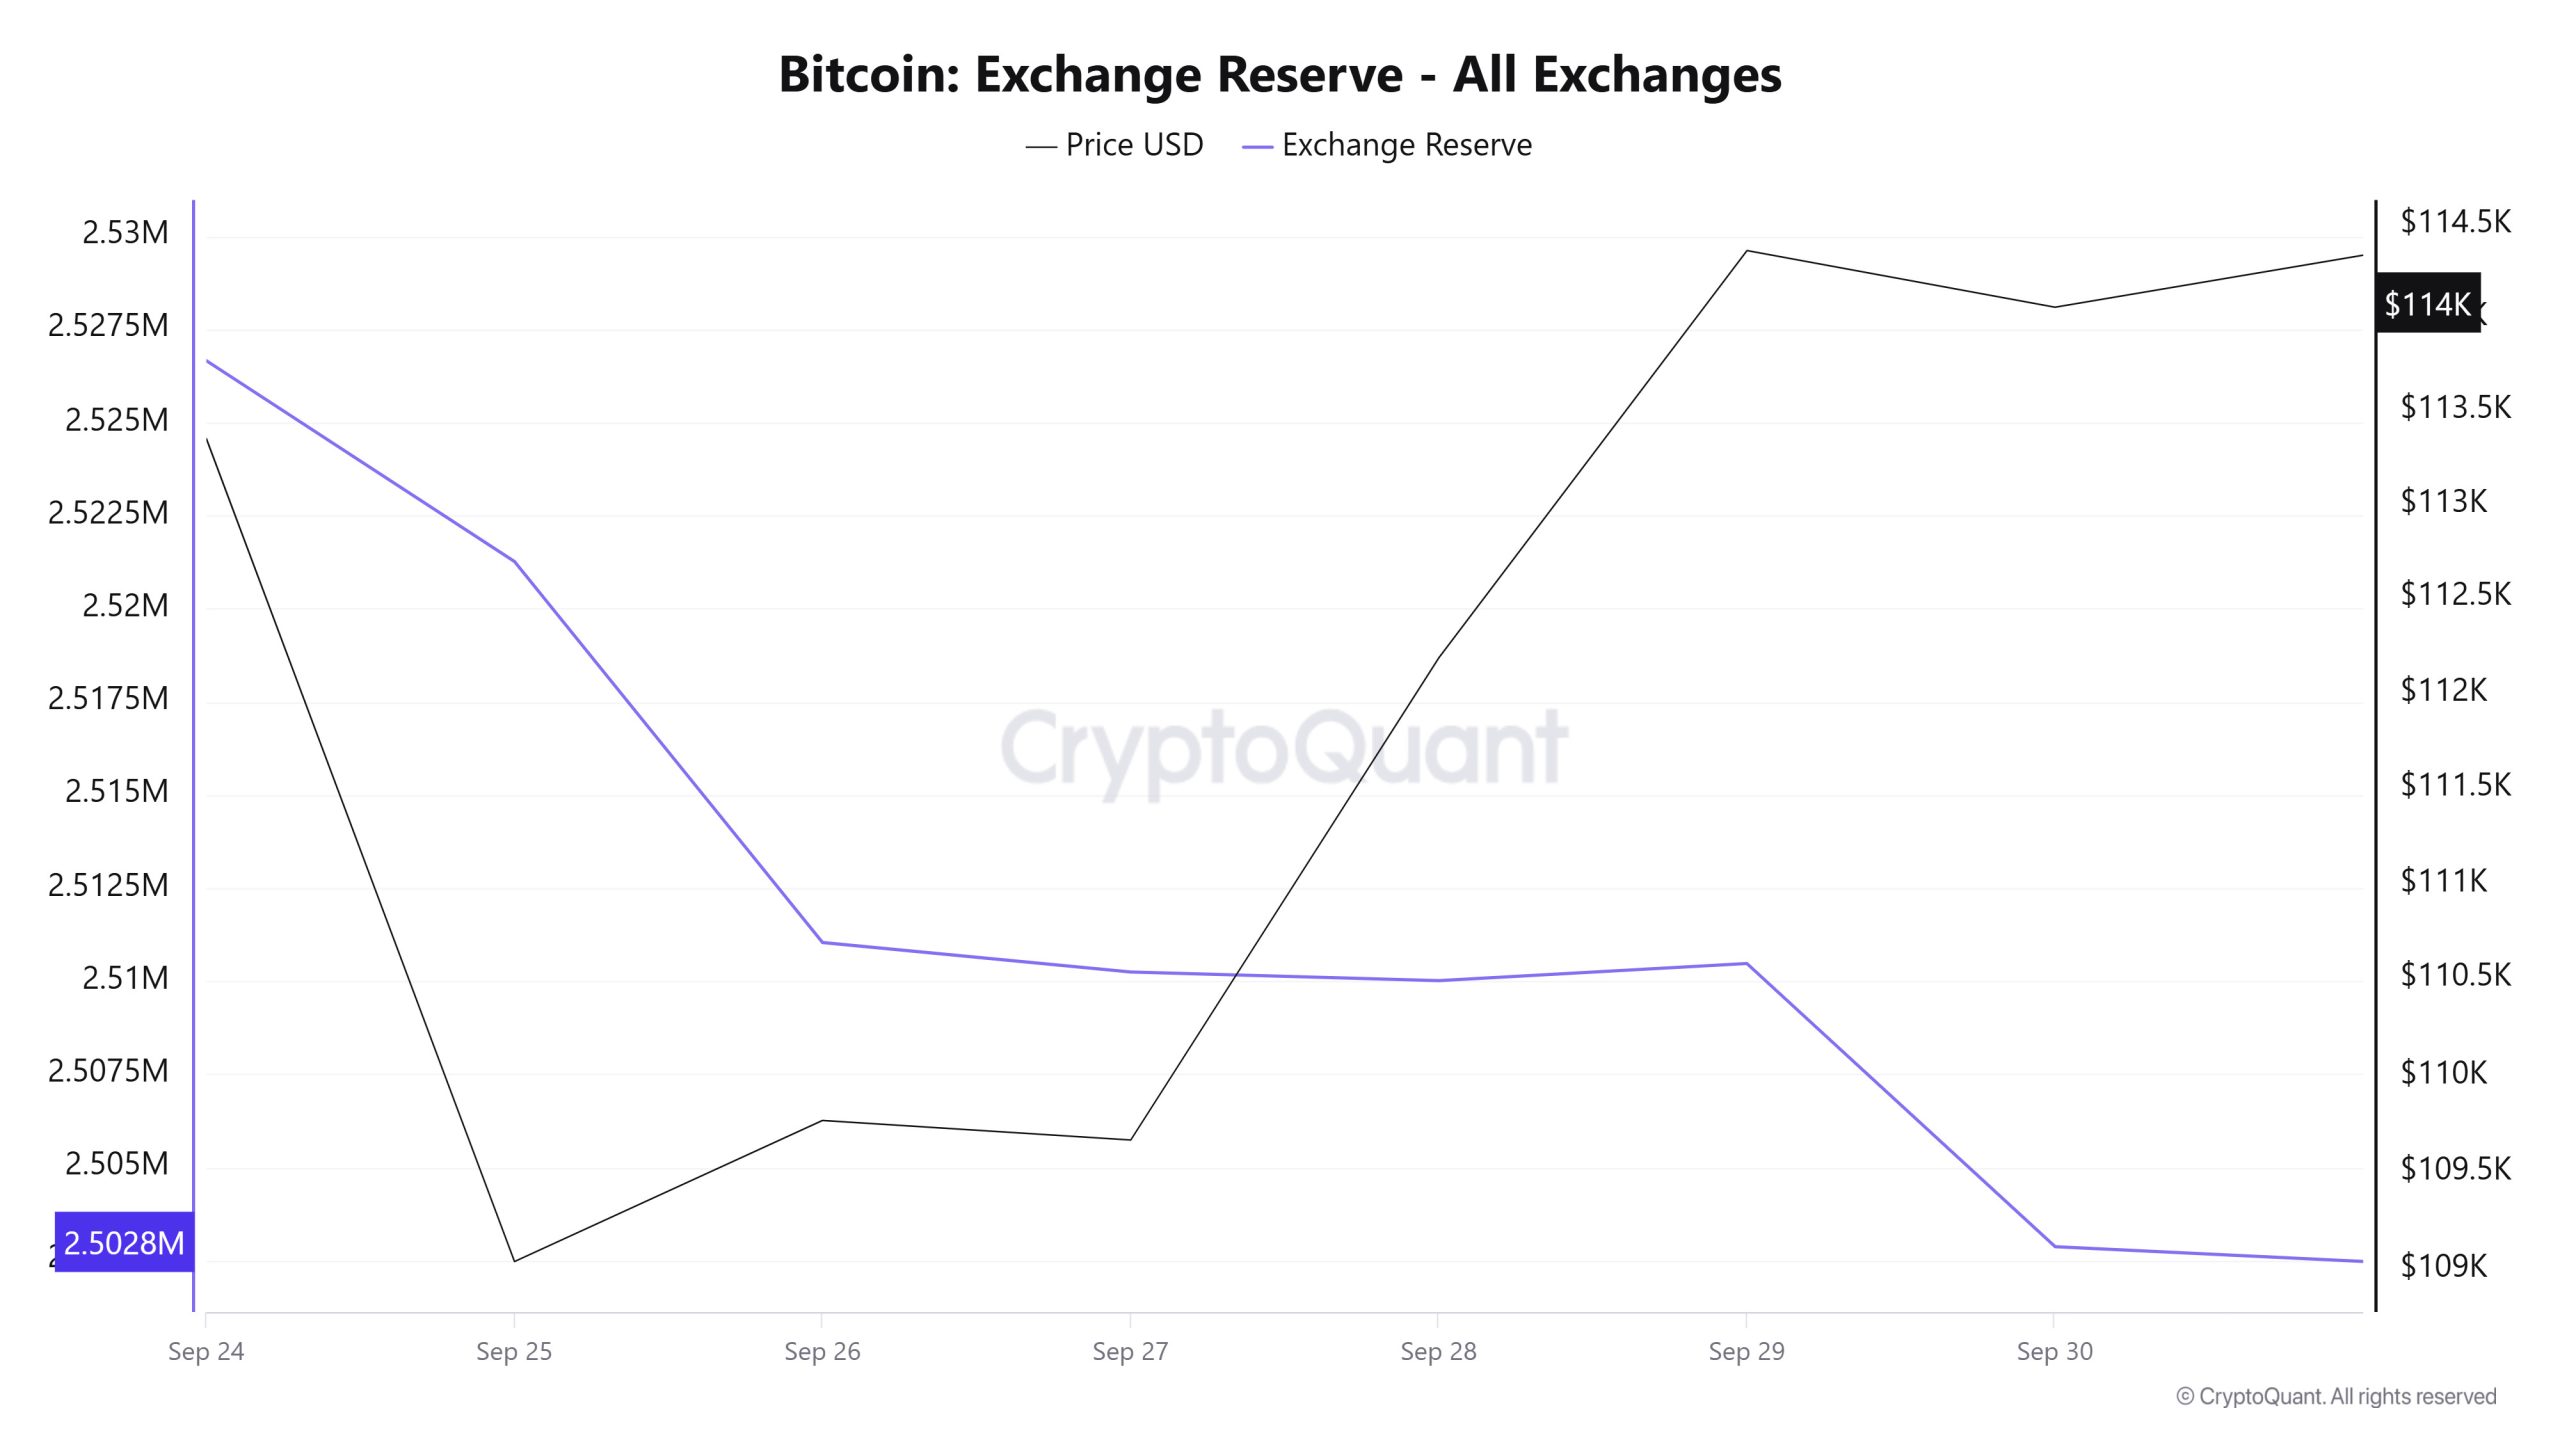
Between September 24-30, 2025, Bitcoin reserves on exchanges decreased from 2,526,654 BTC to 2,502,870 BTC, for a total net outflow of 23,784 BTC. In this process, there was a decrease of approximately 0.94% in reserves. During the same period, the BTC price rose from $112,008 to $114,051, gaining about 1.82%. The decrease in reserves while the price rose suggests that investors are withdrawing their assets from exchanges instead of selling. Although this indicates a tightening on the supply side, it has not yet created a strong upward momentum on the price as the strength of buyers is limited.
| Date | 24-Sep | 25-Sep | 26-Sep | 27-Sep | 28-Sep | 29-Sep | 30-Sep |
|---|---|---|---|---|---|---|---|
| Exchange Inflow | 23,401 | 38,776 | 43,153 | 13,371 | 11,650 | 33,533 | 42,766 |
| Exchange Outflow | 26,359 | 44,166 | 53,383 | 14,158 | 11,885 | 33,073 | 50,366 |
| Exchange Netflow | -2,958 | -5,391 | -10,230 | -787 | -235 | 460 | -7,600 |
| Exchange Reserve | 2,526,654 | 2,521,263 | 2,511,033 | 2,510,246 | 2,510,011 | 2,510,471 | 2,502,870 |
| BTC Price | 112,008 | 109,040 | 109,766 | 109,665 | 112,184 | 114,356 | 114,051 |
Fees and Revenues
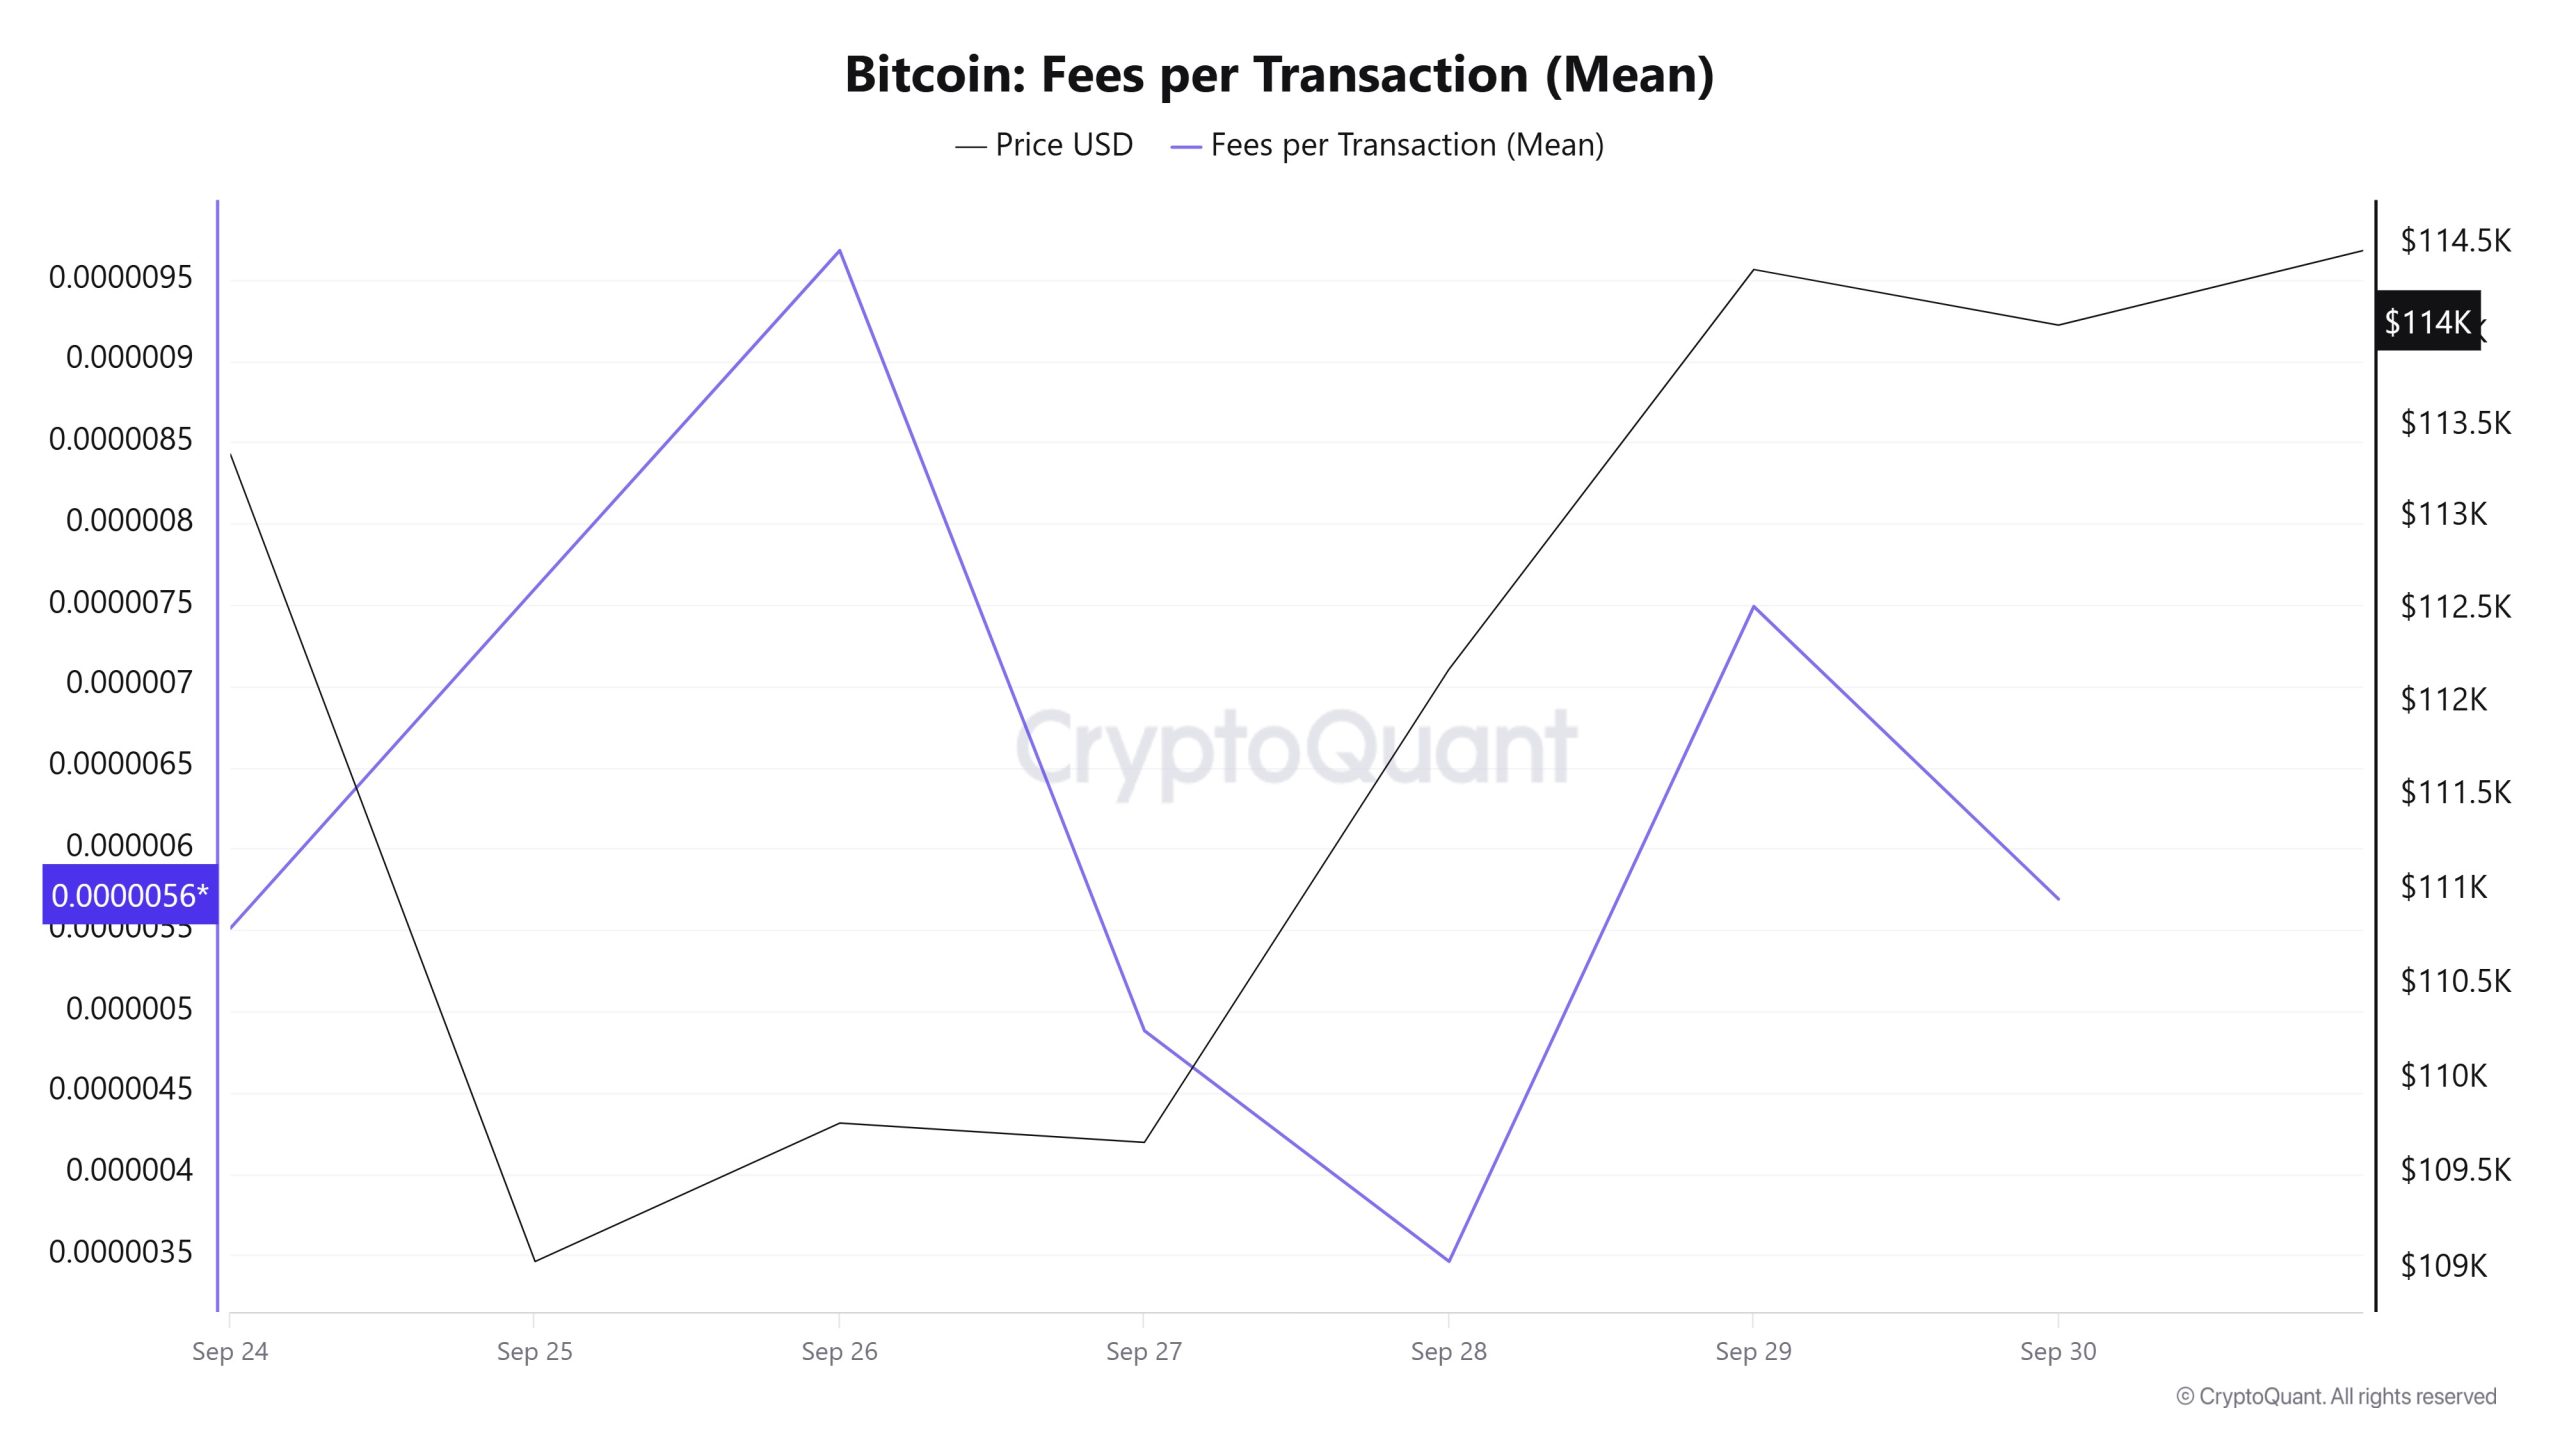
Analyzing the Bitcoin Fees per Transaction (Mean) data between September 24- 30, it is seen that the indicator was realized at 0.00000551 on September 24, the first day of the week.
As of September 26, the value peaked and fluctuated after this date due to the volatility in Bitcoin price. On September 28, it fell to 0.00000346.
In the following days, the Bitcoin Fees per Transaction (Mean) indicator resumed an upward trend, but closed at 0.00000569 on September 30, the last day of the week.
Bitcoin: Fees (Total)
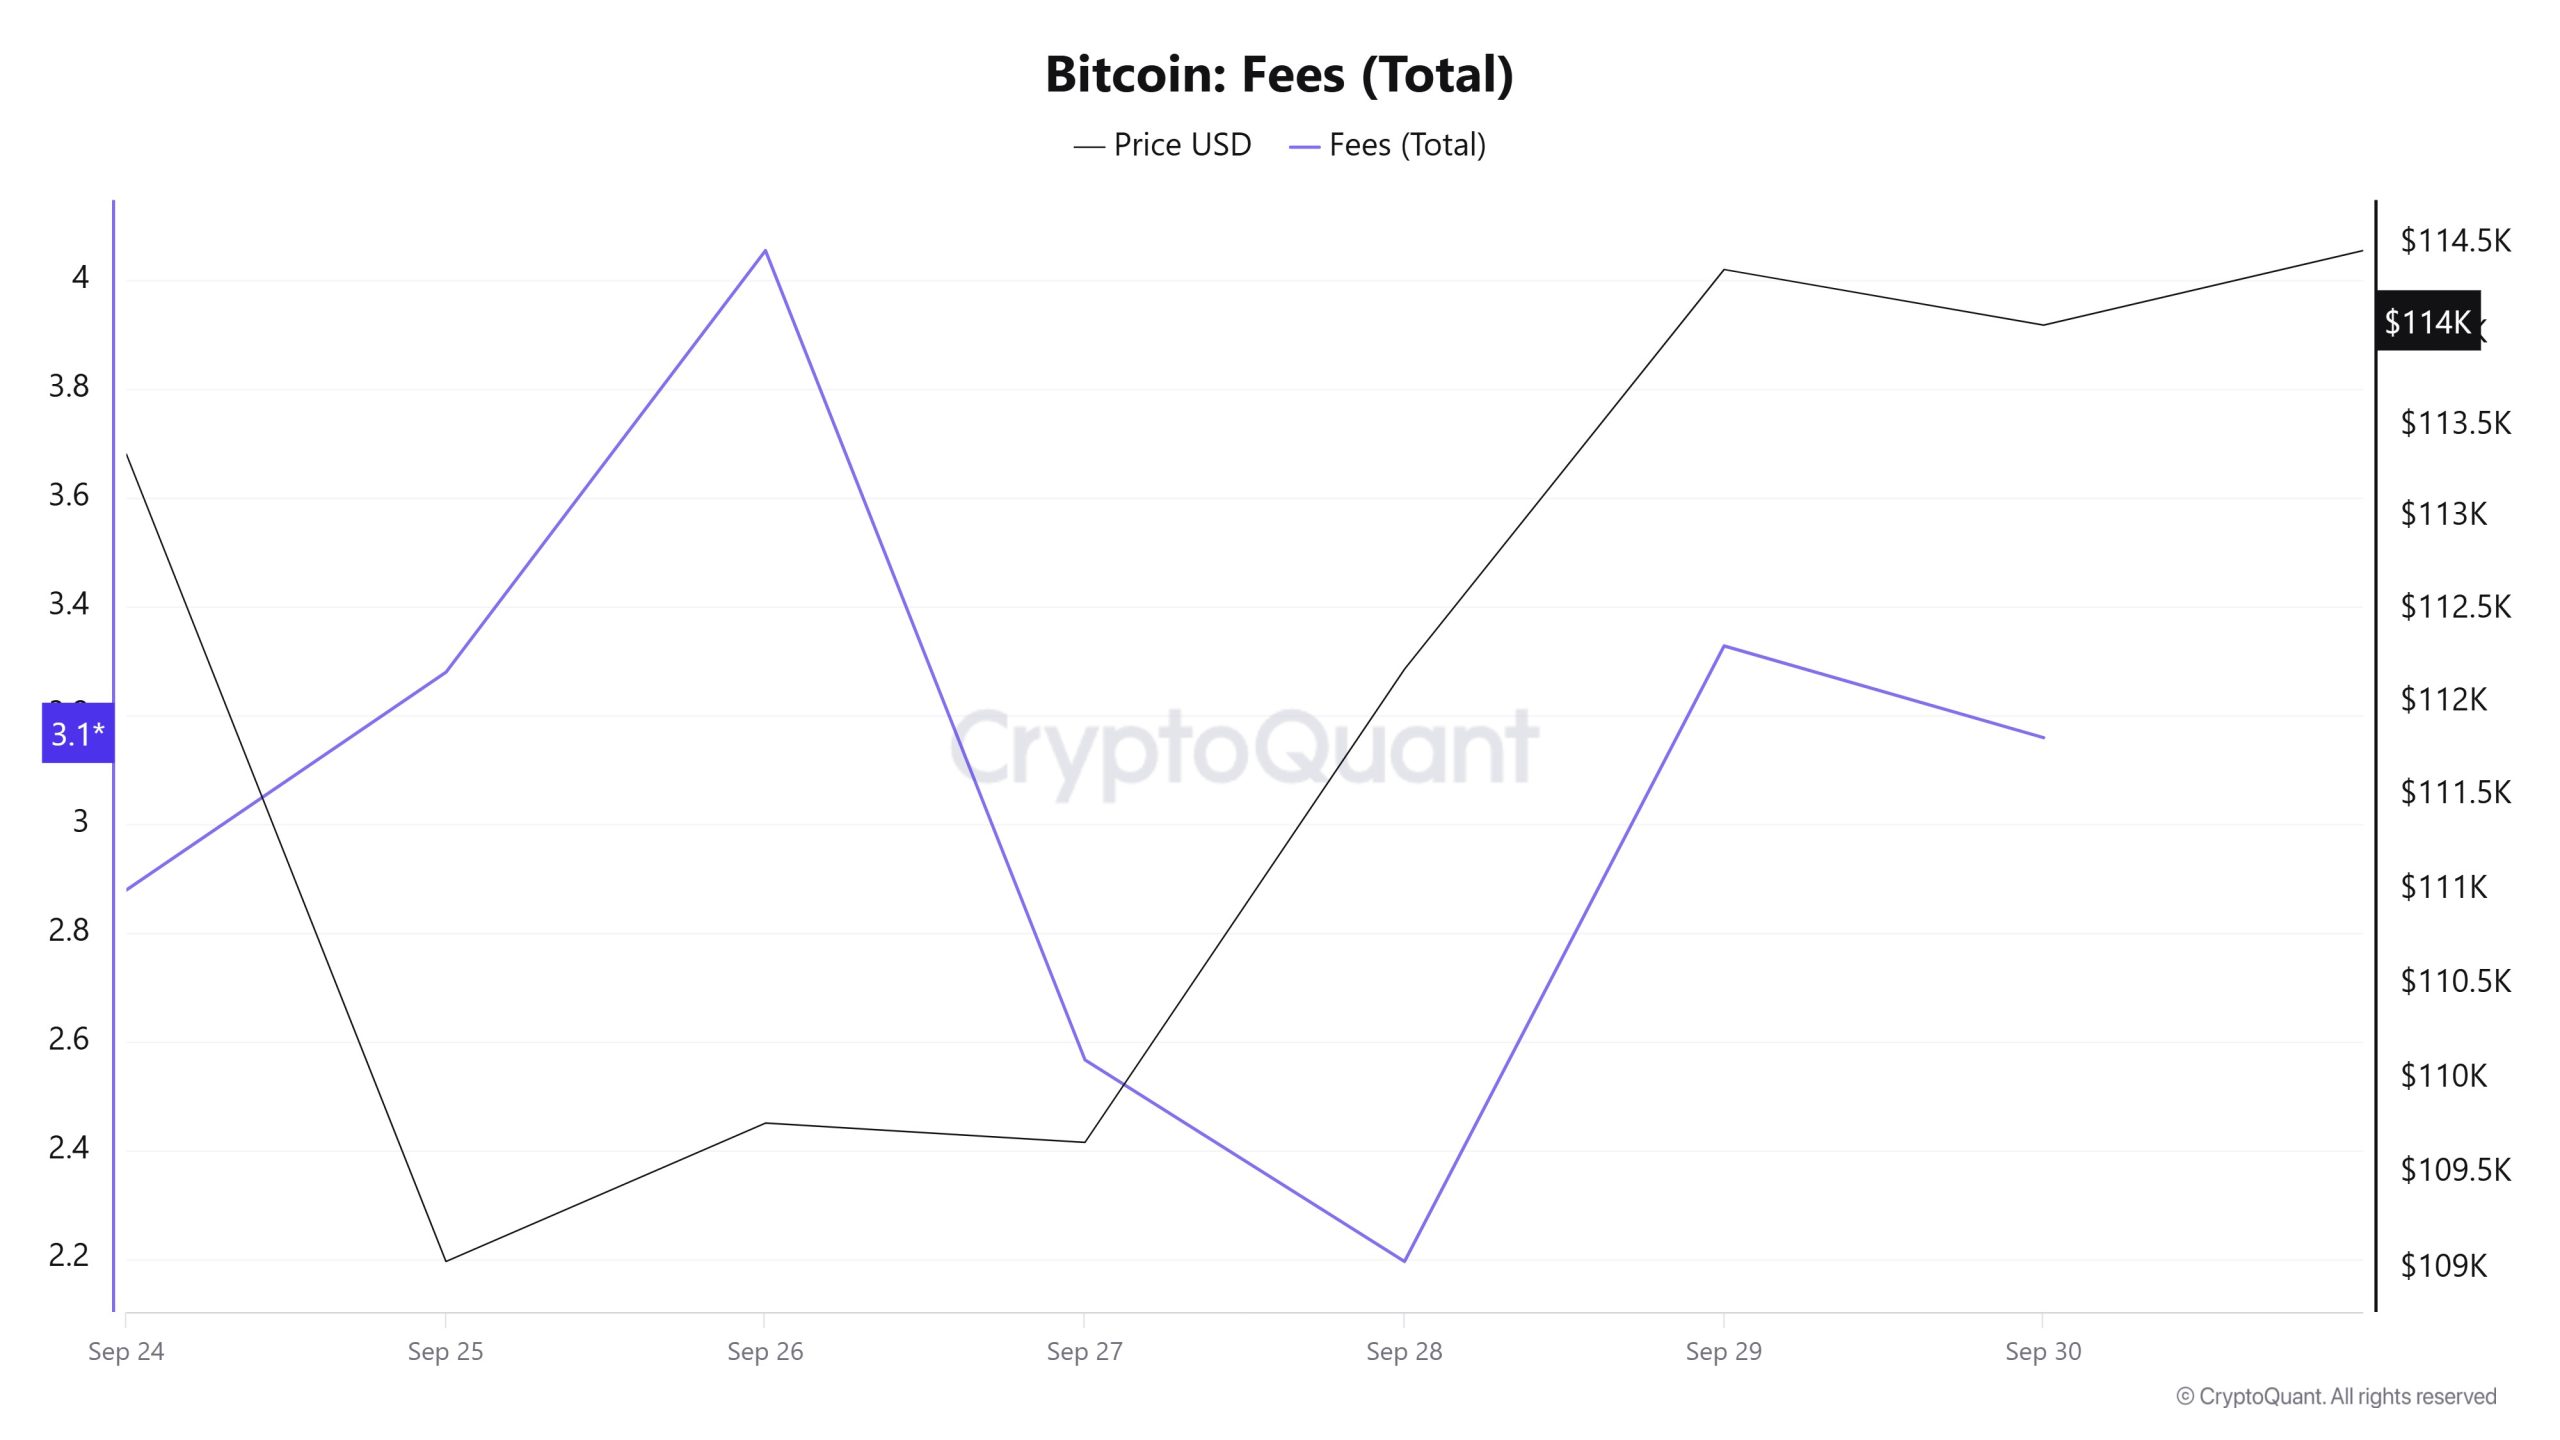
Similarly, an analysis of Bitcoin Fees (Total) data between September 24- 30 shows that the indicator was at 2.87830021 on September 24, the first day of the week.
On September 26, the value peaked, but fluctuated after this date due to the volatility in Bitcoin price. On September 28, it fell to 2.19530735.
In the following days, the Bitcoin Fees (Total) indicator resumed an upward trend, but closed at 3.15845964 on September 30, the last day of the week.
Miner Flows
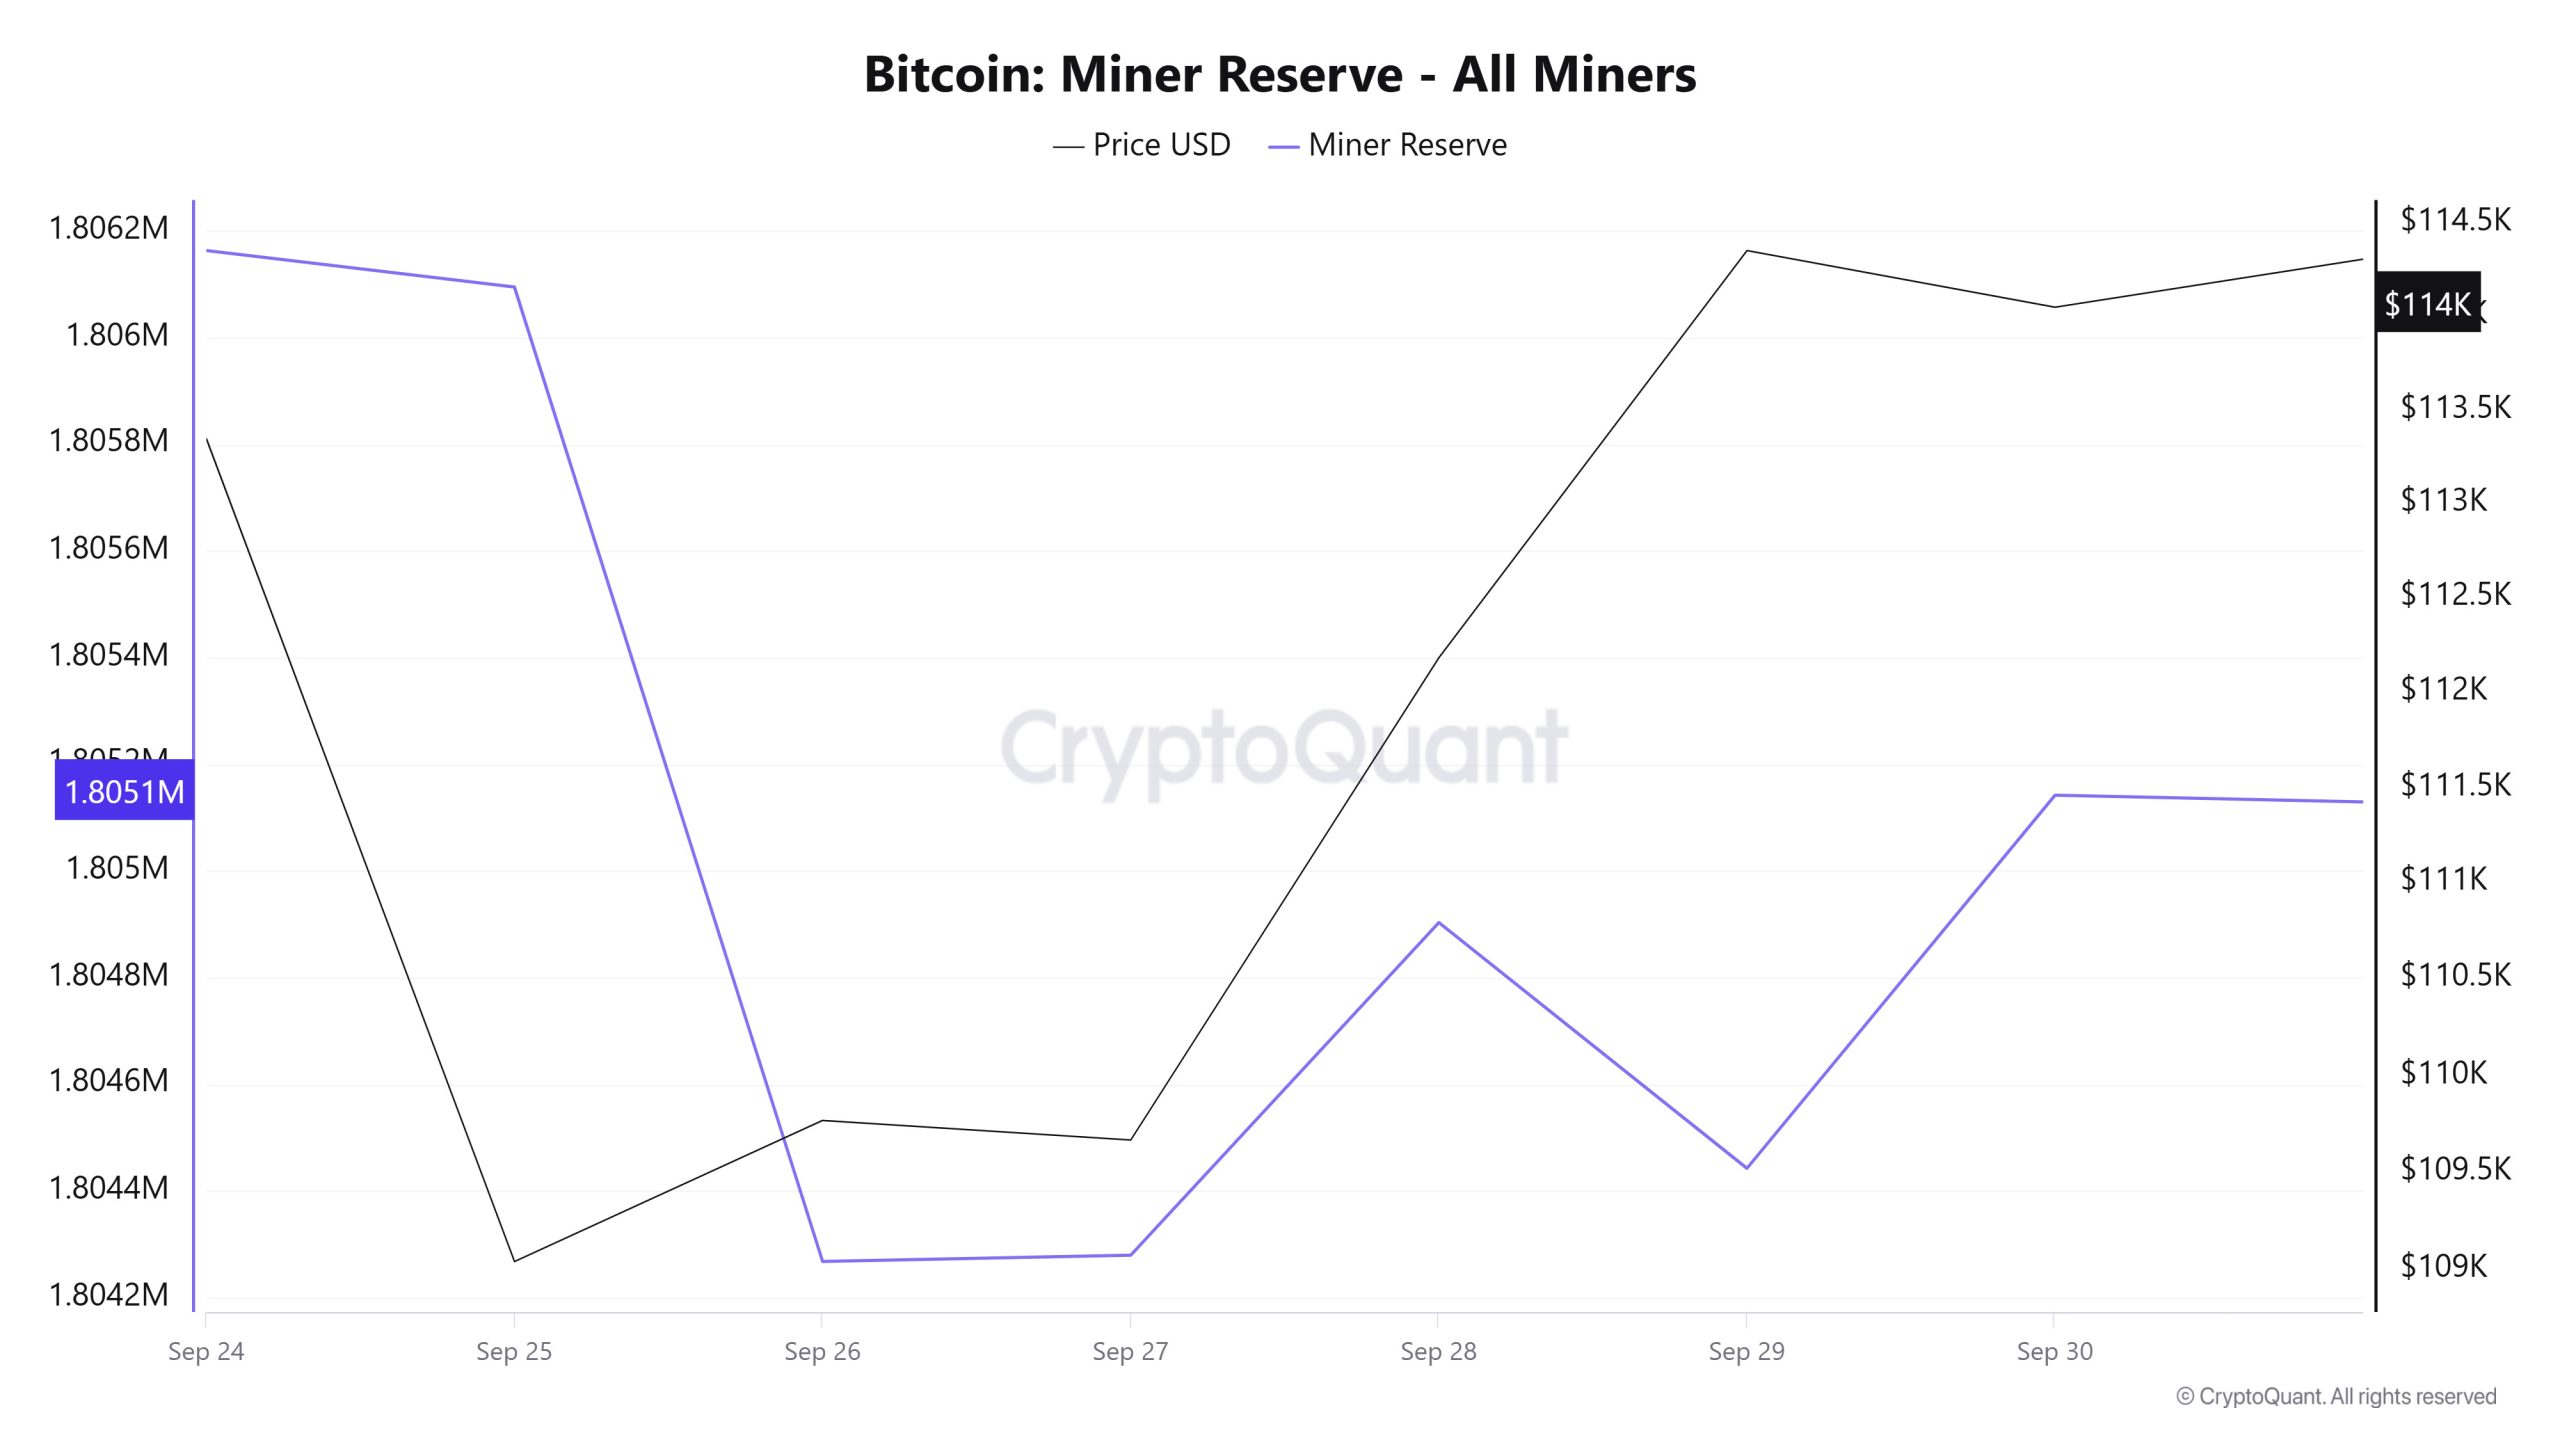
According to the data obtained from the Miner Reserve table, there has been a slight decrease in Bitcoin reserves held in miners’ wallets this week. A time-varying correlation structure was observed between Bitcoin price and miner reserve over the time period analyzed. However, the general trend.
Miner Inflow, Outflow and Netflow
Between September 24th and 30th, 45,280 Bitcoins exited miners’ wallets and 44,305 Bitcoins entered miners’ wallets between the same dates. The Miner Netflow for this week was -975 Bitcoin. Meanwhile, the Bitcoin price was $113,347 on September 24 and $114,051 on September 30.
For the week, the net flow (Miner Netflow) was negative as Bitcoin inflow into miner wallets (Miner Inflow) was less than Bitcoin outflow from miner wallets (Miner Outflow).
| Sept. 24 | Sept. 25 | Sept. 26 | Sept. 27 | Sept. 28 | Sept. 29 | Sept. 30 | |
|---|---|---|---|---|---|---|---|
| Miner Inflow | 5160.13 | 7582.09 | 8978.73 | 2992.14 | 3616.64 | 7812.71 | 8163.35 |
| Miner Outflow | 5113.31 | 7650.41 | 10805.91 | 2980.35 | 2992.91 | 8273.56 | 7463.71 |
| Miner Netflow | 46.82 | -68.32 | -1827.18 | 11.79 | 623.72 | -460.85 | 699.64 |
Transaction
![]()
While there were 3,766,767 transactions on the Bitcoin network last week, the number of transactions this week decreased by 6.18% to 3,534,053. The week’s highest transaction volume was 635,259 on September 28, while the lowest was 418,946 on September 26. While the period between September 26-28 continued with steady transaction gains, this outlook deteriorated with the pullback on September 29. The fact that the number of transactions is almost the same as last week indicates a rare situation that has not been seen for a long time. When the relationship between transaction count and price is analyzed, negative correlation seems to be dominant throughout the week.
Tokens Transferred
While a total of 4,411,723 BTC was transferred last week, this week the transfer volume increased by 8.87% to 4,803,729 BTC. The highest daily transfer volume of the week was 933,765 BTC on September 26, while the lowest transfer volume was 454,704 BTC on September 28. The correlation between the amount of tokens transferred and the price fluctuated throughout the period.
Considering the decrease in the number of transactions and the increase in the amount of tokens transferred, it can be concluded that Bitcoins changed hands more intensively during this period compared to the previous week for users who traded larger amounts.
Whale Activities
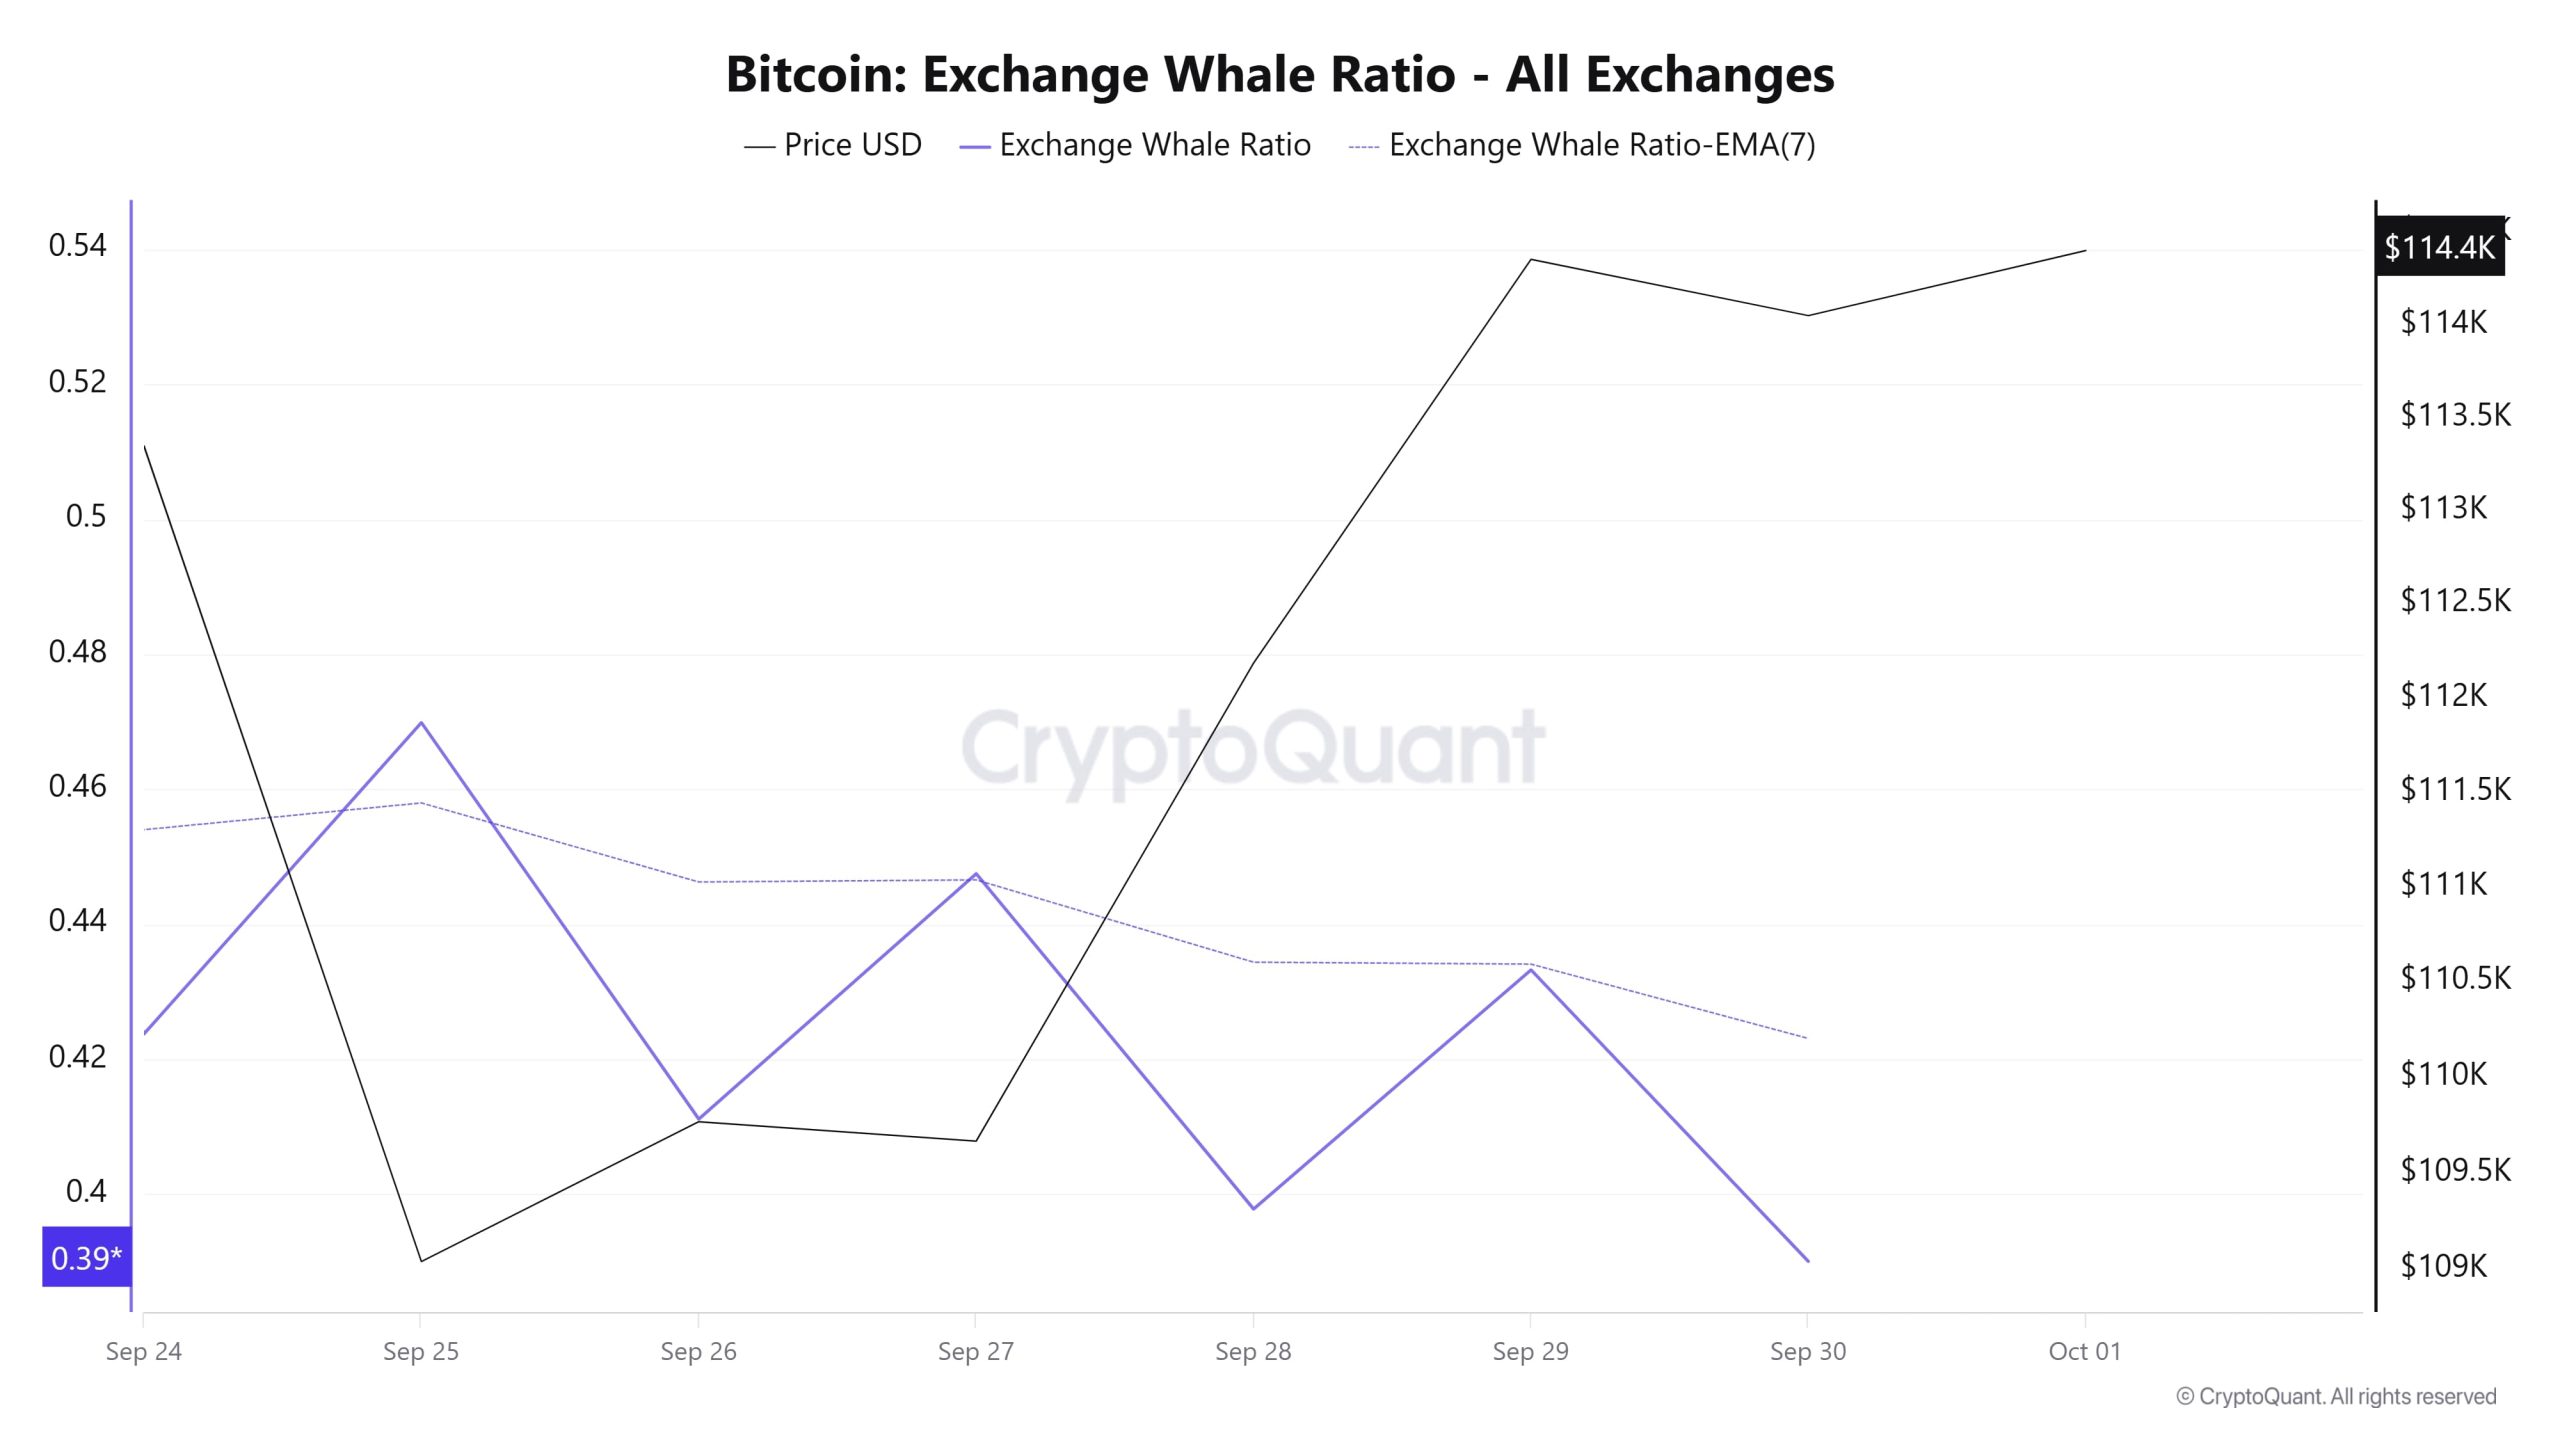
Whales Data:
Over the last 7 days, according to data from the cryptocurrency market, whale activity on centralized exchanges has declined in a narrow band from the beginning to the end of the process. When we look at the Exchange Whale Ratio metric, the rate of whales using central exchanges was 0.423 on September 24, the first day of the 7-day period. On September 25, it reached 0.469, the highest point of the process. When this ratio is above 0.35, it usually means that whales use centralized exchanges frequently. The metric, which currently has a value of 0.390, has formed the lowest point of the process. BTC is seen to have risen from 109,000 dollars to 114,400 values in this process. At the same time, it is seen that 4,803,727 BTC moved in total BTC transfer, an increase of 9% compared to last week. On-chain data revealed that large holders, who typically control more than 10,000 BTC, act as catalysts for price movements. Their movements indicate institutional sentiment and market timing, while synthetic assets such as derivatives and ETFs reinforce these dynamics. Moreover, recent reports show that large institutional investors, often referred to as “whales”, have been aggressively accumulating Bitcoin, buying over 16,000 BTC in the last week alone. As a result, it suggests that there is a potential belief among major investors that the market may be approaching a local bottom and they are positioning themselves for a future rebound.
BTC Onchain Overall
| Metric | Positive 📈 | Negative 📉 | Neutral ➖ |
|---|---|---|---|
| Active Addresses | ✓ | ||
| Breakdowns | ✓ | ||
| Derivatives | ✓ | ||
| Supply Distribution | ✓ | ||
| Exchange Supply Ratio | ✓ | ||
| Exchange Reserve | ✓ | ||
| Fees and Revenues | ✓ | ||
| Miner Flows | ✓ | ||
| Transaction | ✓ | ||
| Whale Activities | ✓ |
*The metrics and guidance in the table do not, in and of themselves, describe or imply an expectation of future price changes for any asset. The prices of digital assets may vary depending on many different variables. The onchain analysis and related guidance are intended to assist investors in their decision-making process, and making financial investments based solely on the results of this analysis may result in harmful transactions. Even if all metrics produce a positive, negative or neutral result at the same time, the expected results may not be seen according to market conditions. Investors reviewing the report would be well advised to heed these caveats.
Legal Notice
The investment information, comments and recommendations contained in this document do not constitute investment advisory services. Investment advisory services are provided by authorized institutions on a personal basis, taking into account the risk and return preferences of individuals. The comments and recommendations contained in this document are of a general type. These recommendations may not be suitable for your financial situation and risk and return preferences. Therefore, making an investment decision based solely on the information contained in this document may not result in results that are in line with your expectations.
NOTE: All data used in Bitcoin onchain analysis is based on Cryptoqaunt.