
Technical Analysis
BTC/USDT
Although US non-farm payrolls exceeded expectations, downward revisions to previous months and the unemployment rate rising to 4.6% indicate increasing momentum loss on the employment front. Indeed, while there has been no change in the Fed’s January interest rate cut path, the weakening of the dollar index in the short term has drawn attention. Additionally, Treasury Secretary Bessent’s inflation assessments for 2026 point to continued uncertainty in the markets regarding the interest rate path.
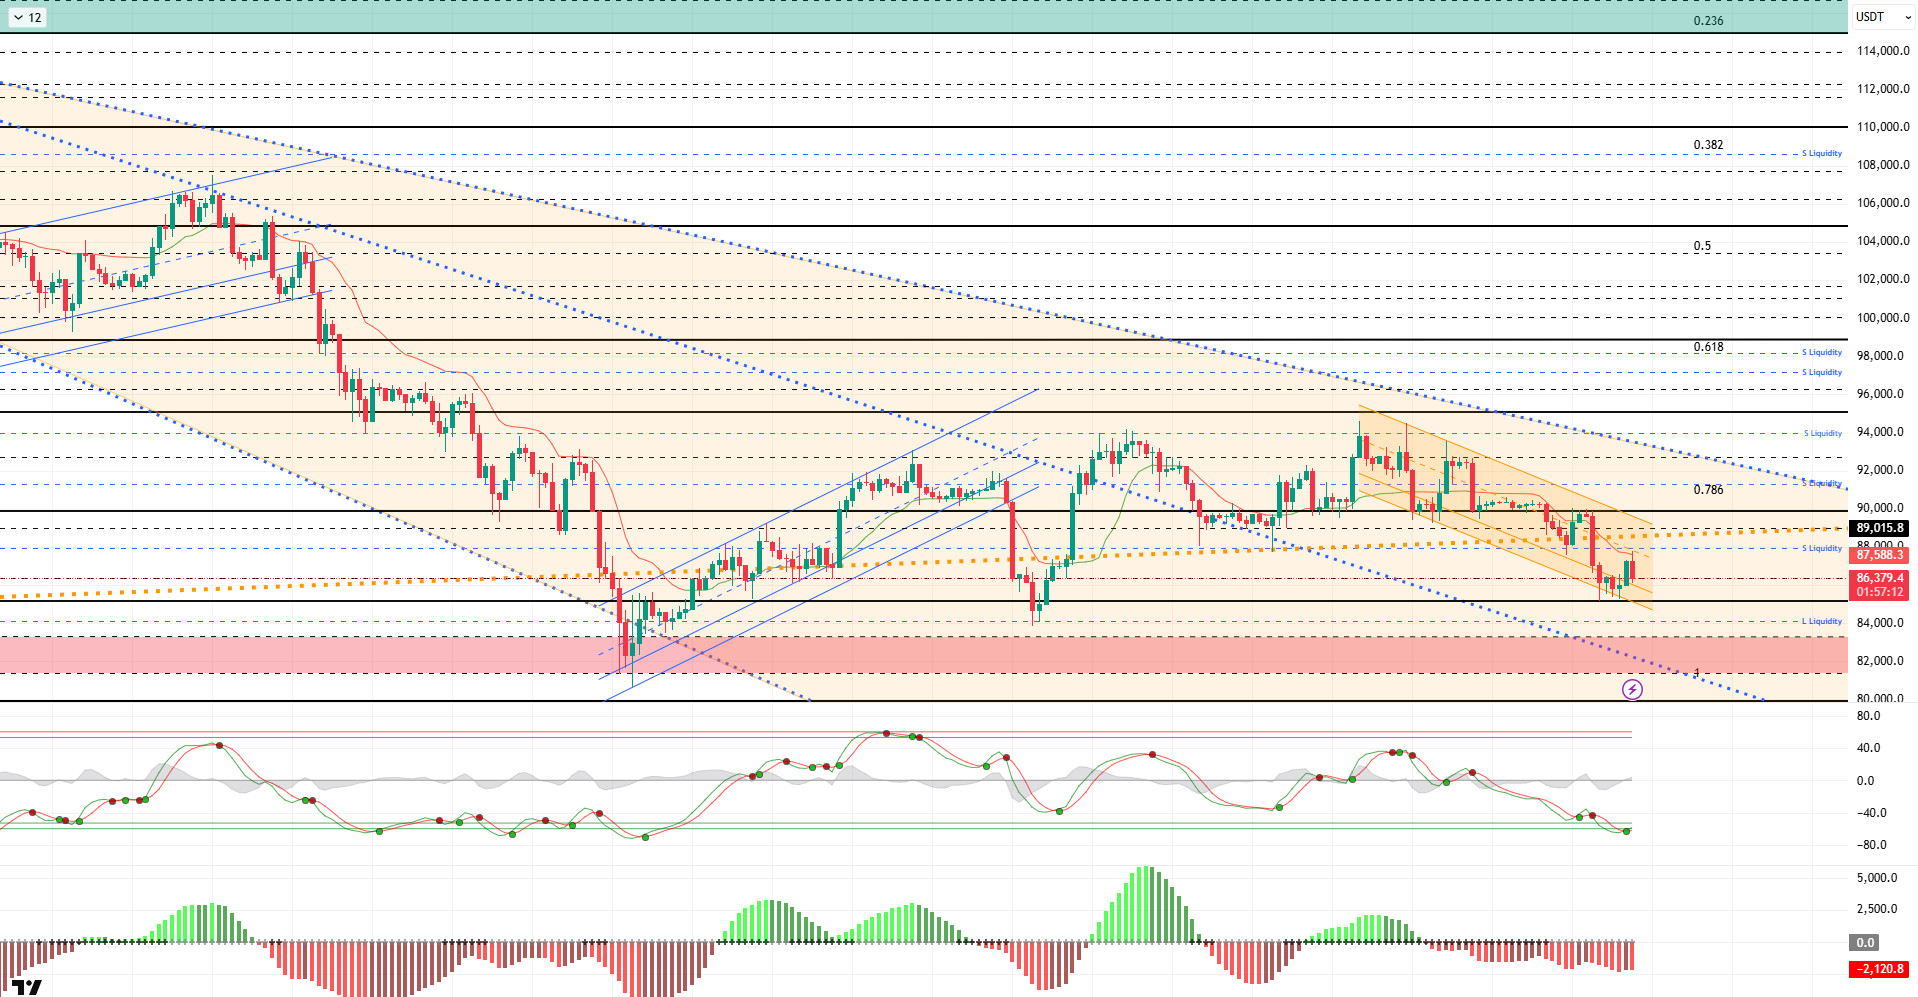
From a technical perspective, BTC gained some momentum within the downtrend channel compared to the previous analysis and tested the 87,800 level. After touching the middle band of the channel, the price retreated slightly and sought equilibrium around the 87,000 level. Continuing to trade below the major uptrend, BTC’s closes above the 88,000 level could be decisive for renewed upward movements.
Technical indicators show the Wave Trend (WT) oscillator has returned to a buy signal in the oversold zone. The histogram on the Squeeze Momentum (SM) indicator is attempting to gain momentum once again within the negative zone. The Kaufman Moving Average (KAMA) is currently trading above the price at the $87,600 level.
When examining liquidation data, the entire partial purchase tier opened on a monthly basis in the 85,000–90,000 range was liquidated, while the short-term sales tier also resulted in liquidation at the 87,800 level. Over a broader time frame, the sales tier continues above the 90,000 level.
In summary, while data on the US labor market presents a mixed picture and does not provide a clear directional signal, the Fed appears to have maintained its current stance in its January interest rate decision. However, Treasury Secretary Bessent indicated that the new Fed chair could be announced in January and stated that a gradual improvement in inflation could begin. It is understood that Trump is actively evaluating the selection process for the new Fed chair, with Hassett and Warsh emerging as the leading candidates. Technically, BTC, which retreated to the 80,500 level following the decline after its all-time high (ATH), rebounded strongly from this area. Subsequently, the price settled above the 90,000 level and entered a consolidation phase for a while, then retreated again, falling below the major uptrend line and testing the 85,000 level. When liquidity data is examined, it is seen that areas with concentrated short-term trading are being targeted, while long-term sell orders have not yet been tested. After this stage, the 85,000 level has become a critical point for the price to maintain its momentum. Closings and pricing above this level are an important indicator for regaining momentum. In this context, 88,000 stands out as the next target area, and liquidity areas will be monitored again if it is passed. In the event of potential selling pressure, the 85,000 level will be monitored as the last obstacle preventing the price from forming a double bottom at the 80,000 level.
Support levels: 85,000 – 84,100 – 83,300
Resistances: 86,400 – 88,000 – 89,000
ETH/USDT
As we enter the evening hours on the ETH front, we see that the weak structure has been maintained following a volatile intraday trend. The recovery that reached $2,980 levels during the day gave way to renewed selling pressure with the release of US non-farm payrolls data, which came in at 64,000, above expectations, and the price retreated to the $2,920 level. These sell-offs following the macro data reveal that upward moves remain fragile and buyers are struggling to keep the price higher.
The liquidity picture remains unchanged as of this evening. The Chaikin Money Flow (CMF) indicator continues to stay below the zero line and fails to produce a meaningful upward breakout. The persistence of low liquidity inflows clearly explains why intraday attempts to rally have failed to gain traction. As capital inflows into the market remain weak, selling pressure continues to exert its influence on prices.
There is no significant improvement on the momentum front either. The Relative Strength Index (RSI) maintains its weak appearance, as seen in the morning analysis, and remains close to the oversold zone. This structure in the RSI indicates that buyers have not yet been able to take control of momentum and that upward movements may remain limited. Even if short-term rebound attempts occur, the lack of momentum makes it difficult for these moves to be sustained.
Intraday price action confirms that the fragile technical structure persists, while showing that selling pressure has become more pronounced, especially after the data release. As of this evening, the price is still hovering near the critical support zone, and the liquidity and momentum conditions necessary for an upward surge have not yet materialized.
The main scenario remains unchanged in the current outlook. If the $2,910 level cannot be maintained, downward pressure is likely to increase, and the price may retreat towards the $2,722 region. For an upward recovery to become more meaningful, the price needs to reclaim the $3,019 level and be supported by a clear improvement in liquidity. As of the evening hours, the picture suggests that risks on the ETH side remain downward and a cautious stance should be maintained.
Supports: 2,910 – 2,727 – 2,625
Resistances: 3,019 – 3,074 – 3,227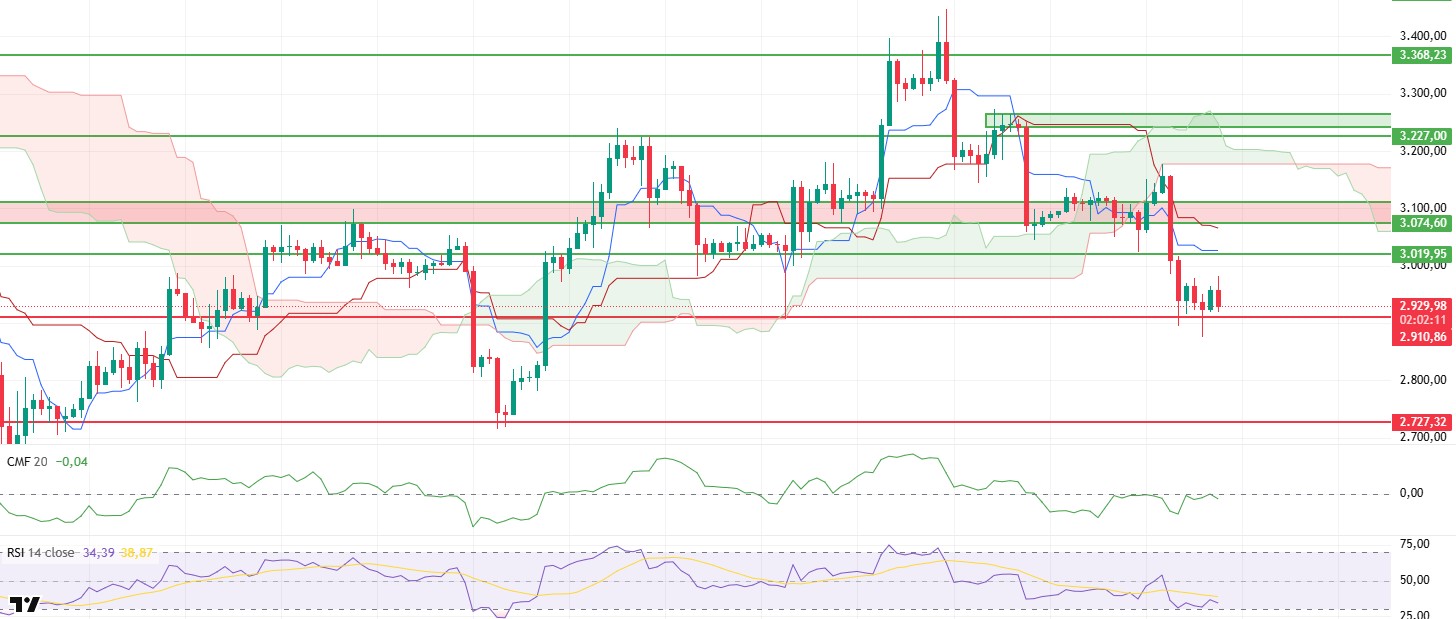
XRP/USDT
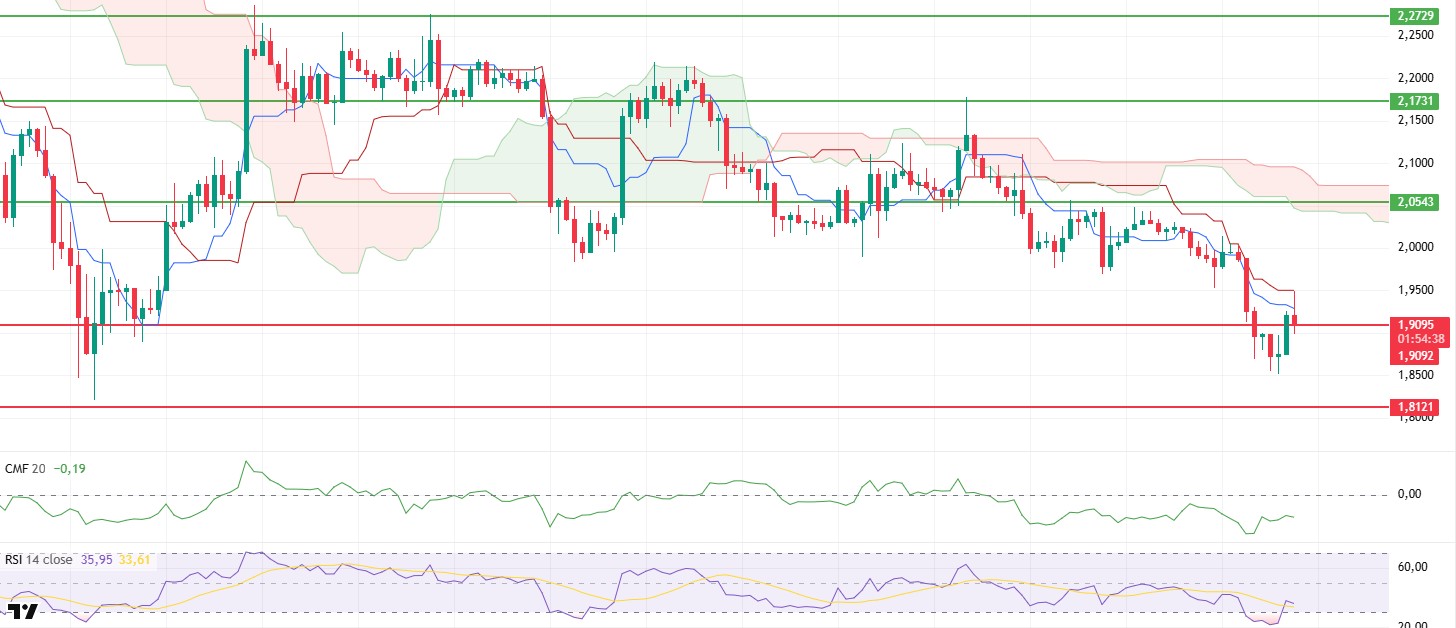
As we enter the evening hours on the XRP side, the weak structure appears to be holding after intraday fluctuations. The recovery attempt that reached the $1.94 level during the day was not sustainable, and the price, unable to find liquidity support, retreated again, falling back to the $1.90 support level. The short-lived upward move indicates that the downward trend has not yet been broken and that buyers remain limited.
The picture seen throughout the day on the liquidity front was decisive. The Chaikin Money Flow (CMF) indicator failing to produce a capital inflow that would confirm an upward movement clearly revealed why the upward attempt could not be sustained. As the intraday rise was not supported by liquidity, selling pressure gained momentum again and the price resumed its downward trend. The CMF remaining in negative territory indicates that the market is still risk-averse.
There has been no significant improvement on the momentum front either. The Relative Strength Index (RSI) remains weak despite the short-term rebound, reflecting the inability of buyers to generate sustained momentum. The RSI’s failure to produce a strong recovery supports why upward attempts remain fragile.
The trend outlook hasn’t changed much on the Ichimoku indicator either. The price remains below the kumo cloud, and the Tenkan and Kijun levels haven’t been broken during the day’s trading. The technical setup confirms that the downtrend is still valid as of this evening and that upward moves lack structural support.
In the current pricing, the $1.90 level remains central in terms of short-term direction. If sustainability can be achieved above this region, limited rebound rallies may come into play. However, if the price weakens again below this support, it could lead to continued downward pressure and target lower levels. As of the evening outlook, the technical structure, liquidity situation, and momentum indicators continue to show that downside risks are still dominant for XRP.
Supports: 1.9092 – 1.8121 – 1.6224
Resistances: 2.0543 – 2.1731 – 2.2729
SOL/USDT
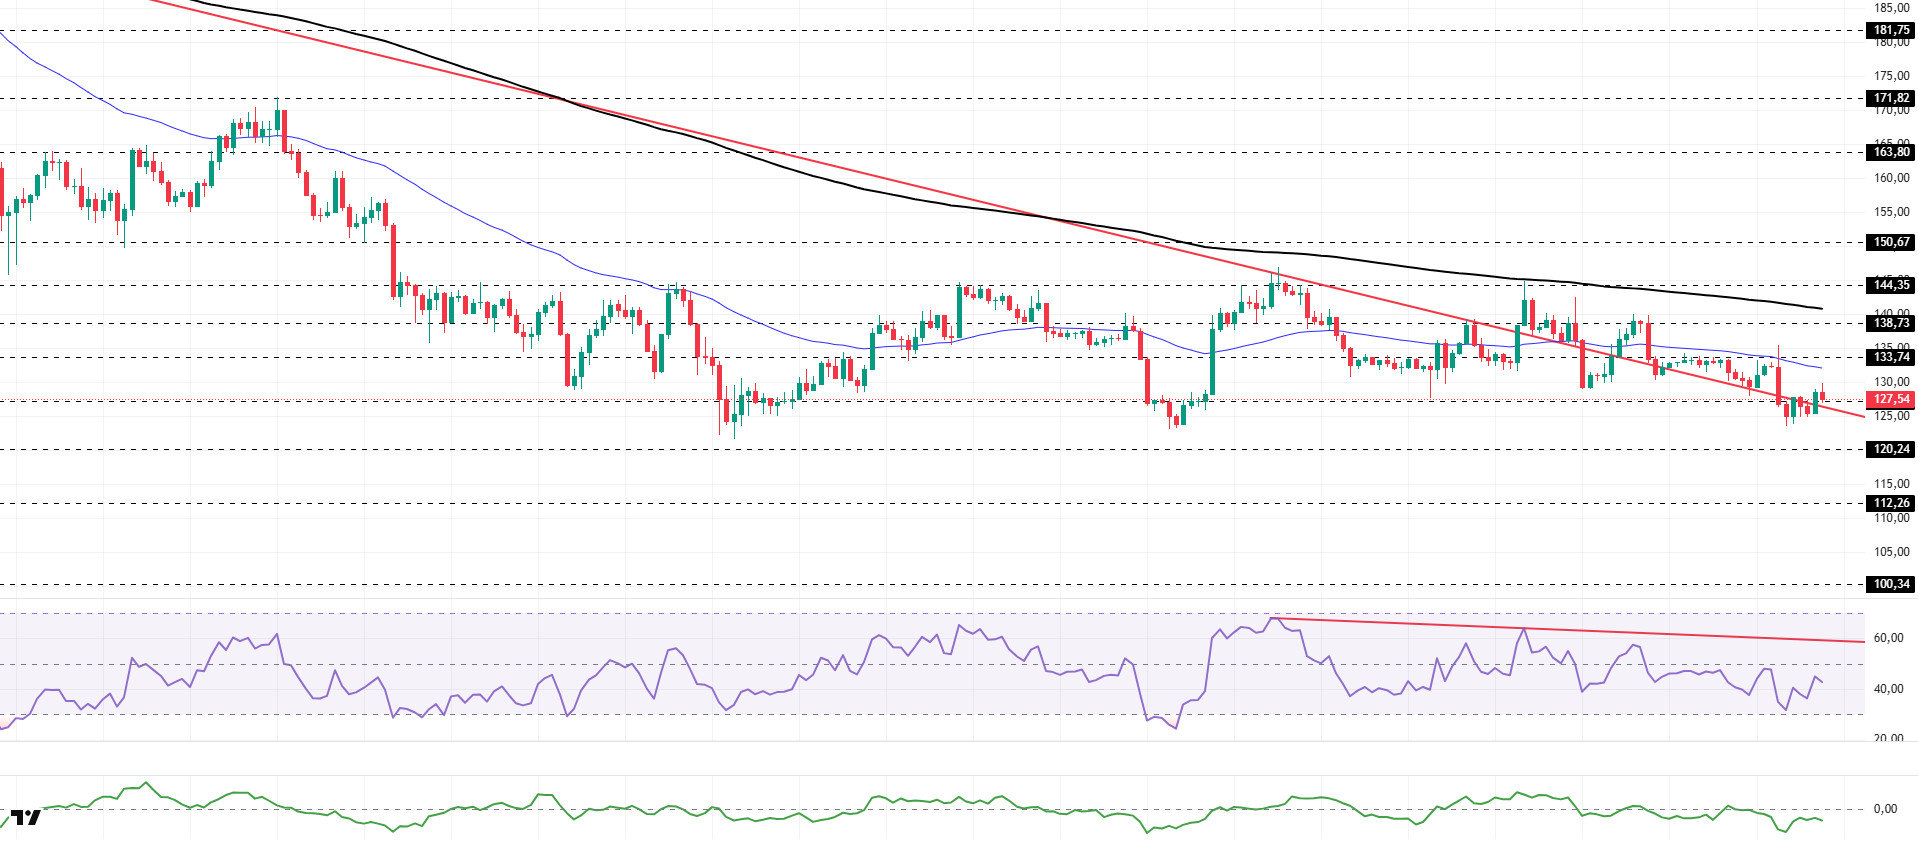
SOL price showed an upward trend during the day. The asset moved into the upper region of the downward trend that began on October 6. Currently trading in a narrow band between the downward trend line and the 50 EMA (Blue Line) moving average, the asset may test the 50 EMA moving average as resistance if it experiences an uptrend. In the event of a pullback, the $120.24 level could be monitored.
On the 4-hour chart, it remained below the 50 EMA (Exponential Moving Average – Blue Line) and 200 EMA (Black Line). This indicates that it may be in a downtrend in the medium term. At the same time, the price being below both moving averages indicates that the asset is trending downward in the short term. The Chaikin Money Flow (CMF-20) is in negative territory. However, balanced cash inflows and outflows may keep the CMF in negative territory. The Relative Strength Index (RSI-14) remained in the middle of negative territory. It also continued to stay below the downward trend line that began on December 3. This signaled selling pressure. In the event of an uptrend driven by macroeconomic data or positive news related to the Solana ecosystem, the $144.35 level stands out as a strong resistance point. If this level is broken upwards, the uptrend is expected to continue. In the event of pullbacks due to developments in the opposite direction or profit-taking, the $120.24 level could be tested. A decline to these support levels could increase buying momentum, presenting a potential opportunity for an upward move.
Supports: 127.21 – 120.24 – 112.26
Resistances: 133.74 – 138.73 – 144.35
DOGE/USDT
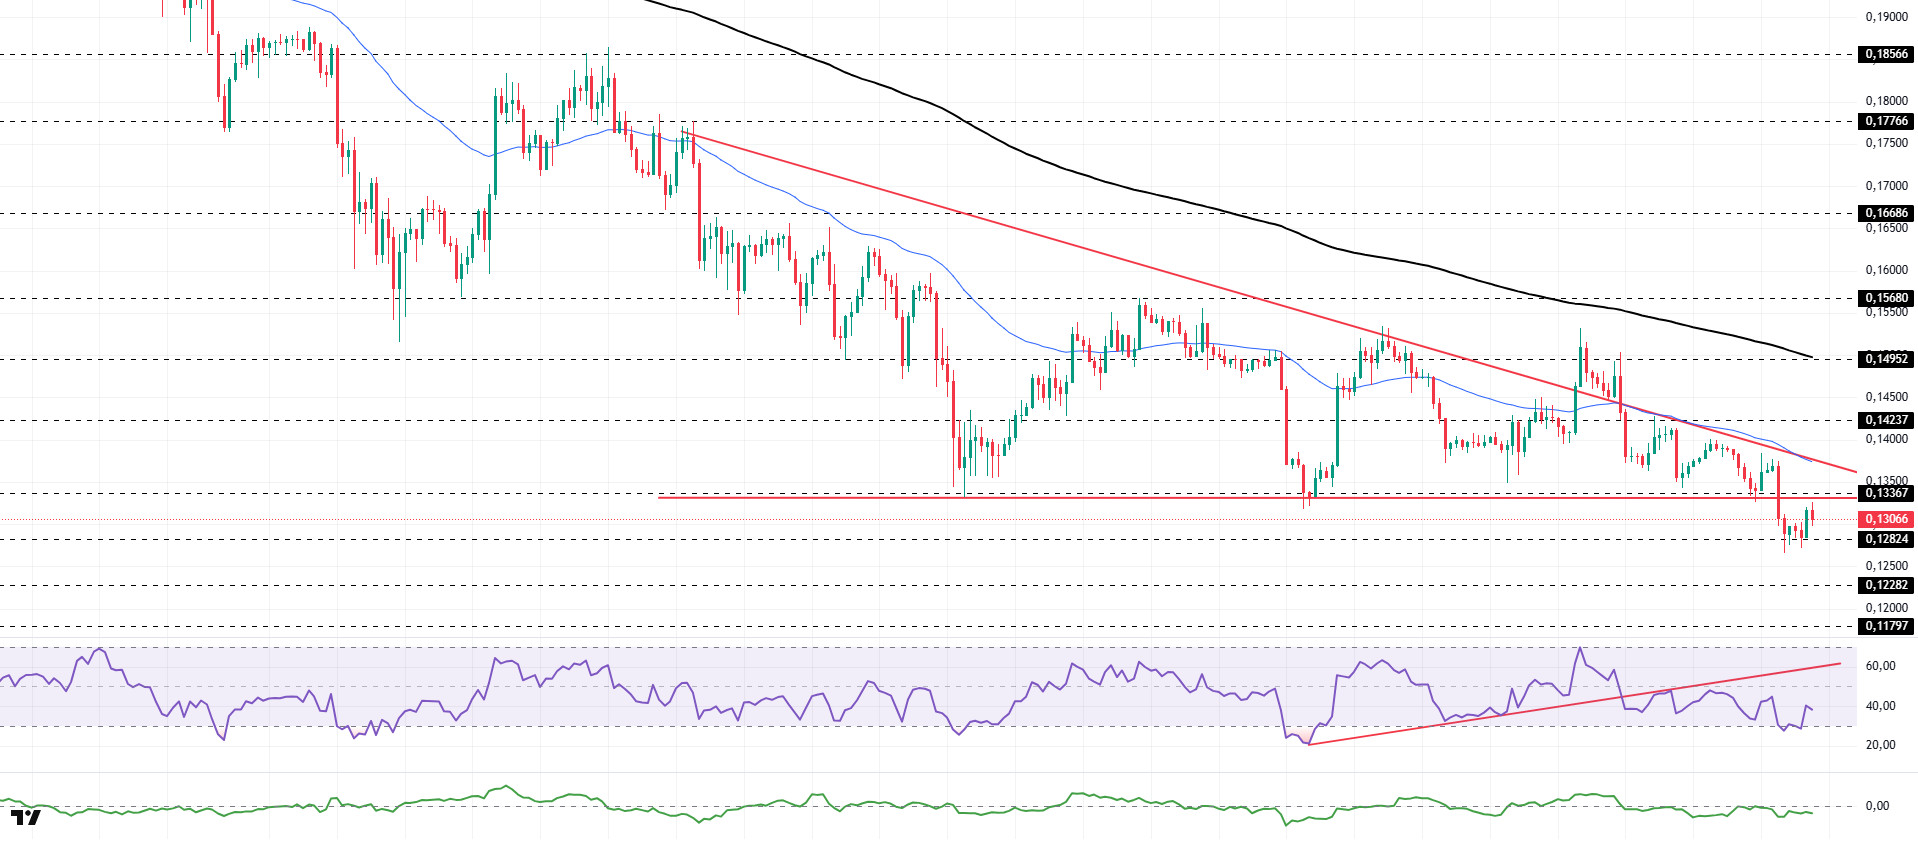
DOGE price during the day. The asset experienced a pullback by breaking below the base level of the descending triangle formation that began on November 13. Currently showing a slight increase, the price tested the base level of the descending triangle formation, which is a strong resistance level, and is experiencing a slight pullback. If the pullback continues, it may test the $0.12282 level as support. If it experiences an uptrend, it may test the 50 EMA (Blue Line) moving average or the top level of the descending triangle formation as resistance.
On the 4-hour chart, the 50 EMA (Exponential Moving Average – Blue Line) remained below the 200 EMA (Black Line). This indicates that the downtrend may continue in the medium term. The price being below both moving averages suggests a downward trend in the short term. The Chaikin Money Flow (CMF-20) remained in negative territory. Additionally, the balance of money inflows and outflows may keep the CMF in negative territory. The Relative Strength Index (RSI-14) rose from the oversold level in negative territory to the middle of the negative zone. At the same time, it remained below the upward trend that began on December 1. In the event of an uptrend driven by political developments, macroeconomic data, or positive news flow in the DOGE ecosystem, the $0.14952 level stands out as a strong resistance zone. Conversely, in the event of negative news flow, the $0.11797 level could be triggered. A decline to these levels could increase momentum and initiate a new wave of growth.
Supports: 0.12824 – 0.12282 – 0.11797
Resistances: 0.13367 – 0.14237 – 0.14952
LTC/USDT
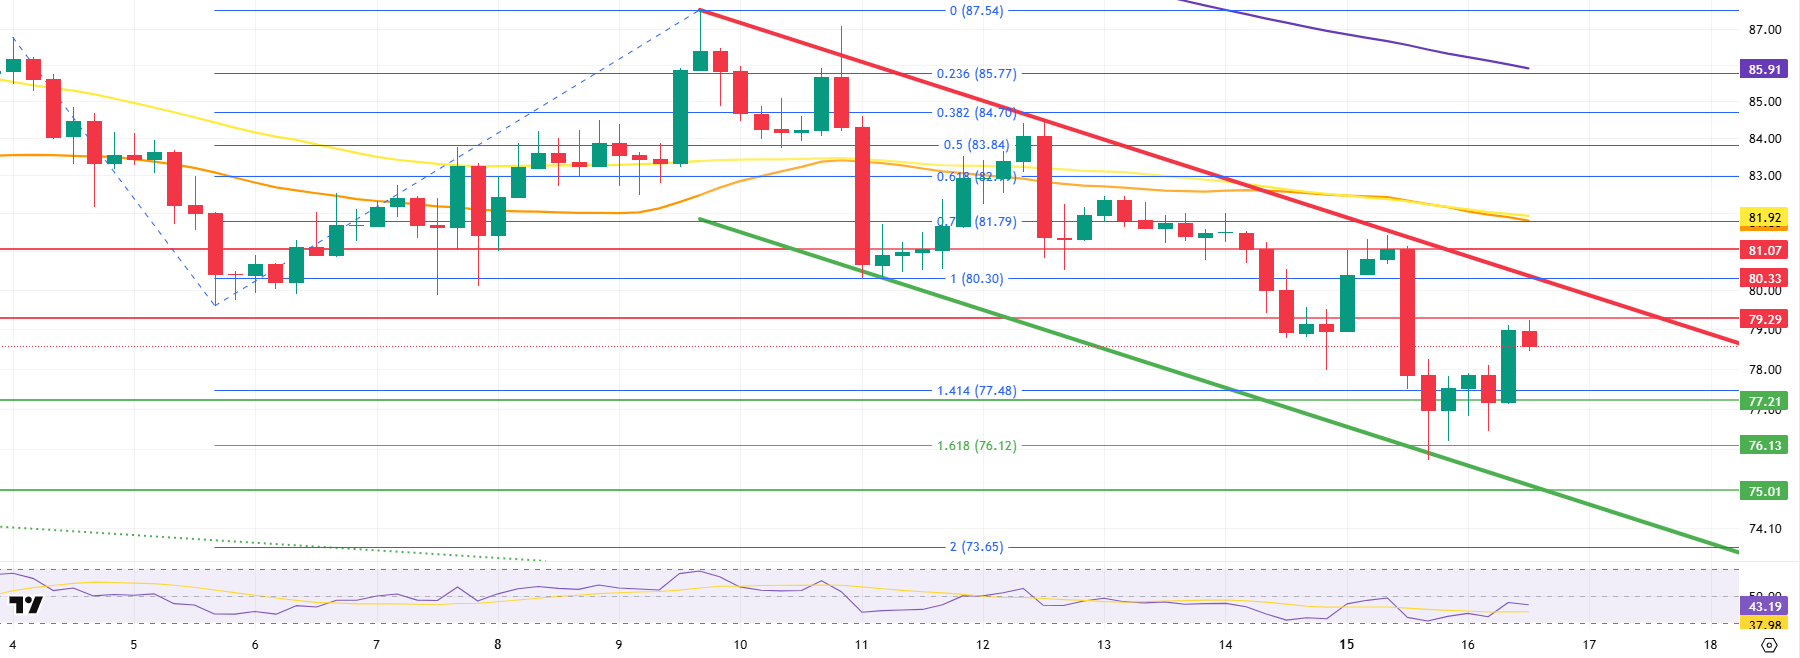
The price movements in the Litecoin (LTC) / USDT pair advanced to the 78.29 level with a 1.14% increase in value during the day. At the same time, LTC’s 0.11% increase compared to Bitcoin shows that LTC increased its own value independently of Bitcoin, in addition to the movement that occurred on the Bitcoin side. In the futures market, the ratio of long/short positions opened in the last 24 hours increased from 0.9153 to 0.9205, indicating that although bearish expectations among derivatives market participants remain dominant, they have decreased compared to the morning. Funding rates are neutral.
When examining Litecoin’s 4-hour USDT pair, it is observed that the price continues to remain below the 200, 100, and 50-period (purple, yellow, and orange) moving averages. This outlook confirms that the main directional expectation remains downward, along with short positions dominating the derivatives markets. However, within the current structure, rebound rallies remain a possibility.
In possible rebound movements, the 79.29 level stands out as an area that could encounter strong selling pressure in the first stage. If this level is exceeded, 80.33 is a critical resistance level for the upward movement, as it is the current point where the upper band of the descending channel passes. A break above this region could be seen as the first strong signal that the downward trend structure is weakening. While a move towards the 81.07 level is possible thereafter, the retest of the broken trend at this point could bring short positions back into focus.
If the downward scenario persists and a pullback in line with expectations occurs, the first support level to watch for a horizontal move is 77.21. If selling pressure continues, the Fibonacci 1.618 support level based on the trend may be retested, which is located at 76.13. If this region proves insufficient, the 75.01 level stands out as a critical area where strong buying reactions could be seen and long position ratios could increase, due to its proximity to both horizontal support and the lower band of the descending channel.
Supports: 77.21 – 76.13 – 75.01
Resistances: 79.29 – 80.33 – 81.07
Legal Notice
The investment information, comments, and recommendations contained herein do not constitute investment advice. Investment advisory services are provided individually by authorized institutions taking into account the risk and return preferences of individuals. The comments and recommendations contained herein are of a general nature. These recommendations may not be suitable for your financial situation and risk and return preferences. Therefore, making an investment decision based solely on the information contained herein may not produce results in line with your expectations.

