
Technical Analysis
BTC/USDT
Cautious messages from the Fed continue to shape the outlook for monetary policy and market liquidity as we approach the end of the year. While assessments of the balance between inflation and employment continue, the Fed’s support of market functioning through bond and repo tools is being closely monitored in terms of financial conditions. Despite the low volatility outlook in crypto markets during the same period, increased positioning in derivatives trading points to a scenario where price movements could accelerate in the short term.
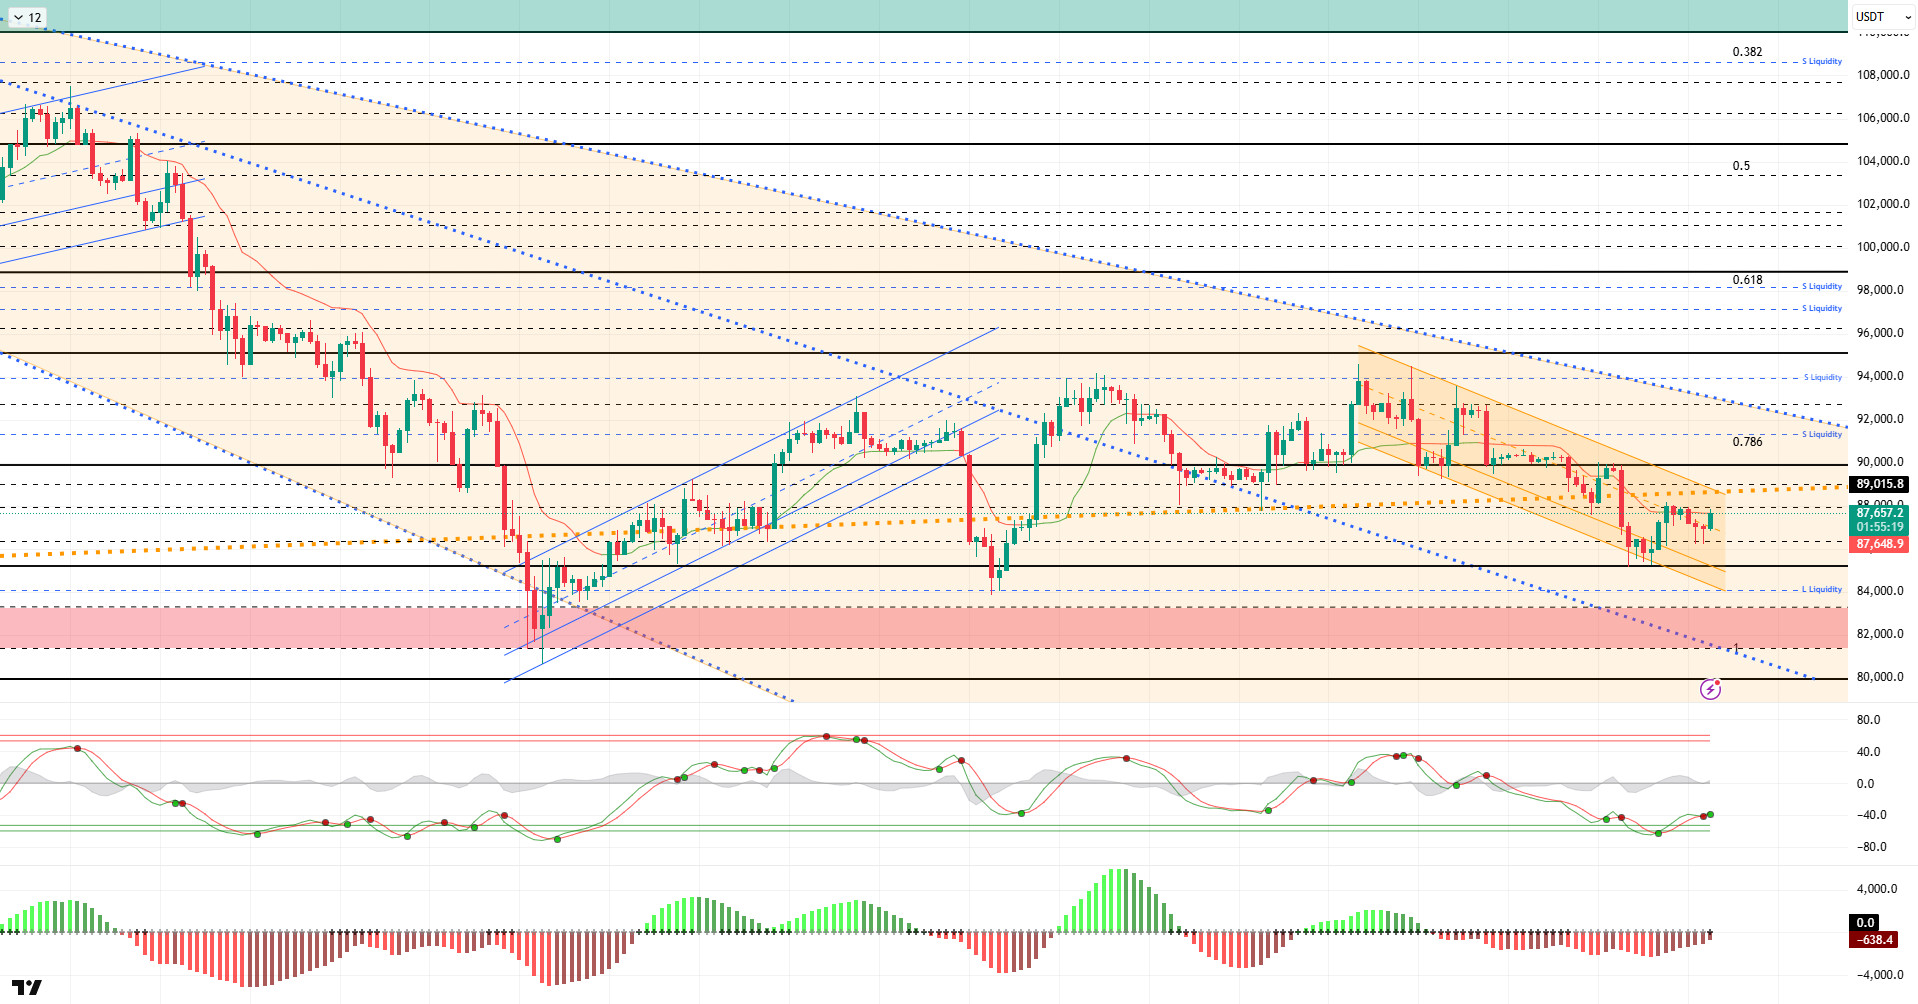
From a technical perspective, BTC continues to move within a descending trend channel, exhibiting some volatility during the day. In the previous analysis, BTC, trading at the 86,000 level, tested the 87,700 level by pushing the channel’s middle band. At the time of writing, the price, which has retreated slightly, continues to trade at the 87,500 level.
Technical indicators show that the Wave Trend (WT) oscillator gave a sell signal just above the oversold zone, but with the latest movement, it gave a buy signal again. The histogram on the Squeeze Momentum (SM) indicator is attempting to gain momentum once more within the negative zone. The Kaufman Moving Average (KAMA) is currently moving above the price at the $87,640 level.
Looking at liquidation data, the short-term sell order book is concentrated in the $88,000 range, while the buy order book is concentrated around $85,000. In the long term, fragmented concentration continues above the $90,000 level.
In summary, while the US economy remains stuck between labor and inflation, Fed member Waller left the door open for cuts with a cautious approach. On the other hand, the US signaled that it would ease tariffs on certain goods following the conclusion of the trade agreement. Technically, BTC retreated to the 80,500 level following the downtrend that formed after the ATH, but rebounded strongly from this area. Subsequently, the price settled above the 90,000 level and entered a consolidation phase for a while, then retreated again, falling below the major uptrend line and testing the 85,000 level. An examination of liquidity data reveals that areas with concentrated short-term trading have been targeted, while long-term sell orders have yet to be tested. At this stage, the 85,000 level has become critical for the price to maintain its momentum. Closes and pricing above this level are an important indicator for regaining momentum. In this context, 88,000 stands out as the next target area, and if it is passed, liquidity areas will be monitored again. In the event of a possible selling pressure, the 85,000 level will be monitored as the last obstacle to the price forming a double bottom at the 80,000 level.
Supports: 85,000 – 84,100 – 83,300
Resistances: 86,400 – 88,000 – 89,000
ETH/USDT
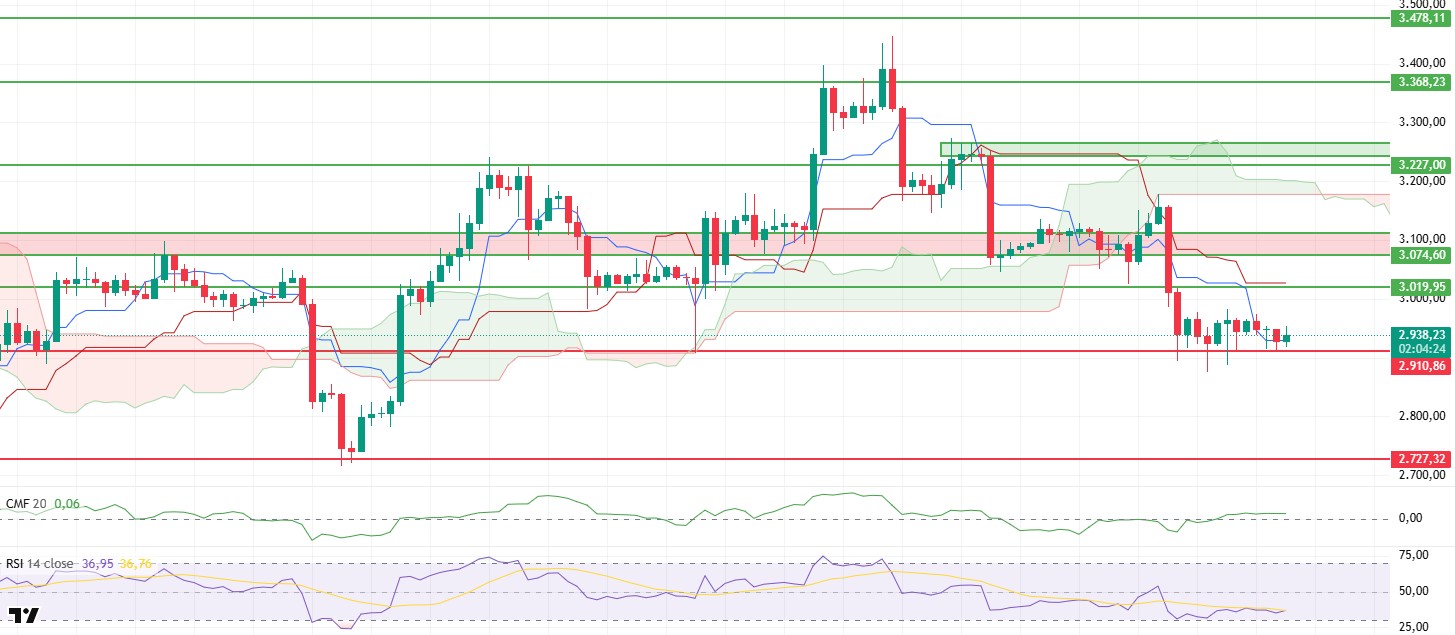
On the ETH side, as we approach the evening hours, intraday volatility continues downward in line with morning expectations. Selling pressure increased during the day, pulling the price back to the $2,910 support zone. A limited rebound occurred at this level as buyers stepped in, and the price recovered to $2,947. However, the weakness of this rebound indicates that the market has not yet established a strong equilibrium and that the downward trend has not completely ended.
There is no significant change in liquidity. The Chaikin Money Flow (CMF) remains positive, but its flat trajectory is noteworthy. The lack of liquidity inflows clearly explains why intraday rebound attempts failed to sustain. The absence of volume supporting buying pressure causes the price to encounter selling pressure at every upward attempt.
The picture on the momentum front is also unchanged compared to the morning hours. The Relative Strength Index (RSI) maintains its weak appearance and does not produce a strong signal that buyers have taken control of momentum. This stance of the RSI supports why rebound movements remain limited and upward demand is still low.
The technical structure also remains under pressure from the Ichimoku indicator. The price is trading below both the Kijun level and the kumo cloud. This positioning indicates that the short- and medium-term trend still favors sellers and that upward attempts are not technically supported. As long as pricing remains below the cloud, the risk of upward moves encountering selling pressure remains high.
The main scenario has not changed in the evening hours. A retest of the $2,910 level is likely. If this support is lost, increased selling pressure and steeper declines are possible. Conversely, a break above the $3,020 resistance could provide technical relief and pave the way for a more meaningful recovery. At this stage, weak liquidity, weak momentum, and a negative technical structure suggest that a cautious stance should be maintained on the ETH side.
Supports: 2,910 – 2,727 – 2,625
Resistances: 3,019 – 3,074 – 3,227
XRP/USDT
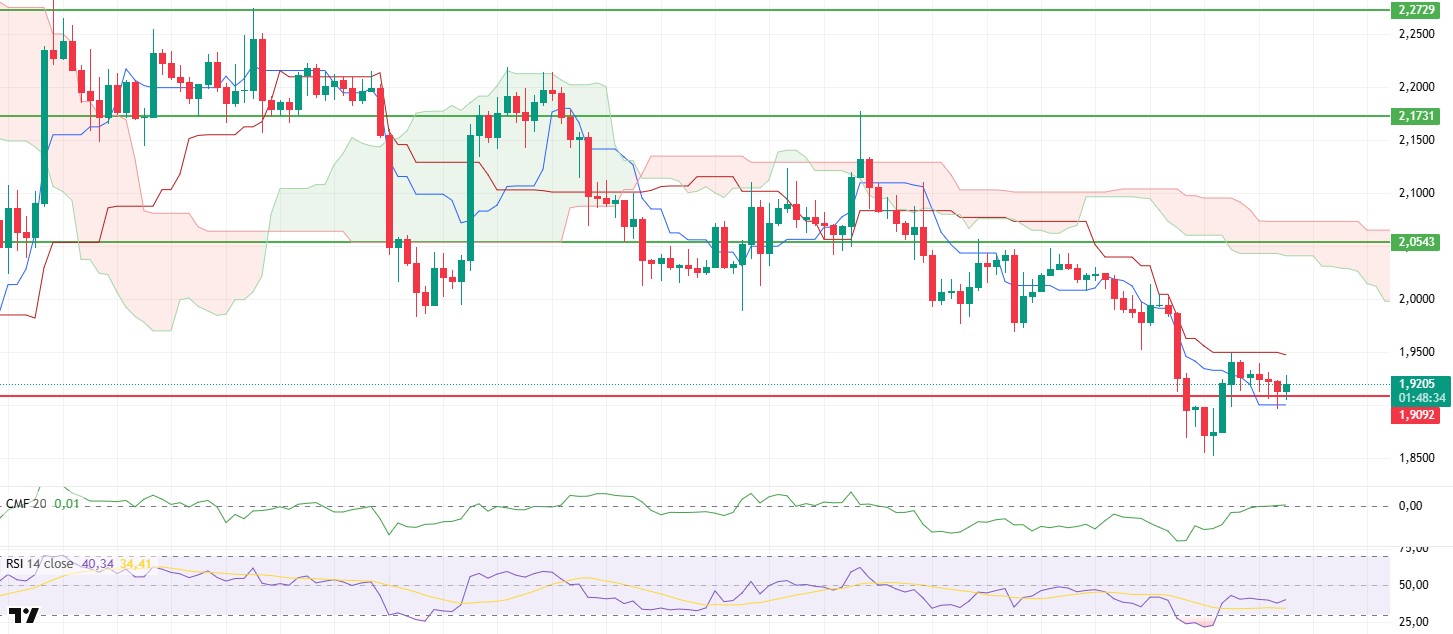
The price dipped below the $1.90 support level during the day but failed to stay there, rebounding to $1.92 with limited buyer response. However, the weakness of this response indicates that the market is still struggling to generate strong momentum and that the rebound is fragile.
On the liquidity front, a more positive picture began to emerge compared to previous hours. The Chaikin Money Flow (CMF) indicator moving into positive territory signals that capital inflows into the market have resumed. This increase in liquidity contributed to the price’s ability to recover quickly despite falling below $1.90. However, the current liquidity level does not appear strong enough to push the price above strong resistance zones.
A limited improvement in momentum is noteworthy. The Relative Strength Index (RSI) maintains a slight upward trend, but this movement does not yet signal a strong momentum shift. While the recovery in the RSI is positive, it is too early to say that buyers have taken control.
The technical outlook has not changed on the Ichimoku indicator. The price is still trading below the kumo cloud and has not been able to establish a sustainable structure above the Kijun level. This situation indicates that the short- and medium-term trend remains weak and that upward attempts are under technical pressure.
As of now, the decisive threshold in price behavior remains the $1.90 level. Sustained trading below this region could increase downward pressure again. Conversely, if the price continues to hold above $1.90 and liquidity inflows on the CMF side continue, it seems possible that the price could attempt to rebound towards the $2.05 resistance level in the short term. The overall outlook indicates that a cautious stance should be maintained due to the technical structure and momentum, despite a partial improvement in liquidity.
Supports: 1.9092 – 1.8121 – 1.6224
Resistances: 2.0543 – 2.1731 – 2.2729
SOL/USDT
Phantom is adding prediction markets with Kalshi integration.
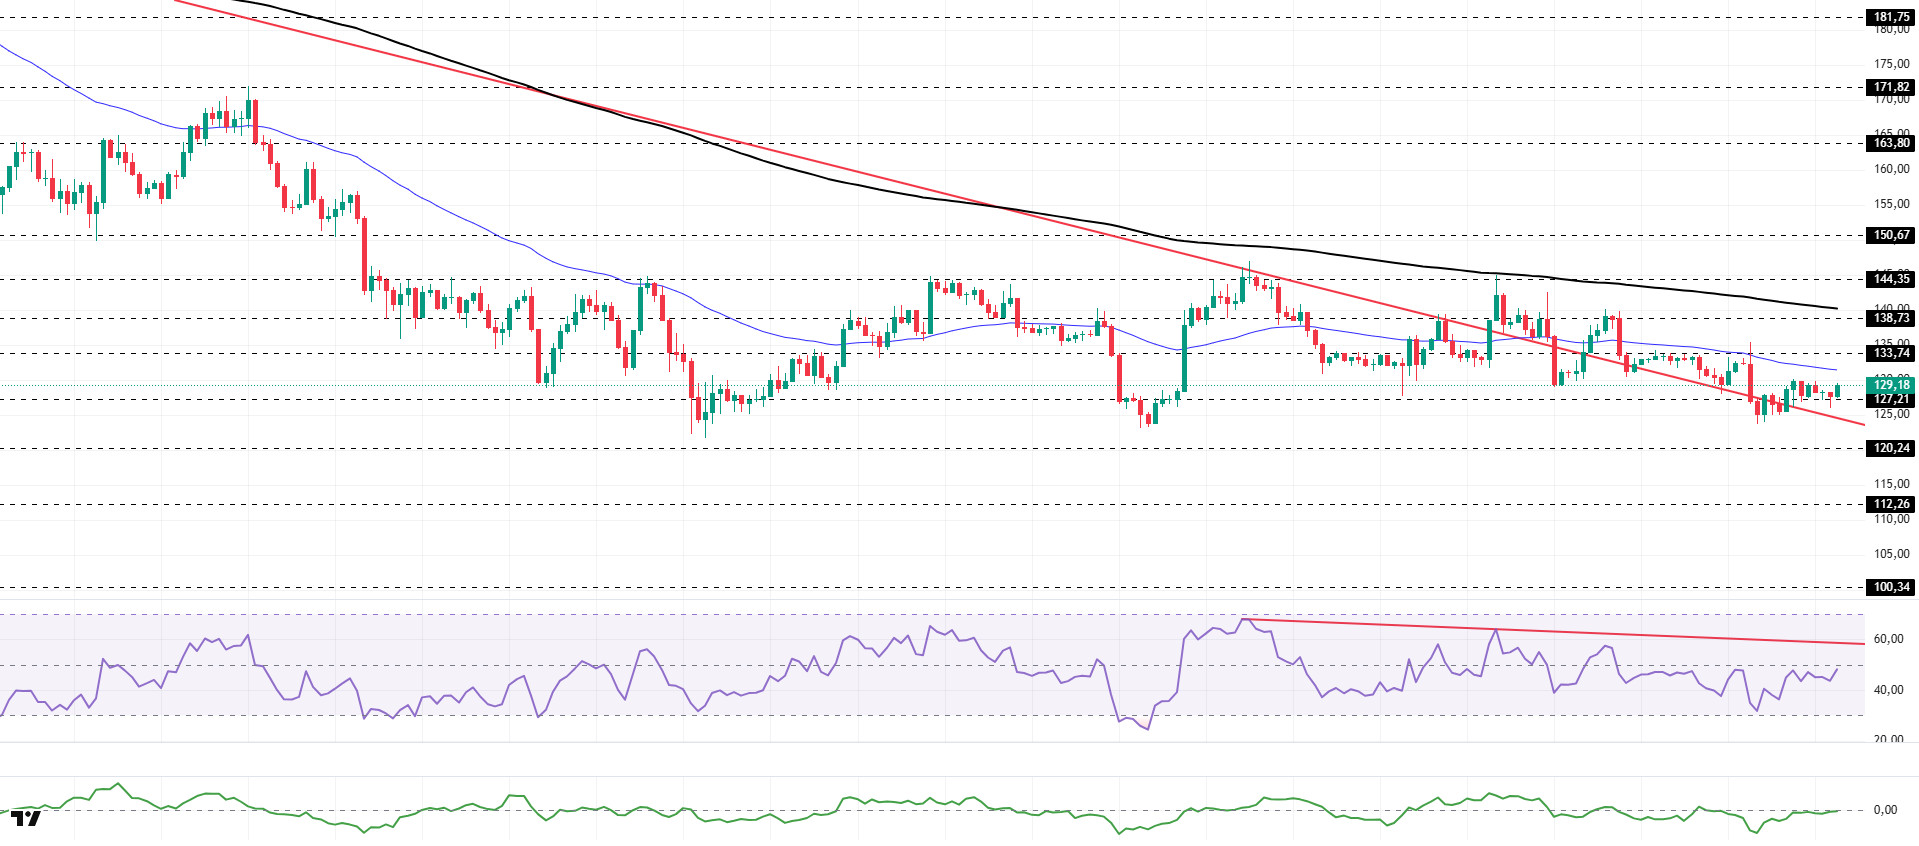
The SOL price traded sideways during the day. The asset remained in the upper region of the downtrend that began on October 6. Currently trading in a narrow band between the downward trend line and the 50 EMA (Blue Line) moving average, the asset could test the 200 EMA (Black Line) moving average as resistance if it experiences an uptrend. In the event of a pullback, the $120.24 level could be monitored.
On the 4-hour chart, it continued to trade below the 50 EMA (Exponential Moving Average – Blue Line) and 200 EMA (Black Line). This indicates that it may be in a downtrend in the medium term. At the same time, the price being below both moving averages indicates that the asset is trending downward in the short term. The Chaikin Money Flow (CMF-20) is in the negative zone, close to the neutral level. However, the balance of money inflows and outflows may keep the CMF in the negative zone. The Relative Strength Index (RSI-14) remained in the middle of the negative zone. It also remained below the downward trend line that began on December 3. This indicates that selling pressure continues. If there is an uptrend due to macroeconomic data or positive news related to the Solana ecosystem, the $138.73 level stands out as a strong resistance point. If this level is broken upwards, the uptrend is expected to continue. If there are pullbacks due to developments in the opposite direction or profit-taking, the $120.24 level could be tested. If it falls back to these support levels, an increase in buying momentum could present a potential opportunity for an uptrend.
Supports: 127.21 – 120.24 – 112.26
Resistances: 133.74 – 138.73 – 144.35
DOGE/USDT
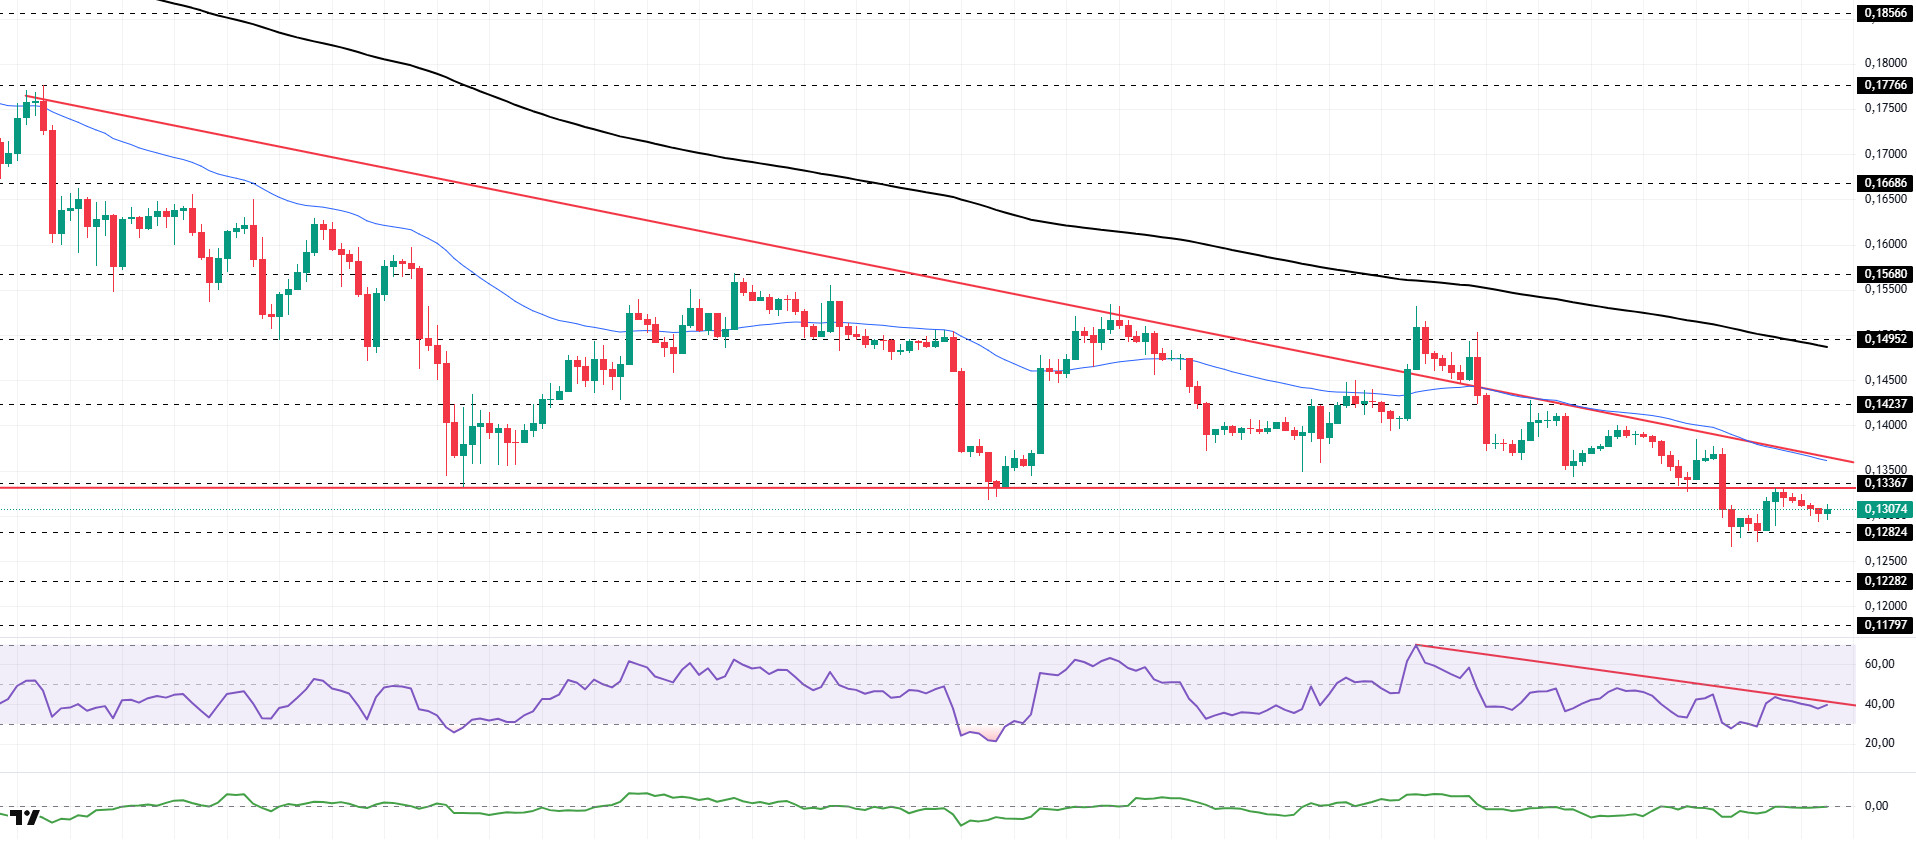
The DOGE price experienced a slight pullback during the day. The asset experienced a pullback by breaking below the base level of the descending triangle formation that began on November 13. Currently showing a slight increase, the price tested the base level of the descending triangle formation, which is a strong resistance level, and continued to experience a slight pullback. If the pullback continues, it may test the $0.12282 level as support. If it experiences an uptrend, it may test the 50 EMA (Blue Line) moving average or the top level of the descending triangle formation as resistance.
On the 4-hour chart, the 50 EMA (Exponential Moving Average – Blue Line) remained below the 200 EMA (Black Line). This indicates that the downtrend may continue in the medium term. The price being below both moving averages indicates a downward trend in the short term. The Chaikin Money Flow (CMF-20) remained at a neutral level. Additionally, an increase in money outflows could push the CMF into negative territory. The Relative Strength Index (RSI-14) remained in the middle of the negative zone. It also tested the resistance level of the downward trend that began on December 9 but experienced a slight pullback. This signaled increased selling pressure. In the event of a rise due to political developments, macroeconomic data, or positive news flow in the DOGE ecosystem, the $0.14952 level stands out as a strong resistance zone. Conversely, in the event of negative news flow, the $0.11797 level could be triggered. A decline to these levels could increase momentum and start a new wave of growth.
Supports: 0.12824 – 0.12282 – 0.11797
Resistances: 0.13367 – 0.14237 – 0.14952
Legal Notice
The investment information, comments, and recommendations contained herein do not constitute investment advice. Investment advisory services are provided individually by authorized institutions taking into account the risk and return preferences of individuals. The comments and recommendations contained herein are of a general nature. These recommendations may not be suitable for your financial situation and risk and return preferences. Therefore, making an investment decision based solely on the information contained herein may not produce results in line with your expectations.

