
Technical Analysis
BTC/USDT
Claims that US President Donald Trump and President Volodimir Zelenskiy may meet, and the Kiev administration’s 20-point peace plan, which is 90% complete, are strengthening expectations that the war could be moved to a diplomatic arena. In Asia, Japan’s preparation to post a primary budget surplus for the first time in 28 years, coupled with rising bond yields, is bringing fiscal discipline and debt sustainability back to the forefront. Meanwhile, the People’s Bank of China’s prioritization of financial development in five areas, primarily technology, green, and digital finance, is sending structural signals about the direction of global growth.
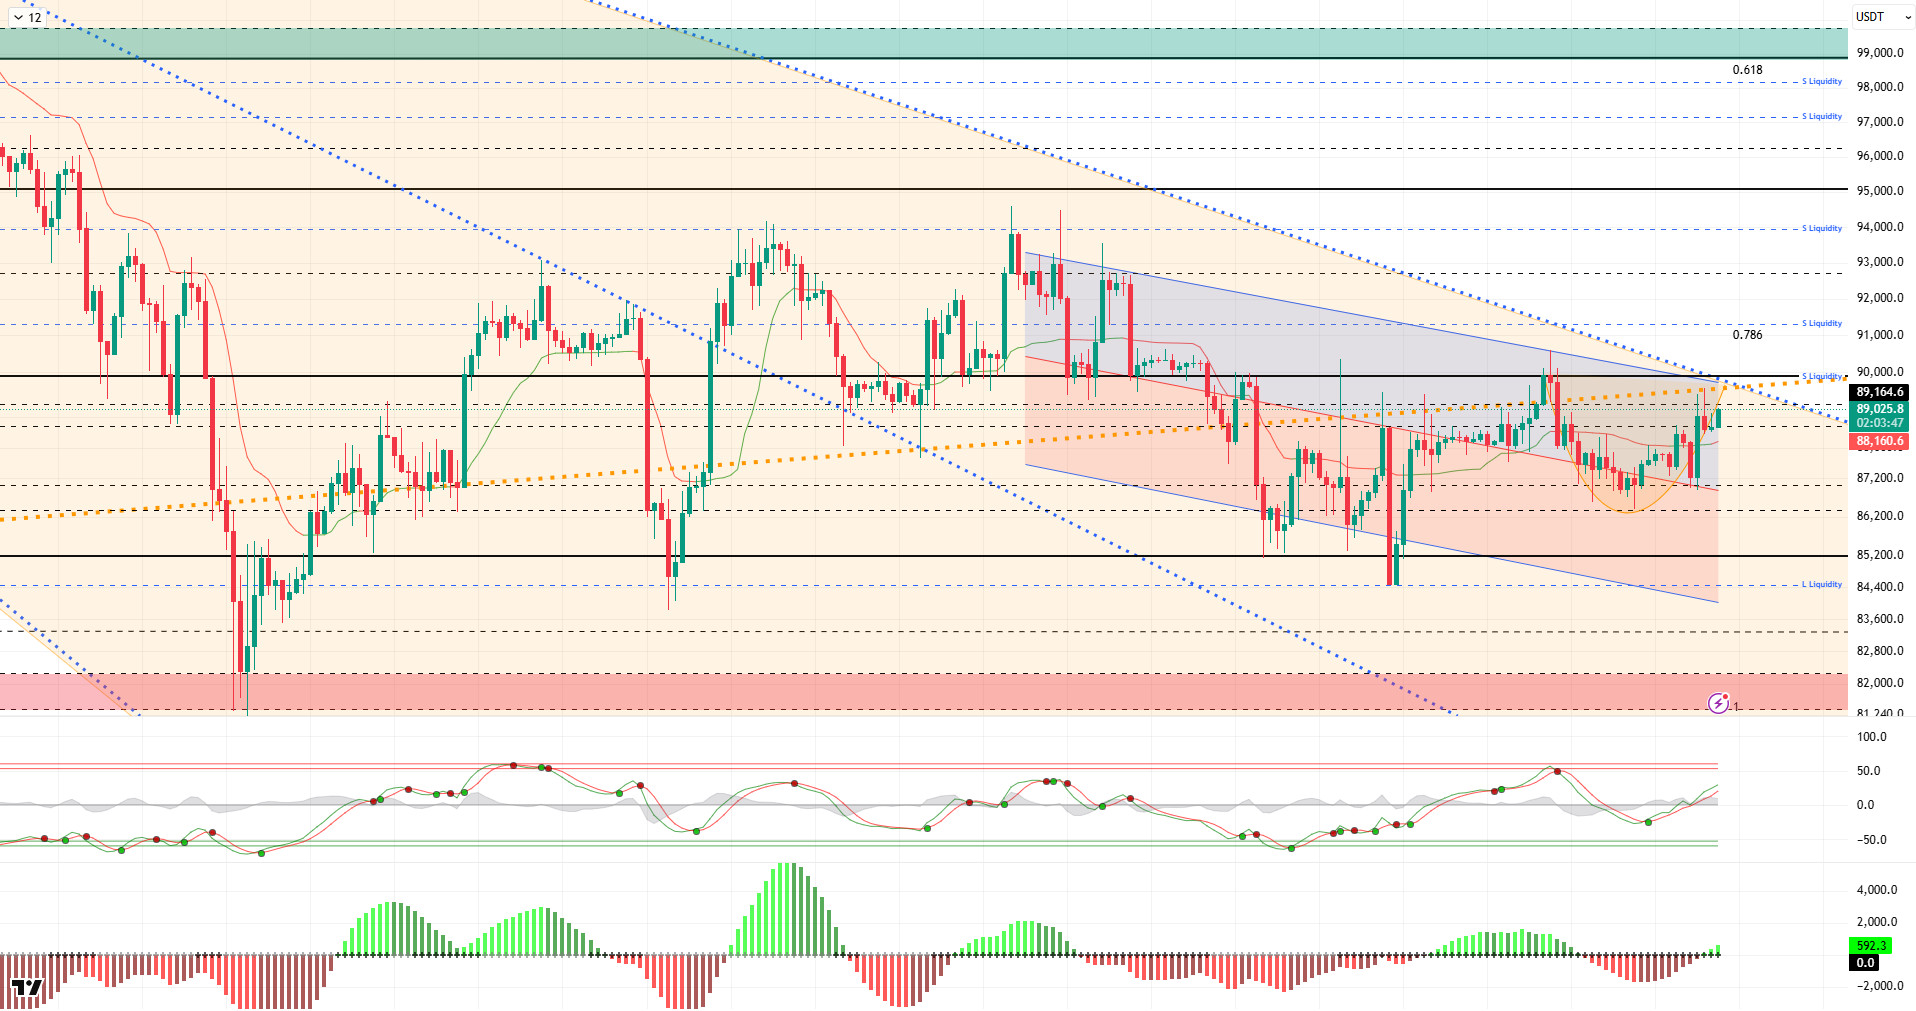
From a technical perspective, BTC does not show a significant price difference compared to the previous analysis, but the cup formation it created within the descending trend channel is noteworthy. Using the 88,500 level as support during the day, the price managed to hold above this level and continues to trade around 89,000. Having reached the top of the major descending orange band initiated since the ATH level and the intersection of the major uptrend, BTC could gain momentum for an upward movement with closes above the 90,000 level if it breaks through this point.
Technical indicators show that the Wave Trend (WT) oscillator ended its sell signal in the overbought zone at the channel’s middle band and switched to a buy signal. The histogram on the Squeeze Momentum (SM) indicator moved into positive territory, aligning with the oscillator. The Kaufman moving average (KAMA) is currently trading just below the price level at $88,159.
When examining liquidation data, an increase in volume was observed in the buy-sell tiers for BTC, with a partial buy tier at the liquidated level of 86,000 following 84,000 recording accumulation again. In contrast, the accumulation formed in the short term at the 88,000–89,000 sell levels also resulted in liquidation. In a broader time frame, the 90,000–91,000 level stands out as a liquidity zone.
In summary, as we approach the end of the year, the calm market environment continues, while the Bank of Japan (BoJ) indicates that interest rate hikes will continue next year. On the US side, the Fed is expected to maintain its cautious stance, while the US airstrike in Nigeria has become the focus of the market. Another development of the day was the possibility of a meeting between Zelensky and Trump on Sunday. In technical terms, BTC continues to trade within a falling trend channel, with no clear upward movement yet. Looking at liquidity data, it appears that short-term trades are concentrated in certain areas, while long-term sell orders have not yet been tested.After this stage, the 89,000 level will be monitored as a critical point where the major uptrend passes through for the price to regain momentum. Closings and pricing above this level will be an important indicator for regaining momentum, and a break above it is expected to accelerate the uptrend. If selling pressure deepens, 86,000 will emerge as a short-term liquidity area, while the 85,000 level is an important reference point.
Supports: 88,500 – 86,300 – 85,000
Resistances: 89,000 – 90,000 – 91,400
ETH/USDT
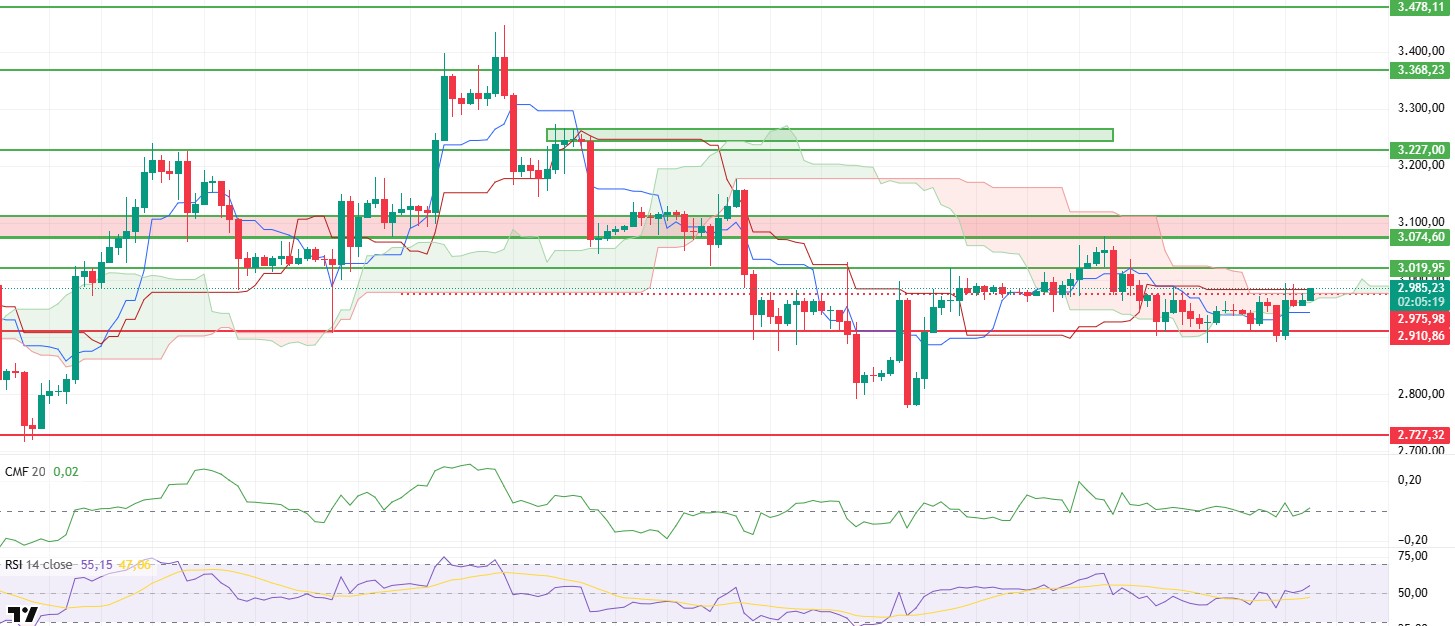
The picture changed somewhat later in the day on the ETH side. Riding the wave of positive sentiment in global markets, the price managed to break above the $2,975 level. The indecisive structure seen in the morning gave way to a more bullish outlook. Although the upward movement was not supported by volume, the limited selling suggests that buyers want to keep the price above this level.
On the cash flow side, there is no clear break. Chaikin Money Flow (CMF) continues to move around the zero line. There is no strong cash inflow into the market, nor is there any significant outflow. This structure suggests that the uptrend has not yet turned into a broad-based trend, but that downward pressure also remains weak.
The RSI shows a more positive picture compared to this morning. The indicator has risen above the 50 level and is trending upward. This movement indicates that buyers are starting to act more comfortably in the short term and are more eager to push the price higher. This trend, which is becoming clear for the first time in terms of momentum, is important for the price to hold at its current levels.
Looking at the Ichimoku indicator, the technical structure has also strengthened. The price has risen above the kumo cloud and is currently trading at the Kijun level. Breaking through this area could mean opening up room for upward movement. In such a scenario, the $3,020 level stands out as the first target. If this level is also passed, the rise could continue more comfortably.
In general, the short-term outlook for ETH is more positive than this morning. The $2,910 level remains a critical support level on the downside. As long as it stays above this level, pullbacks are expected to be limited. On the upside, price behavior above $2,975 and whether the Kijun level will be breached or not are emerging as the main factors that will determine the direction of the upcoming movement.
Supports: 2,910 – 2,727 – 2,625
Resistances: 3,019 – 3,074 – 3,227
XRP/USDT
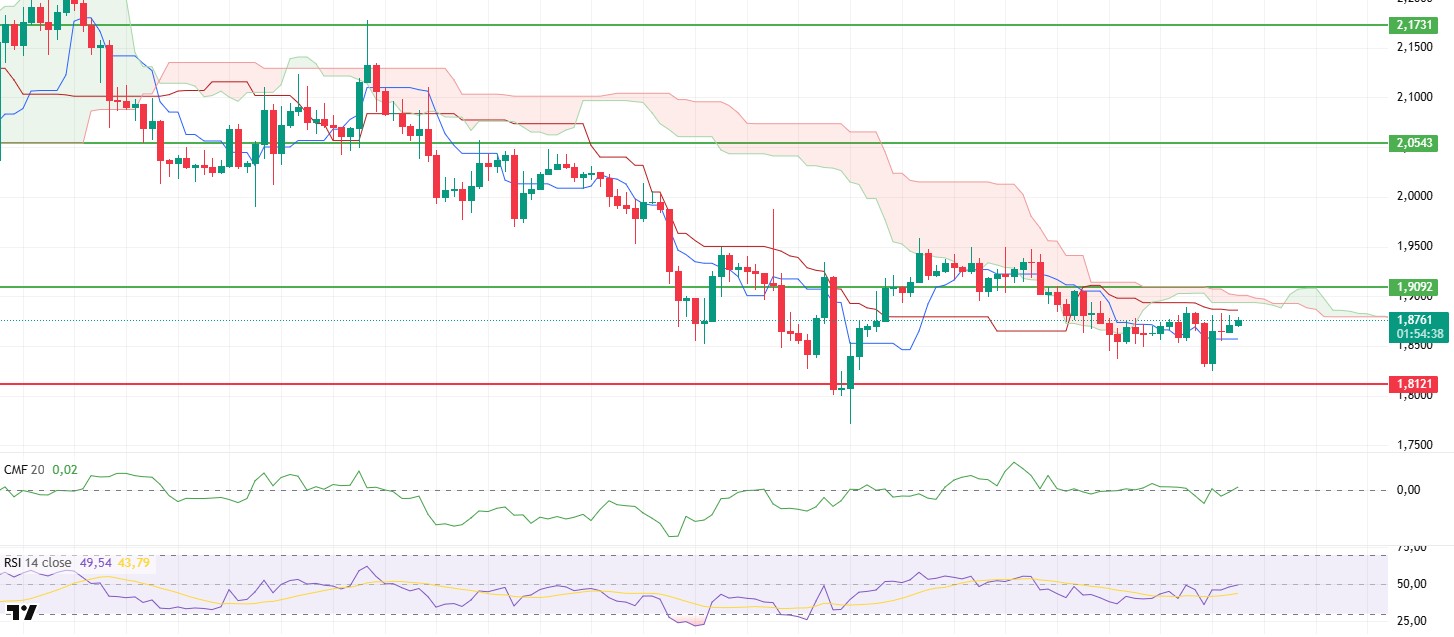
The XRP price made another small upward move later in the day, rising to $1.87. However, the momentum did not continue, and the price remains stuck in a narrow range. This picture during the day shows that buyers were able to push the price up slightly, but they couldn’t back this move with strong demand. The overall flow still points to a cautious and low-volume market.
There has been no significant change in the flow of money. Chaikin Money Flow (CMF) continues to move sideways, indicating that there is no clear direction in terms of money entering or leaving the market. This stagnation in liquidity clearly explains why the price is fluctuating within a narrow range. For a new movement to occur, a clear direction needs to emerge in this indicator.
The momentum side presents a similar picture. The Relative Strength Index (RSI) remained flat during the day without showing any significant change. This structure indicates that neither buyers nor sellers are able to take control of the momentum. Unless a clear momentum develops on the RSI side, it seems difficult for the price to break out of the current range.
On the Ichimoku indicator side, a limited recovery signal for the short term is maintained. The price remaining above the Tenkan level suggests that downward pressure has weakened for now. However, the Kijun level and kumo cloud are still positioned above. Therefore, the technical outlook cannot be considered fully positive, and upward attempts are progressing cautiously.
In the overall picture, there has been no significant change for XRP compared to the morning hours. The $1.90 level remains the main area that needs to be broken above. Unless this area is breached, the price is expected to continue fluctuating within the current range. On the downside, the $1.81 level retains its importance.
Supports: 1.8121 – 1.6224 – 1.5146
Resistances: 1.9092 – 2.0543 – 2.1731
SOL/USDT
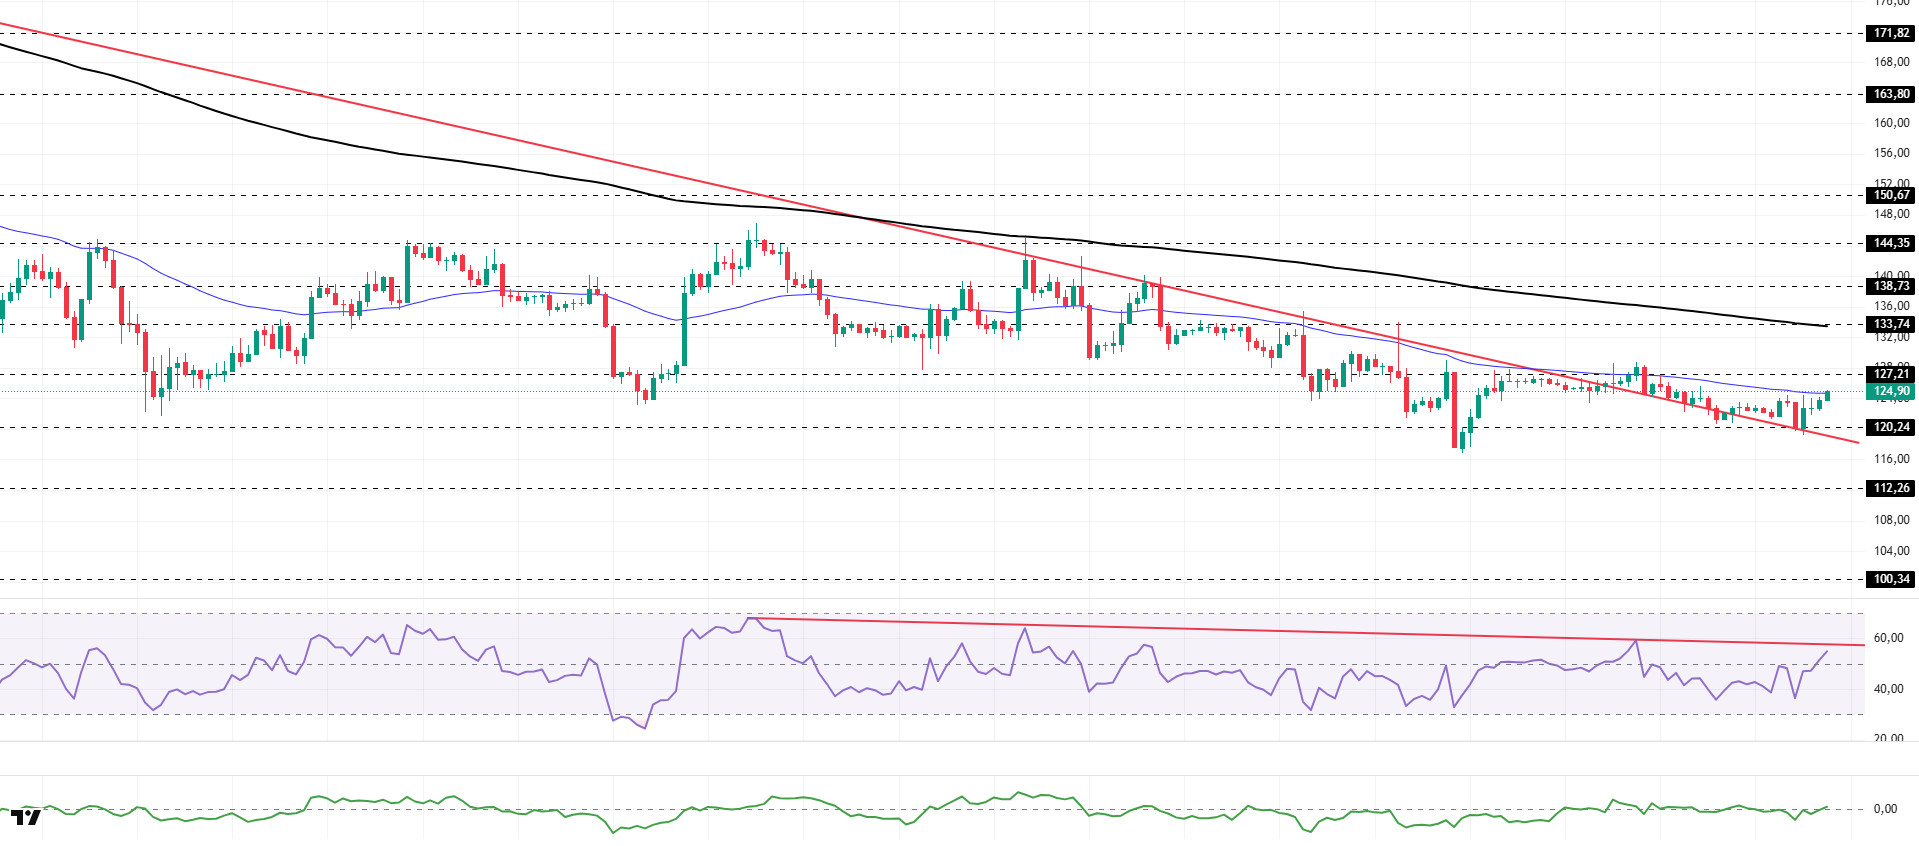
The SOL price traded sideways during the day. The asset continued to trade in the upper region of the downtrend that began on October 8. Testing the strong support level of $120.24 and the downtrend as support and gaining momentum, the price is currently testing the 50 EMA (Blue Line) moving average as resistance. If it closes above the 50 EMA, it may test the 200 EMA (Black Line) moving average as resistance. In case of a pullback, the $120.24 level could act as support.
The price remained below the 50 EMA (Exponential Moving Average – Blue Line) and 200 EMA (Black Line) on the 4-hour chart. This indicates that the downtrend is continuing in the medium term. At the same time, the price being below both moving averages signaled that the asset is trending downward in the short term. The Chaikin Money Flow (CMF-20) remained at a neutral level. However, an increase in money inflows could push the CMF into positive territory. The Relative Strength Index (RSI-14) rose from the middle of the negative zone to positive territory. However, it remained below the downward trend that began on December 3. This signaled that selling pressure continued. If there is an upturn due to macroeconomic data or positive news related to the Solana ecosystem, the $133.74 level stands out as a strong resistance point. If this level is broken upwards, the uptrend is expected to continue. In the event of pullbacks due to developments in the opposite direction or profit-taking, the $112.26 level could be tested. A decline to these support levels could increase buying momentum, presenting a potential upside opportunity.
Supports: 120.24 – 112.26 – 100.34
Resistances: 127.21 – 133.74 – 138.73
DOGE/USDT
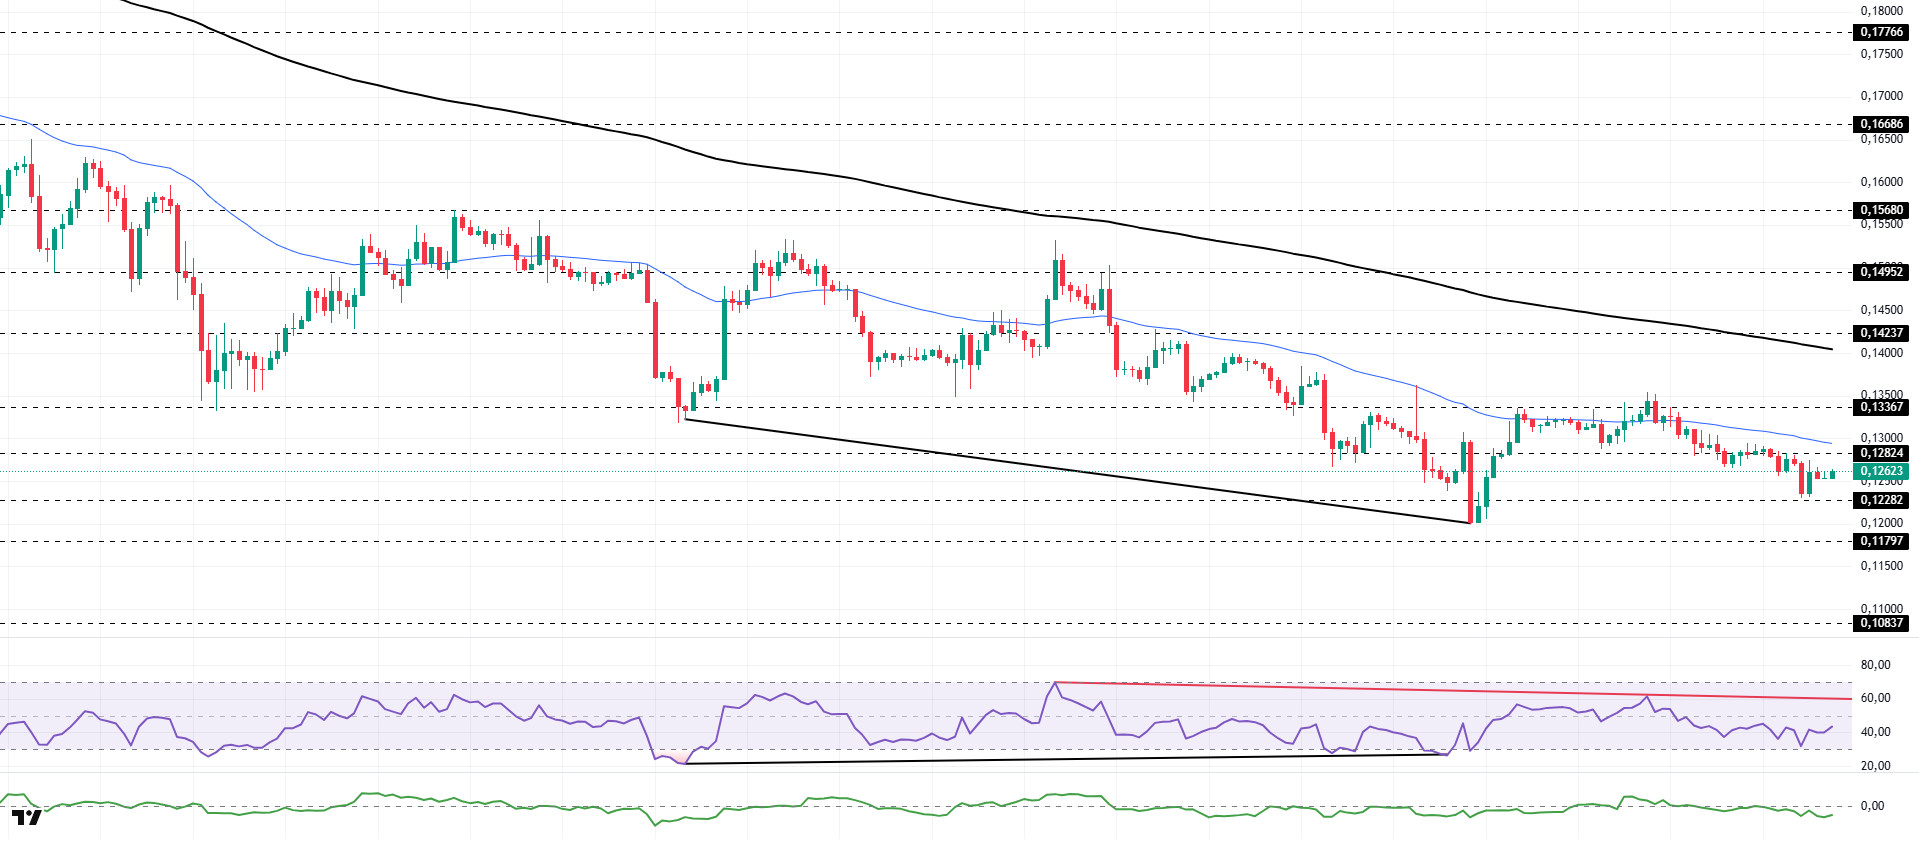
The DOGE price traded sideways during the day. The asset remained below the 50 EMA (Blue Line) moving average, signaling continued downward pressure. Gaining momentum from the strong support level of $0.12282, the price is currently testing the 50 EMA moving average and the $0.12824 level as resistance. If it closes above this level, it may test the 200 EMA (Black Line) moving average as resistance. In the event of a pullback, the $0.12282 level could act as support again.
On the 4-hour chart, the 50 EMA (Exponential Moving Average – Blue Line) remained below the 200 EMA (Black Line). This indicates that the downtrend could continue in the medium term. The price being below both moving averages indicates a downward trend in the short term. The Chaikin Money Flow (CMF-20) remained in negative territory. Additionally, a decrease in money inflows could push the CMF deeper into negative territory. The Relative Strength Index (RSI-14) also remained in negative territory. At the same time, it continued to stay below the downward trend line that began on December 9. This signaled that selling pressure was continuing. On the other hand, the positive divergence remains valid. In the event of a rise due to political developments, macroeconomic data, or positive news flow in the DOGE ecosystem, the $0.14237 level stands out as a strong resistance zone. Conversely, in the event of negative news flow, the $0.11797 level could be triggered. A decline to these levels could increase momentum and start a new wave of growth.
Supports: 0.12282 – 0.11797 – 0.10837
Resistances: 0.12824 – 0.13367 – 0.14237
BNB/USDT
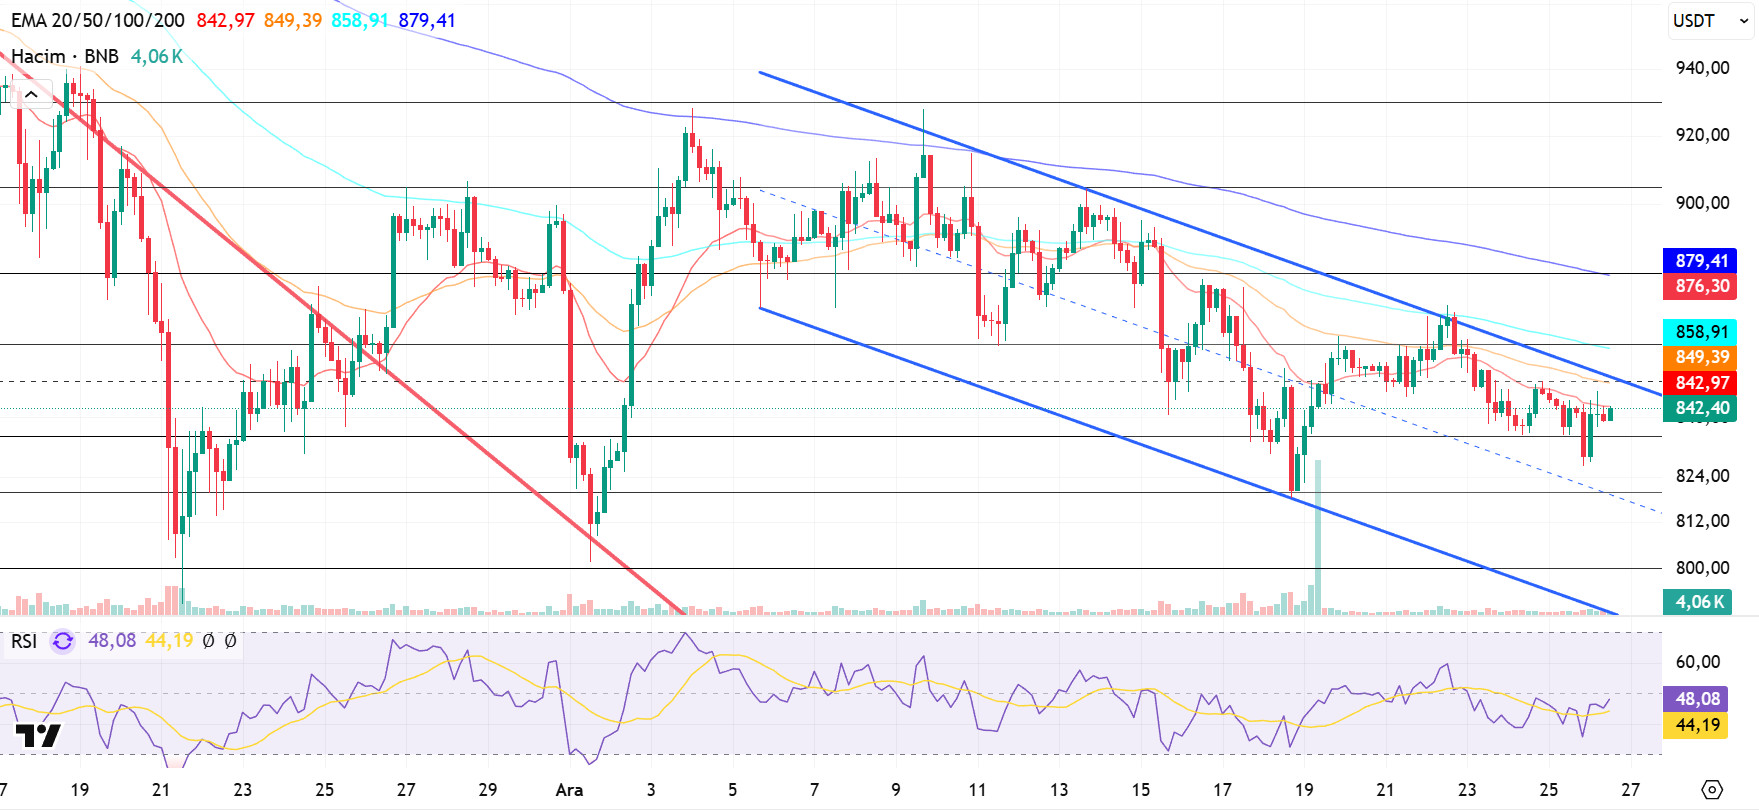
From a technical perspective, BNB/USDT, which has been seeking support for some time, has risen to the $930 level by testing the downward trend upward with the support provided by new candles. While selling pressure has increased in this region depending on market conditions, the asset appears to be continuing its movement within a downward channel for some time.
Overall, the BNB/USDT pair is showing a flat picture. In this context, the price fluctuating within a flat band indicates that the search for direction continues in the medium term. If upward price movements gain strength, a positive outlook is expected to be supported.
Currently trading in the $835–860 range, technical indicators for BNB reveal that low trading volume is limiting the upward momentum. Additionally, the RSI indicator is seen hovering at relatively low levels due to weak momentum.
Within the technical outlook, if buying appetite is maintained and market momentum strengthens, BNB is expected to retest the $860 resistance level in the first stage. Breaking above this level could potentially lead to a break above the downtrend line. If the trend break is confirmed and the price manages to hold above this level, a rise towards the $880 and $905 levels appears technically possible.
On the other hand, if selling pressure increases, the price is expected to retest the $835 support level. If this level is broken downward, a pullback towards the $820 and $800 support zones will be on the agenda.
Supports: 835 – 820 – 800
Resistances: 860 – 880 – 905
LTC/USDT
Price movements in the Litecoin (LTC) / USDT pair continued with a 2.22% increase in value during the day. At the same time, LTC’s 0.12% increase compared to Bitcoin indicates that Litecoin showed upward movements against Bitcoin within the general market movements and that the reason for the decline was the downward movement in Bitcoin. On the futures front, the long/short position ratio over the last 24 hours standing at 0.949 indicates that derivative market participants have stronger downward expectations for LTC.
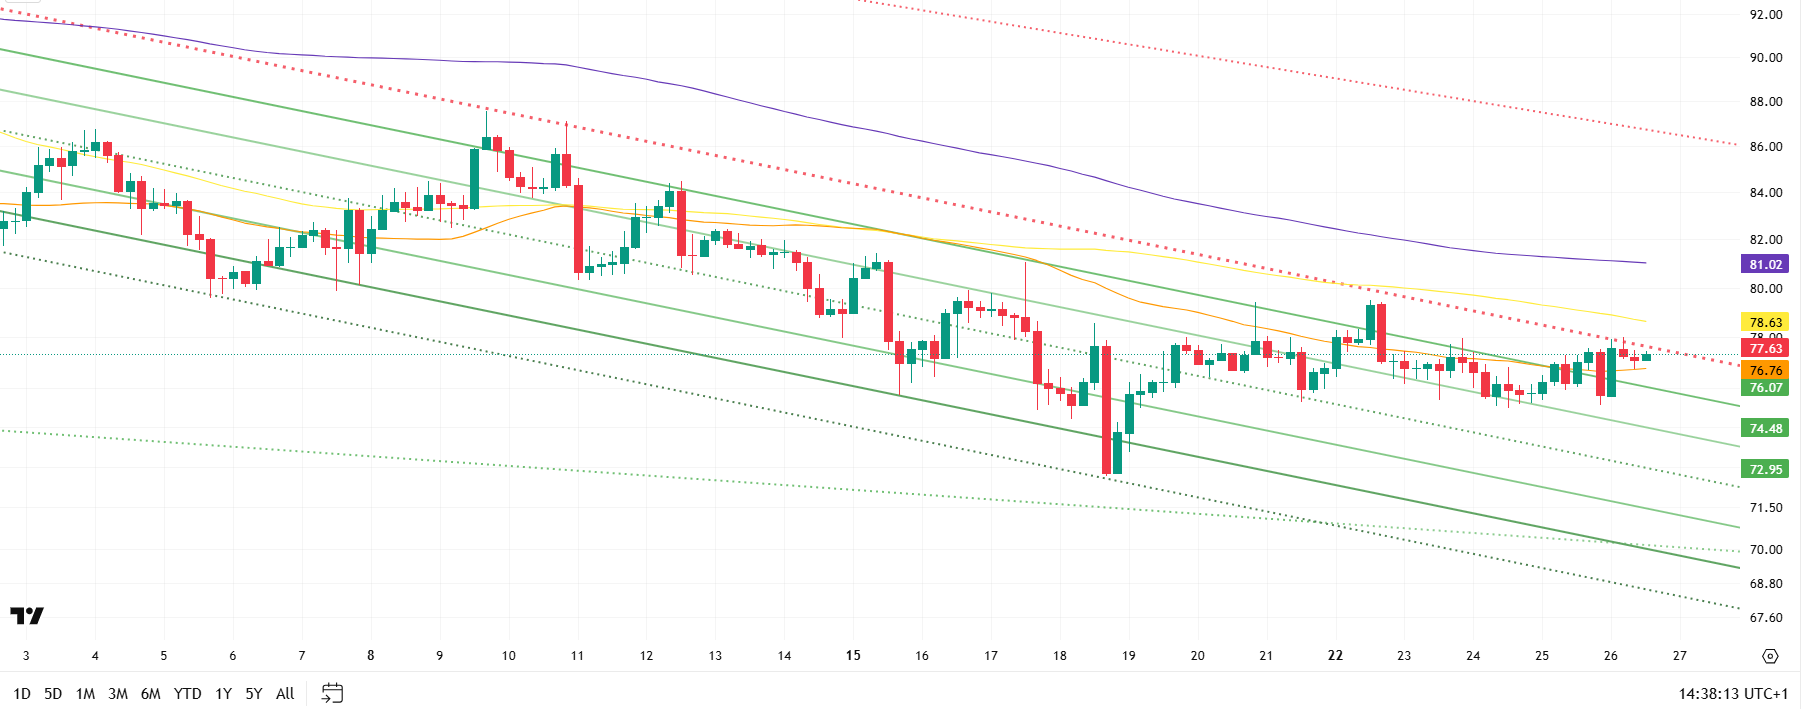
A technical analysis of Litecoin’s 4-hour USDT pair shows that the price is below the 200 and 100-period moving averages (purple and yellow lines, respectively) and above the 50-period moving average (T orange line). This view is consistent with the increase in short positions relative to long positions in the derivatives markets, indicating that the downward trend in the main trend is approaching neutral but has not yet fully transitioned.
However, the current price structure also holds the potential to evolve positively from here if it transitions to a neutral outlook. In this scenario, the first strong resistance area that the upward movement may encounter is the upper line of the descending channel at the 77.63 level. This resistance zone stands out as an important critical step towards transitioning from a negative to a neutral outlook. If this level is exceeded, the 78.63 level will come into focus with the selling pressure created by the 100-period moving average, which should be monitored intraday. If the uptrend gains momentum and heads towards the 81.02 level, the uptrend is likely to remain limited due to the effect of the 200-period moving average.
In the event of a downward movement, the first important support level is observed at 76.07, which offers a strong structure in terms of support. However, if this level is broken downwards, selling pressure is expected to increase, bringing the support levels of 74.48 and 72.95 into focus. The 72.95 level, in particular, holds strong potential for a rebound due to its position in the middle band of the channel structure.
Supports 76.07 – 74.48 – 72.95
Resistance levels 77.63 – 78.63 – 81.02
Legal Notice
The investment information, comments, and recommendations contained herein do not constitute investment advice. Investment advisory services are provided individually by authorized institutions taking into account the risk and return preferences of individuals. The comments and recommendations contained herein are of a general nature. These recommendations may not be suitable for your financial situation and risk and return preferences. Therefore, making an investment decision based solely on the information contained herein may not produce results in line with your expectations.

