
Technical Analysis
BTC/USDT
Macroeconomic data released in the US and messages from the policy front led to market expectations regarding the Fed’s interest rate path taking on a cautious outlook. While third-quarter GDP reaching its highest level in two years demonstrated the resilience of domestic demand, the slowdown in employment growth and the decline in durable goods orders brought sectoral divergence in economic activity to the fore. Meanwhile, Trump indicated that he would continue with a candidate for Fed chair who aligns with his policy approach.
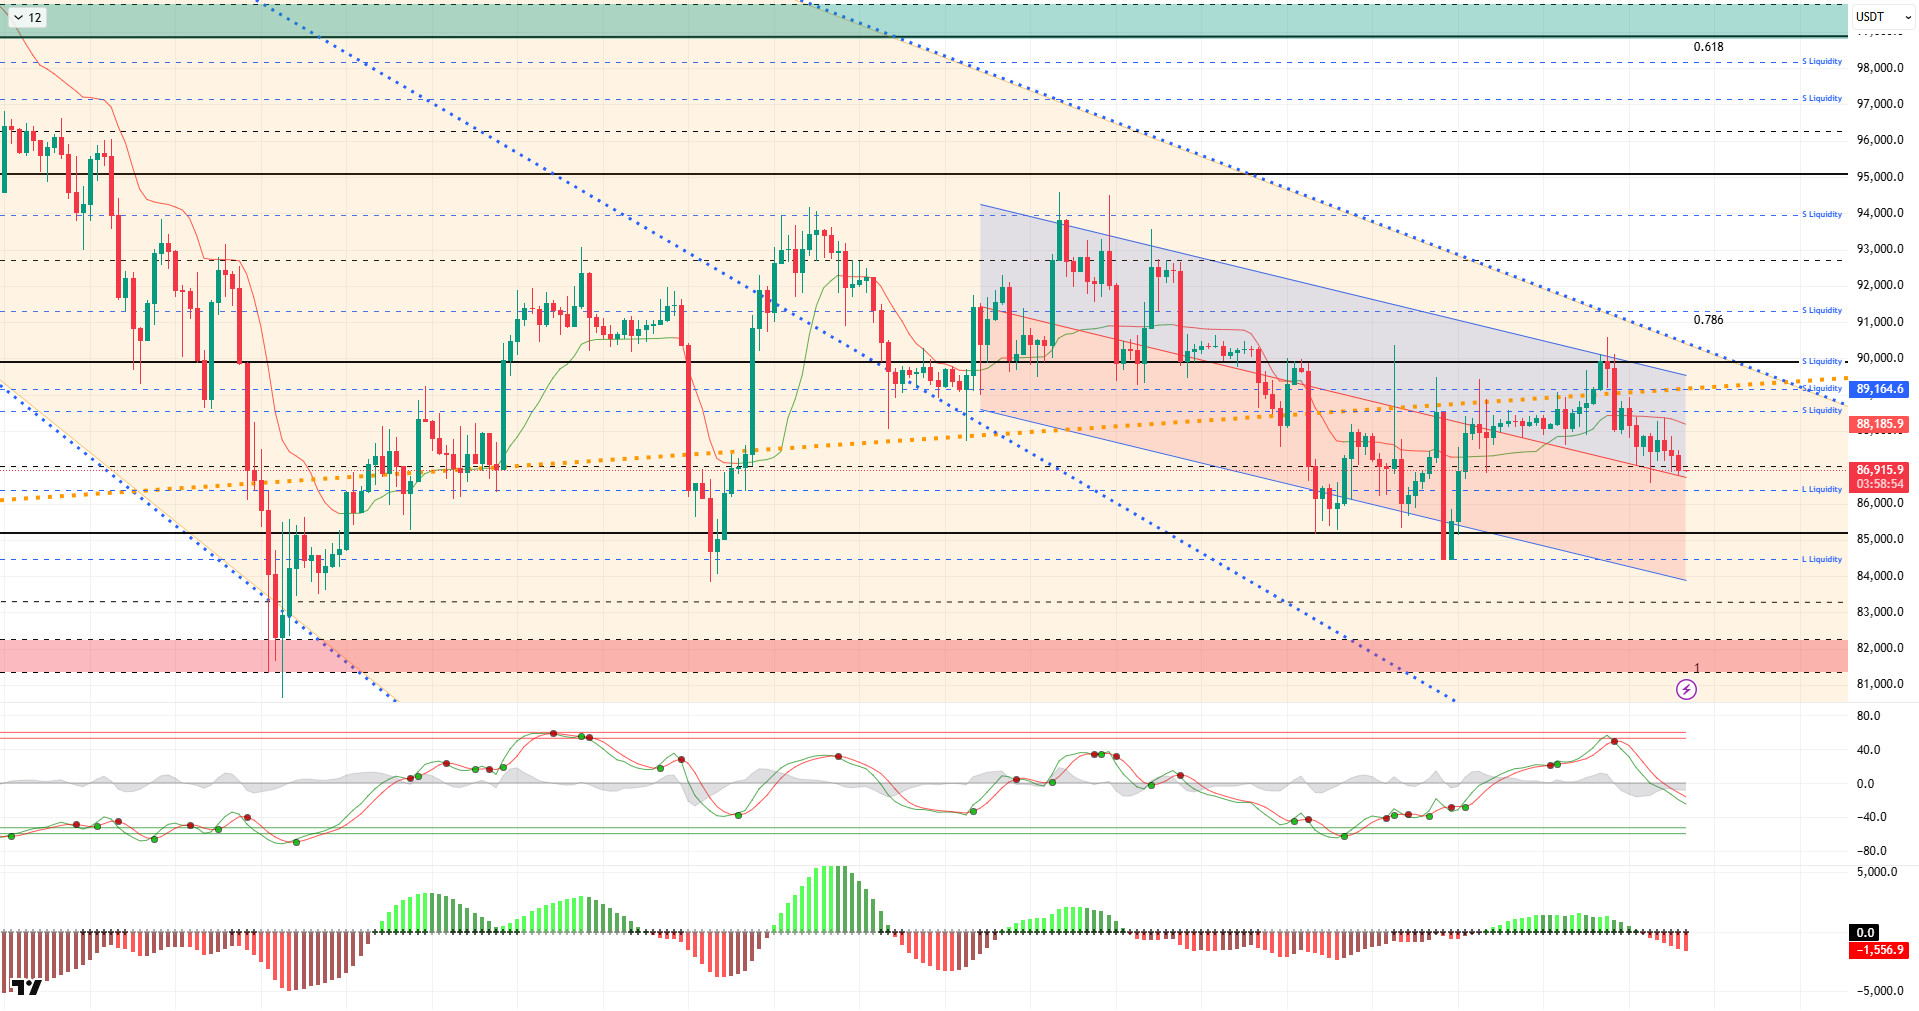
From a technical perspective, BTC continues to test the middle band of the channel within a declining minor trend structure. With the effect of declining volatility in price movements, the body length of the candles is shortening, while the sharp movements of the wick in the narrow band are noteworthy. These movements indicate that market participants are indecisive in the short term, occasionally retreating below the channel’s middle band and exhibiting fake movements. In this context, as we approach the end of the year, it is worth noting that BTC, which is poised to close the year negatively, can only move upward with closes above the 90,000 level.
Technical indicators show that the Wave Trend (WT) oscillator has reached the channel midline, paralleling the sell signal it gave in the overbought zone. The histogram on the Squeeze Momentum (SM) indicator weakened significantly in the positive zone and moved into negative territory, aligning with the oscillator. The Kaufman moving average (KAMA) is currently hovering just above the price at the $87,277 level.
When examining liquidation data, an increase in volume was observed in the buy-sell tiers for BTC, forming fragmented buy tiers at the 84,000 and then 86,000 levels. In contrast, the selling tiers recorded accumulation in the short term at 88,000–89,000, while intense accumulation continues above the 91,000 level in the broader time frame.
In summary, despite falling interest rate cut expectations following US macroeconomic data, President Trump once again emphasized interest rate cuts. On the global geopolitical front, Trump’s Greenland remarks and the Russia-Ukraine conflict are prominent. Meanwhile, as we approach the end of the year, the Christmas lull in the markets is noticeable, and the year-end tax exemption situation may cause shares to change hands. Technically, BTC continues to price with indecisive structures, and a clear upward movement has not yet formed. Looking at liquidity data, it appears that areas with concentrated short-term trading are being targeted, while long-term sell orders have not yet been tested.After this stage, the 89,000 level will be monitored as a critical point where the major upward trend passes through for the price to regain momentum. Closes and price action above this level are important indicators for regaining momentum. If selling pressure deepens, 86,000 emerges as a short-term liquidity area, while the 85,000 level is an important reference point.
Supports: 86,300 – 85,000 – 84,400
Resistances: 88,000 – 89,000 – 90,000
ETH/USDT
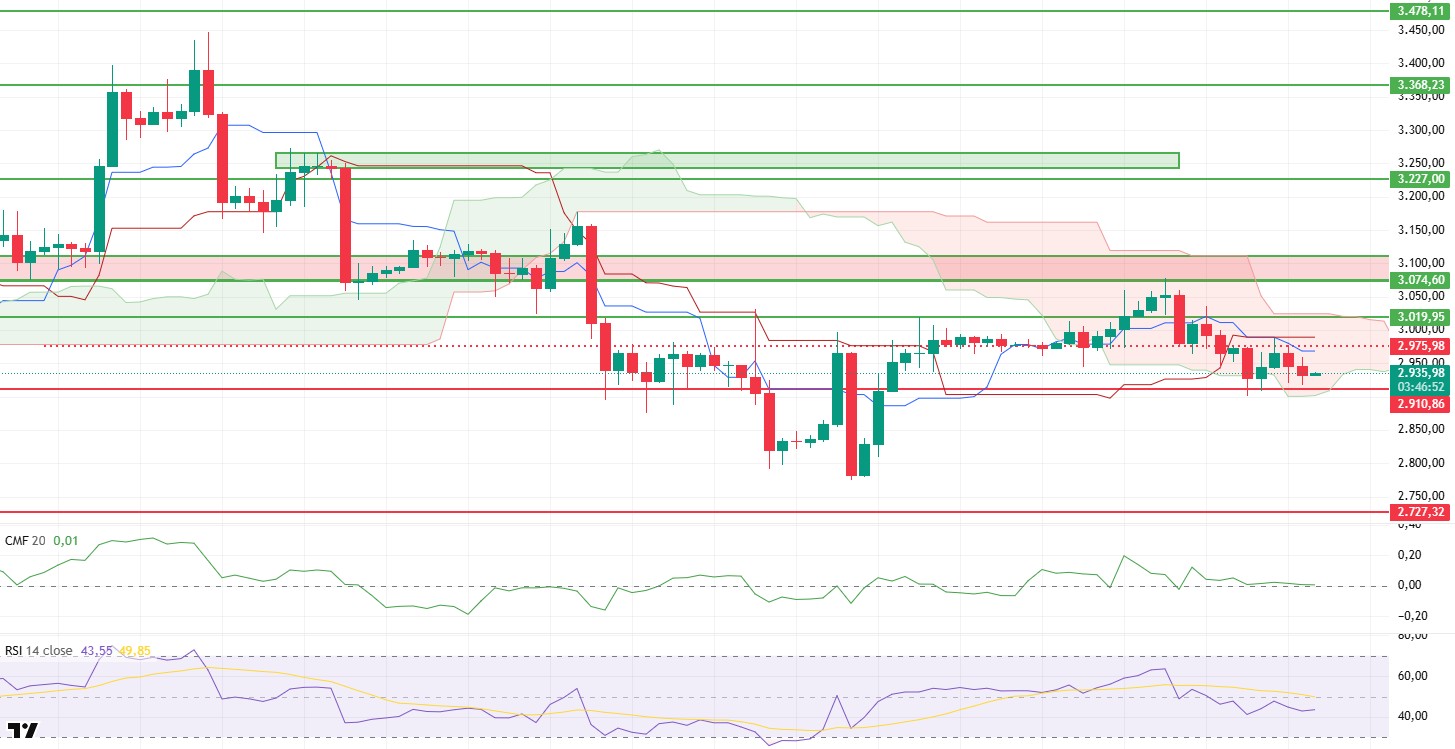
The ETH price failed to break through the intermediate resistance area at the $2,975 level yesterday evening and experienced a limited pullback towards the morning hours following selling pressure from this region. Despite the price pullback, it is still trading within the kumo cloud boundaries. This structure indicates that the upward trend has not completely broken down, but the market is struggling to find a clear direction. Pricing reflects a wait-and-see mode, with buyers’ demand weakening and sellers not becoming aggressive.
On the liquidity front, the picture points to a more cautious outlook compared to the previous day. The Chaikin Money Flow (CMF) indicator has fallen to the zero line. This movement indicates that the capital entering the market has decreased and the liquidity flow has stalled. Although there is no strong exit at this stage, it is understood that the liquidity support to fuel a new rise has not been formed.
There is similar indecision on the momentum side. The Relative Strength Index (RSI) continues its horizontal movement below the 50 level. This structure in the RSI reveals that buyers cannot take control and momentum remains weak. For upward attempts to gain strength, a clearer recovery is needed on the RSI side.
The technical outlook from the Ichimoku indicator perspective shows that risks have not completely disappeared. While the squeeze between the Tenkan and Kijun levels continues, the possibility of a potential downward breakout remains on the table. Although the price remaining within the kumo cloud maintains balance, selling pressure could accelerate if it dips below this area. Therefore, the current technical structure is at a sensitive point that requires careful monitoring.
The overall outlook remains similar to the previous analysis, but the market has entered a tighter structure. A dip below the $2,900 level could increase downside risks. Conversely, if the price breaks above the $3,020 region again, it could generate an important signal that the uptrend is gaining strength. Given the current conditions of weak liquidity, indecisive momentum, and a sensitive technical structure, a cautious monitoring process is recommended for ETH.
Below the Form
Supports: 2,910 – 2,727 – 2,625
Resistances: 3,019 – 3,074 – 3,227
XRP/USDT
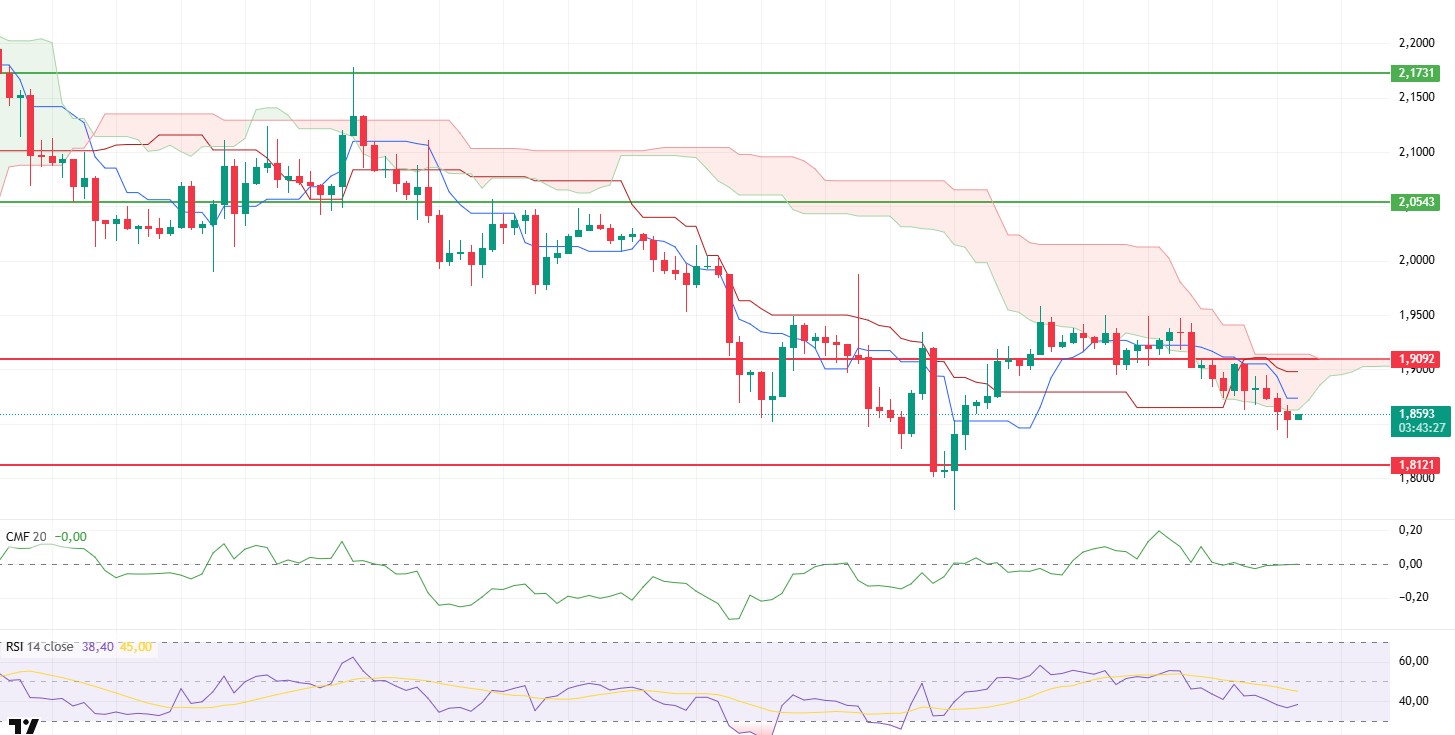
Selling pressure on the XRP side continued to increase throughout the day. Following sales from the $1.90 level, the pullback deepened and the price fell to the $1.85 level. This movement shows that the limited recovery attempts seen in previous days were completely ineffective and that the market has turned downward. The weakness of buyers throughout the pullback indicates that the decline is progressing step by step rather than being controlled.
The liquidity picture is clearly fragile. The Chaikin Money Flow (CMF) indicator is balanced around the zero line. This structure indicates that there is no strong liquidity inflow, but also that a sharp outflow has subsided for now. Liquidity remaining in neutral territory is unable to provide meaningful support against downward price movement. For a new recovery, a renewed positive trend is needed on the CMF side.
Weakness persists on the momentum side. The Relative Strength Index (RSI) remains below the 50 level, with no clear signs of a rebound in momentum. The RSI holding in this region indicates that sellers are still dominant and that the price is struggling to make an upward move. Unless momentum gains strength, reactionary buying is likely to remain limited.
The technical outlook is also under pressure from the Ichimoku indicator. While the Tenkan and Kijun levels remain negative, the price has moved closer to the lower band of the kumo cloud. The lower band of the kumo cloud at the $1.86 level has become a critical threshold. Sustained trading below this level could cause the decline to become more severe.
Overall, the outlook for XRP remains risky. If the $1.86 level is lost, selling pressure is expected to accelerate. Conversely, if the price settles back above $1.90, it could weaken the current negative picture and bring a short-term search for equilibrium to the fore. However, when current liquidity, momentum, and technical structure are considered together, downside risks still appear to prevail.
Supports: 1.9092 – 1.8121 – 1.6224
Resistances: 2.0543 – 2.1731 – 2.2729
SOL/USDT
Solana Treasury company Upexi has applied for a $1 billion capital increase.
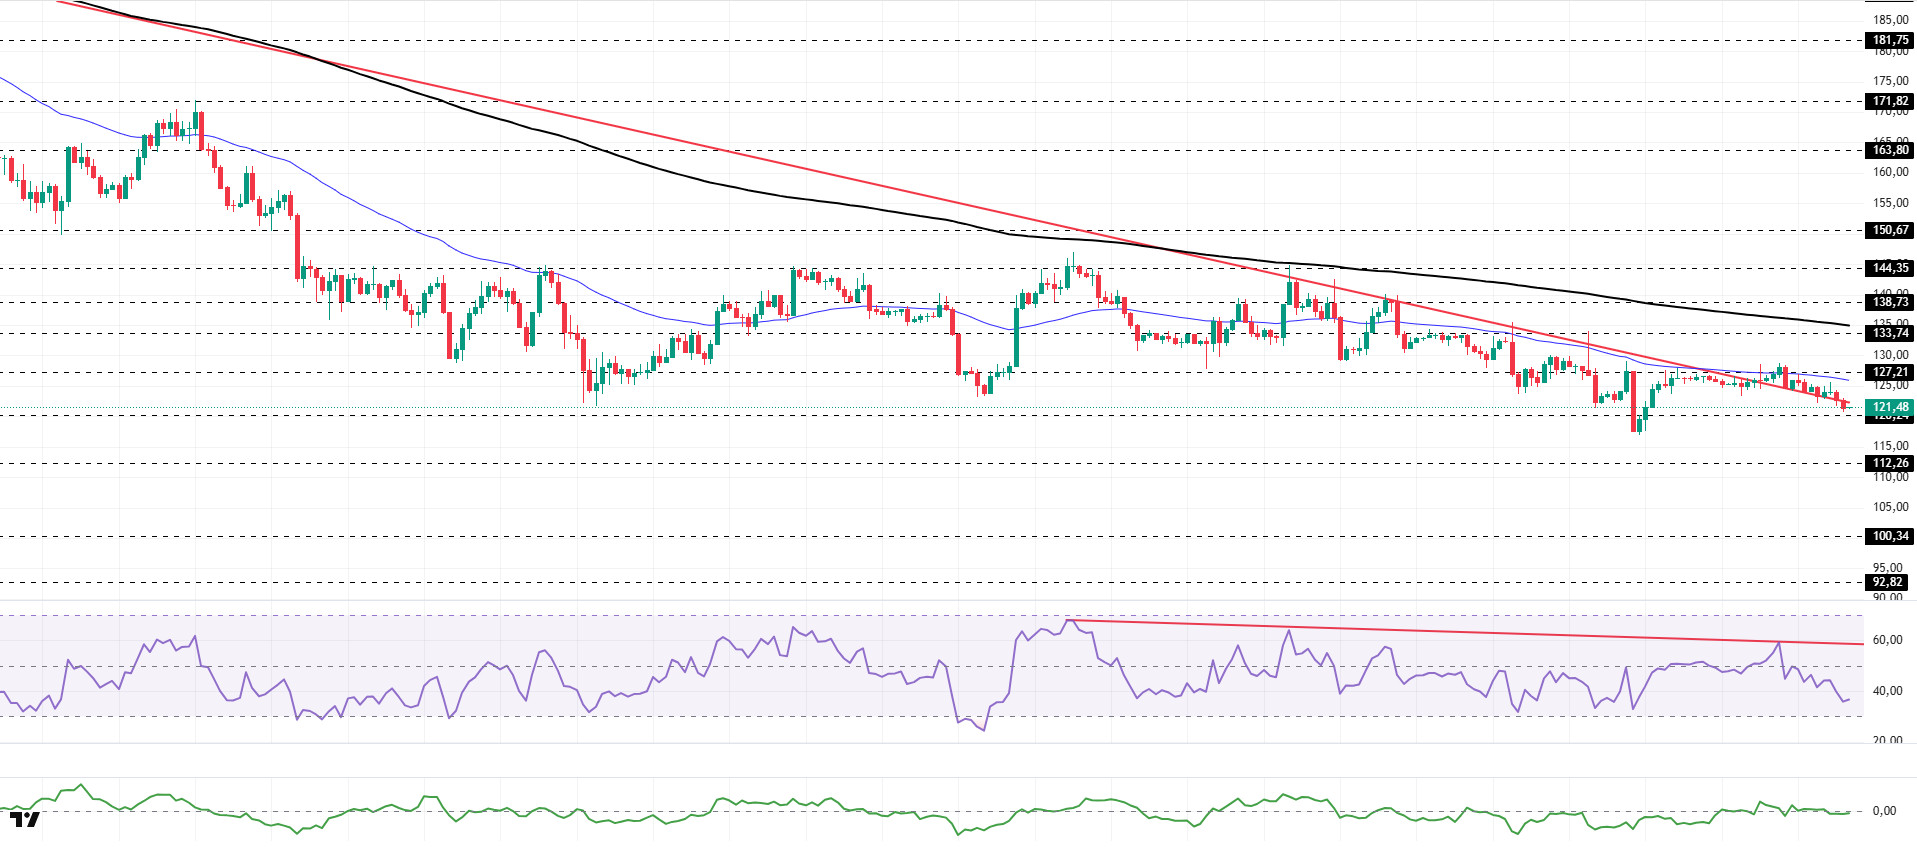
The SOL price showed a slight decline. The asset moved into the lower region of the downward trend that began on October 8. The price, which found resistance at the 50 EMA (Blue Line) moving average, continues to remain in the lower region of the downward trend and is testing the $120.24 level as support. If the price closes below this level, the $112.26 level could be monitored. If there is an uptrend, it could test the 50 EMA moving average as resistance.
On the 4-hour chart, it remained below the 50 EMA (Exponential Moving Average – Blue Line) and 200 EMA (Black Line). This indicates a possible downtrend in the medium term. At the same time, the price being below both moving averages indicates that the asset is trending downward in the short term. The Chaikin Money Flow (CMF-20) has retreated to a neutral level. However, a slight decrease in money inflows could push the CMF into negative territory. The Relative Strength Index (RSI-14) fell from the positive zone to the middle of the negative level, encountering direct resistance that began on December 3. This signaled increased selling pressure. If there is an upturn due to macroeconomic data or positive news related to the Solana ecosystem, the $133.74 level stands out as a strong resistance point. If this level is broken upwards, the uptrend is expected to continue. If pullbacks occur due to developments in the opposite direction or profit-taking, the $112.26 level could be tested. A decline to these support levels could increase buying momentum, presenting a potential upside opportunity.
Supports: 120.24 – 112.26 – 100.34
Resistances: 127.21 – 133.74 – 138.73
DOGE/USDT
21Shares submitted its sixth amendment proposal for the Dogecoin ETF.
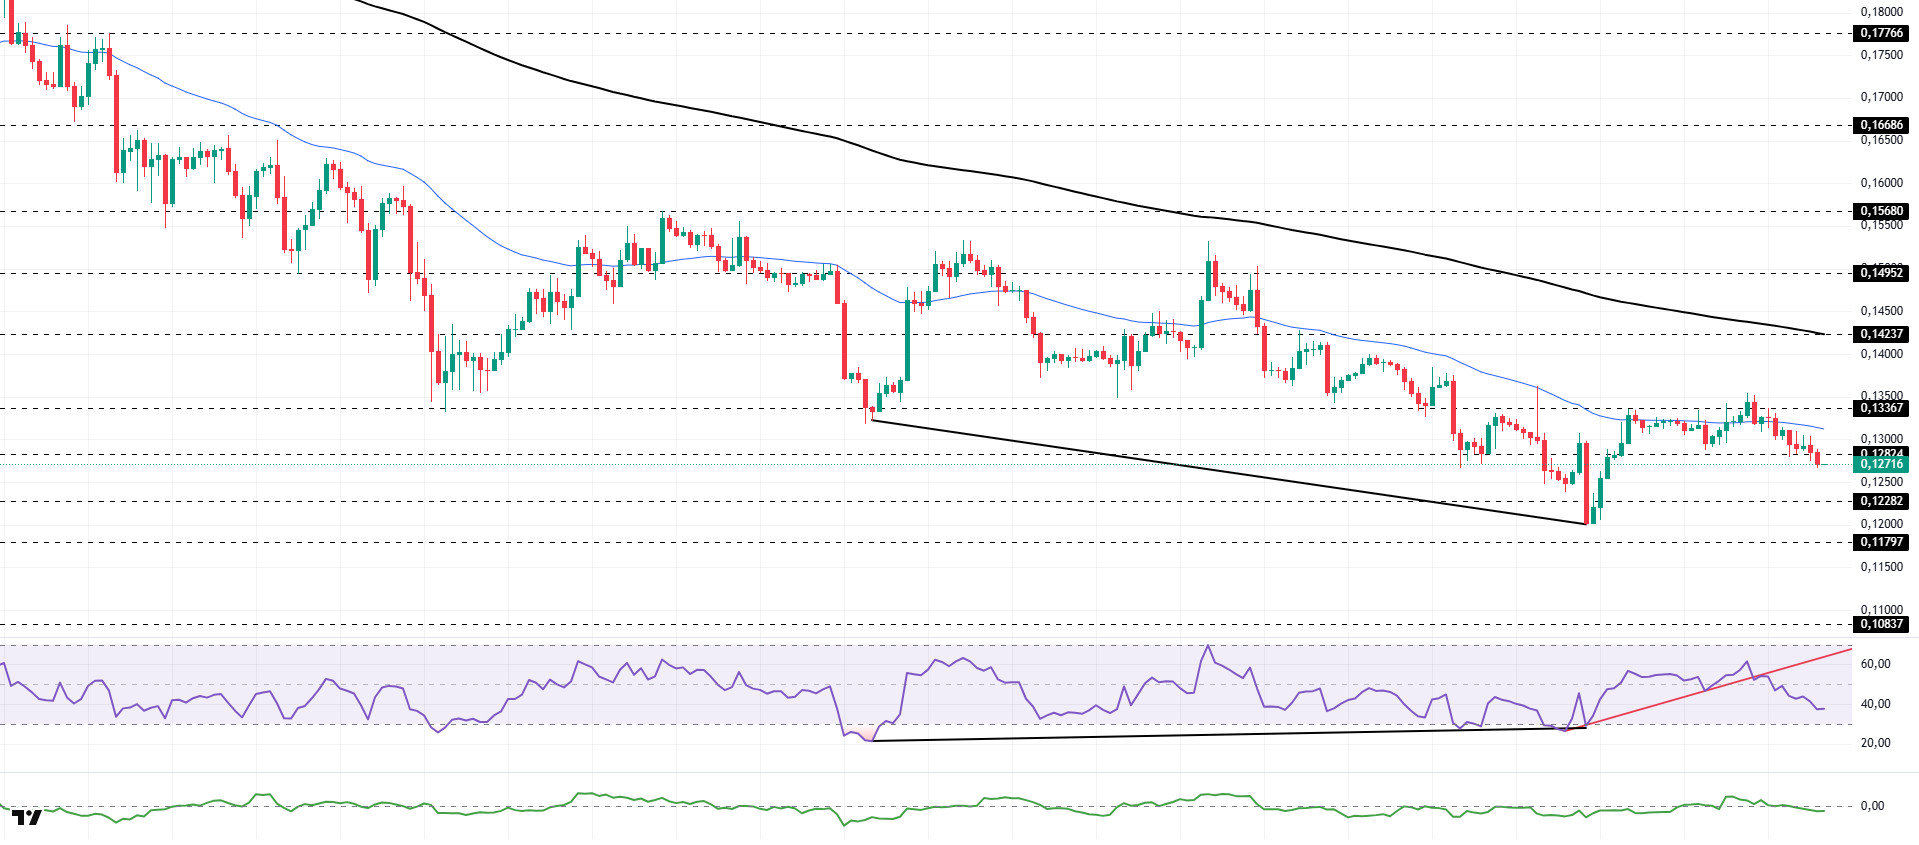
The DOGE price experienced a slight pullback. The asset remained below the 50 EMA (Blue Line) moving average, signaling continued pullback pressure. Unable to break through the strong resistance level of $0.13367, the price retreated and continued to trade below the 50 EMA moving average. If the pullback continues, it may retest the $0.12282 level as support. If it rallies, the $0.13367 level should be monitored.
On the 4-hour chart, the 50 EMA (Exponential Moving Average – Blue Line) remained below the 200 EMA (Black Line). This indicates that the downtrend may continue in the medium term. The price being below both moving averages indicates a downward trend in the short term. Chaikin Money Flow (CMF-20) moved into negative territory. Additionally, the decrease in money inflows could push CMF deeper into negative territory. The Relative Strength Index (RSI-14) remained in the negative zone. It also continued to stay below the rising line that began on December 18. This signaled that selling pressure persists. On the other hand, the positive divergence remains valid. In the event of a rise due to political developments, macroeconomic data, or positive news flow in the DOGE ecosystem, the $0.14237 level stands out as a strong resistance zone. Conversely, in the event of negative news flow, the $0.12282 level could be triggered. A decline to these levels could increase momentum and start a new wave of growth.
Supports: 0.12282 – 0.11797 – 0.10837
Resistances: 0.12824 – 0.13367 – 0.14237
LTC/USDT
Price movements in the Litecoin (LTC) / USDT pair ended the previous day with a 0.05% loss in value. At the same time, LTC gained 1.15% against Bitcoin, indicates that Litecoin performed strongly against Bitcoin despite general market movements. However, the long/short position ratio in the futures market over the last 24 hours stands at 0.9646, indicating that derivative market participants continue to expect LTC to decline.
A technical analysis of Litecoin’s 4-hour USDT pair shows that the price is trading below the 200, 100, and 50-period moving averages (purple, yellow, and orange lines, respectively). This outlook is consistent with the increase in short positions relative to long positions in the derivatives markets, confirming that the main trend remains downward.
However, the current structure also holds the potential to shift to a positive direction should it transition to a neutral outlook. In this scenario, the first strong resistance area that the upward movement may encounter is the 50-period moving average at the 77.12 level and the declining trend line around which the price continues to trade. This area, which is a horizontal resistance level, stands out as the first critical step towards a transition from a negative to a neutral outlook. If this level is exceeded, the 78.94 level will come to the fore as another important intraday falling trend resistance to watch. If the upward momentum gains traction and heads towards the 79.64 level, it is likely that the movement will remain limited in a pin bar formation, as seen in previous attempts, due to the effect of the 100-period moving average.
If the downward movement continues, the first important support level to watch is 75.78, which offers strong support. However, if this level is broken downwards, selling pressure is expected to increase, bringing the support levels of 74.20 and 72.71 into focus. The 74.20 level, in particular, has strong reaction potential due to its position in the middle band of the channel structure.
Supports: 75.78 – 74.20 – 72.71
Resistances: 77.12 – 78.94 – 79.64

BNB/USDT
From a technical perspective, BNB/USDT, which had been searching for support for a while, ended its downward momentum with the candlestick formations that formed and turned its direction back upward. With this recovery process, BNB broke the downward trend upward with the support provided by the new candlesticks and rose to the $930 level. Although limited pressure is observed in this region depending on market conditions, the overall positive outlook is maintained.
The current outlook for BNB/USDT is generally positive. However, the price moving within a horizontal band raises questions about which direction it will continue in the coming period. Upward price movements are expected to reinforce the current positive outlook.
Technical indicators for BNB, currently trading in the $830-$860 range, show that low trading volumes are limiting the upward momentum. In addition, the RSI indicator appears to be hovering at relatively low levels due to weak momentum.
According to the technical picture, if selling pressure increases, the price is expected to retest the $830 support level. If this level is broken, a pullback towards the $820 and $800 support zones will be on the agenda.
Conversely, if buying appetite is maintained and market momentum strengthens, BNB is expected to retest the $860 resistance level in the first stage. If this level is exceeded, it is likely that the falling trend line will be broken, and if the trend is broken and the price remains above this level, a rise towards the $880 and $905 levels appears technically possible.
Supports: 830 – 820 – 800
Resistances: 860 – 880 – 905

Legal Notice
The investment information, comments, and recommendations contained herein do not constitute investment advice. Investment advisory services are provided individually by authorized institutions taking into account the risk and return preferences of individuals. The comments and recommendations contained herein are of a general nature. These recommendations may not be suitable for your financial situation and risk and return preferences. Therefore, making an investment decision based solely on the information contained herein may not produce results in line with your expectations.

