
Technical Analysis
BTC/USDT
Statements from Fed members indicate that uncertainty regarding the extent of interest rate cuts persists and that recent data has prompted policymakers to adopt a more cautious stance, while Trump’s move regarding Greenland is drawing international attention in US domestic politics. On the geopolitical front, conflicting statements regarding Russia-Ukraine talks maintain uncertainty, while trading volume in global markets has noticeably declined in the final days of the year due to the holiday effect.
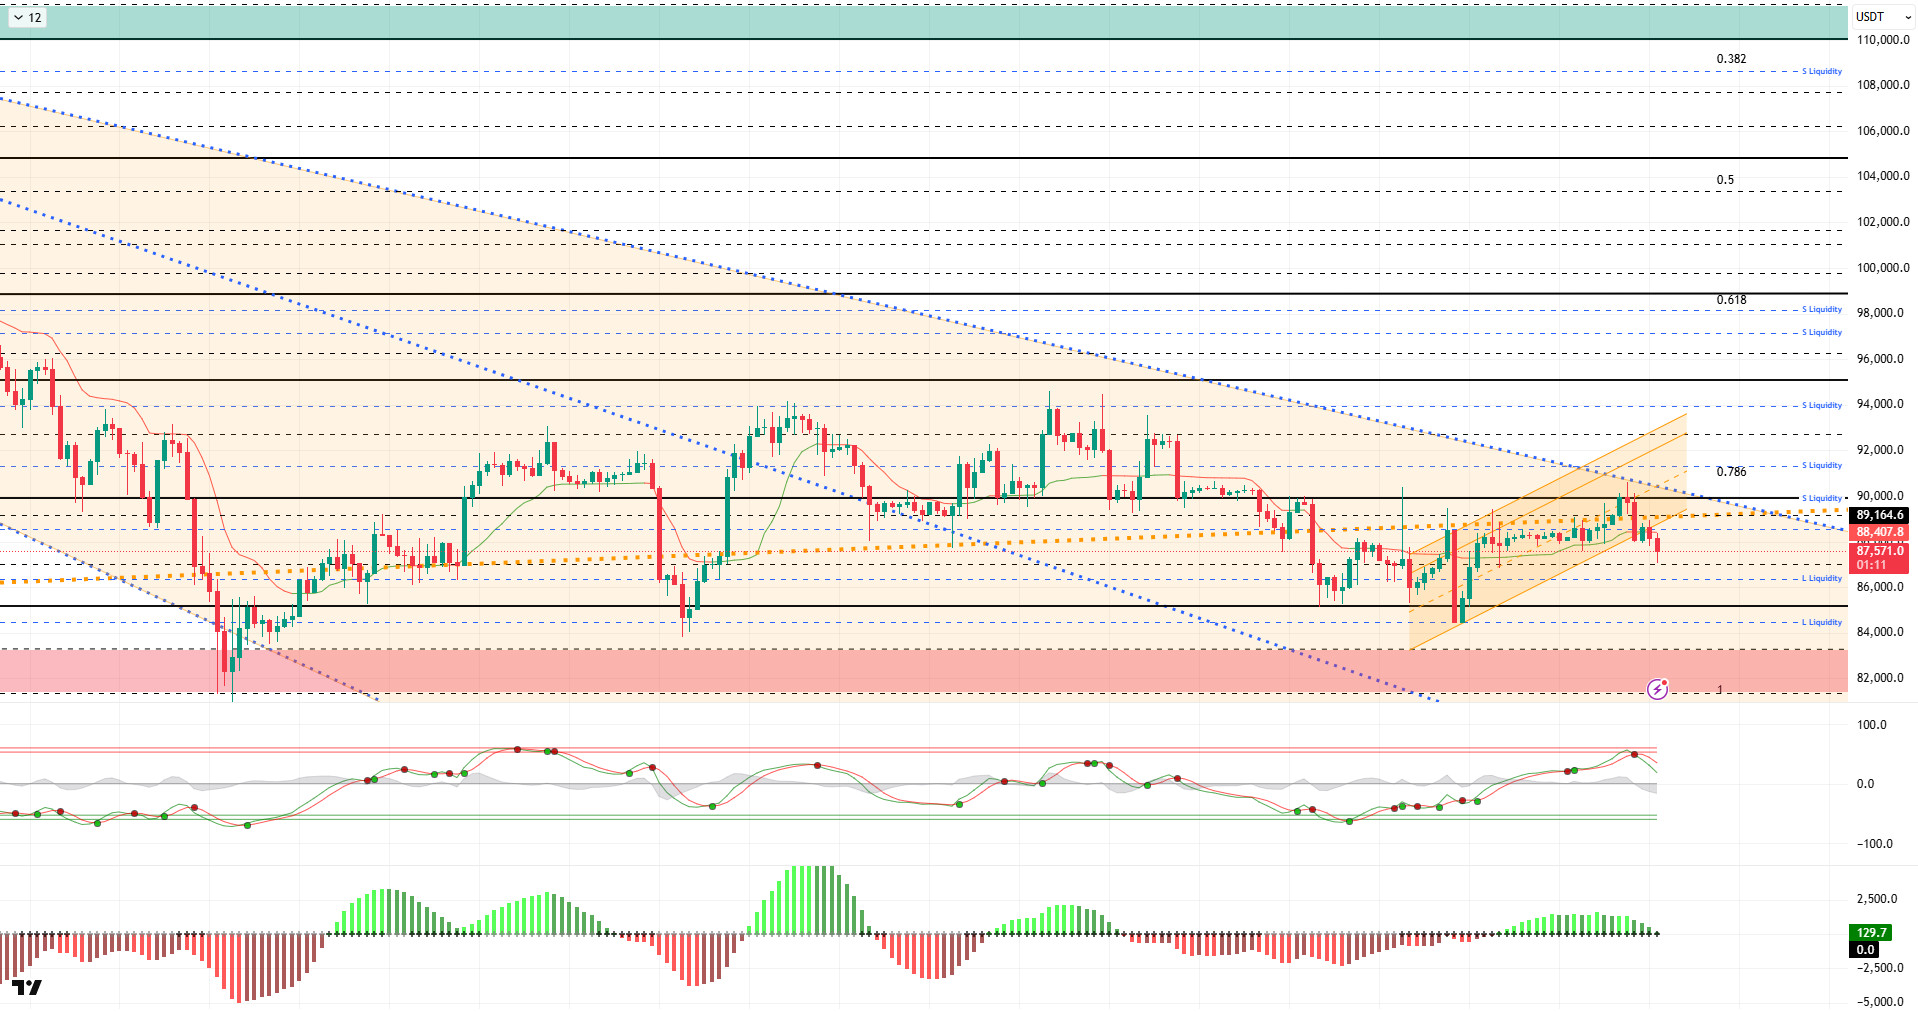
From a technical perspective, BTC lost the minor upward channel it had formed in the previous analysis and was rejected once again at the 90,000 level. Testing the upper resistance point in the narrowing orange band structure, the price failed to break through and fell back to the 87,000 level. Looking at the descending, horizontal, and ascending structures it has formed, the price appears indecisive and seems inclined to close 2025 negatively. Indeed, pricing below the 90,000 reference level is observed to increase selling pressure.
Technical indicators show that the Wave Trend (WT) oscillator, this time in the overbought zone, gave a sell signal, and the price recorded a decline. The histogram on the Squeeze Momentum (SM) indicator weakened significantly in the positive zone, aligning with the oscillator. The Kaufman Moving Average (KAMA) is currently trading just above the price level at $88,410.
When examining liquidation data, fragmented buy orders formed at the 84,000 and then 86,000 levels following the recent rise in BTC. In contrast, sell orders resulted in liquidation at the 90,000 level. In a broader time frame, intense accumulation continues above the 91,000 level.
In summary, following statements from Fed members, no interest rate cut is currently expected for January. On the global geopolitical front, Trump’s Greenland remarks and the Russia-Ukraine conflict are taking center stage. On the other hand, as we approach the end of the year, the Christmas lull is noticeable in the markets. Technically, BTC continues to price with the indecisive structures it has formed, and no clear upward movement has yet emerged. When liquidity data is examined, it is seen that areas with concentrated short-term transactions are being targeted, while long-term selling levels have not yet been tested.After this stage, the 89,000 level will be monitored as a critical point where the major upward trend passes through for the price to regain momentum. Closes and price action above this level are important indicators for regaining momentum. If selling pressure deepens, 86,000 emerges as a short-term liquidity area, while the 85,000 level is an important reference point.
Supports: 86,300 – 85,000 – 84,400
Resistances: 88,000 – 89,000 – 90,000 –
ETH/USDT
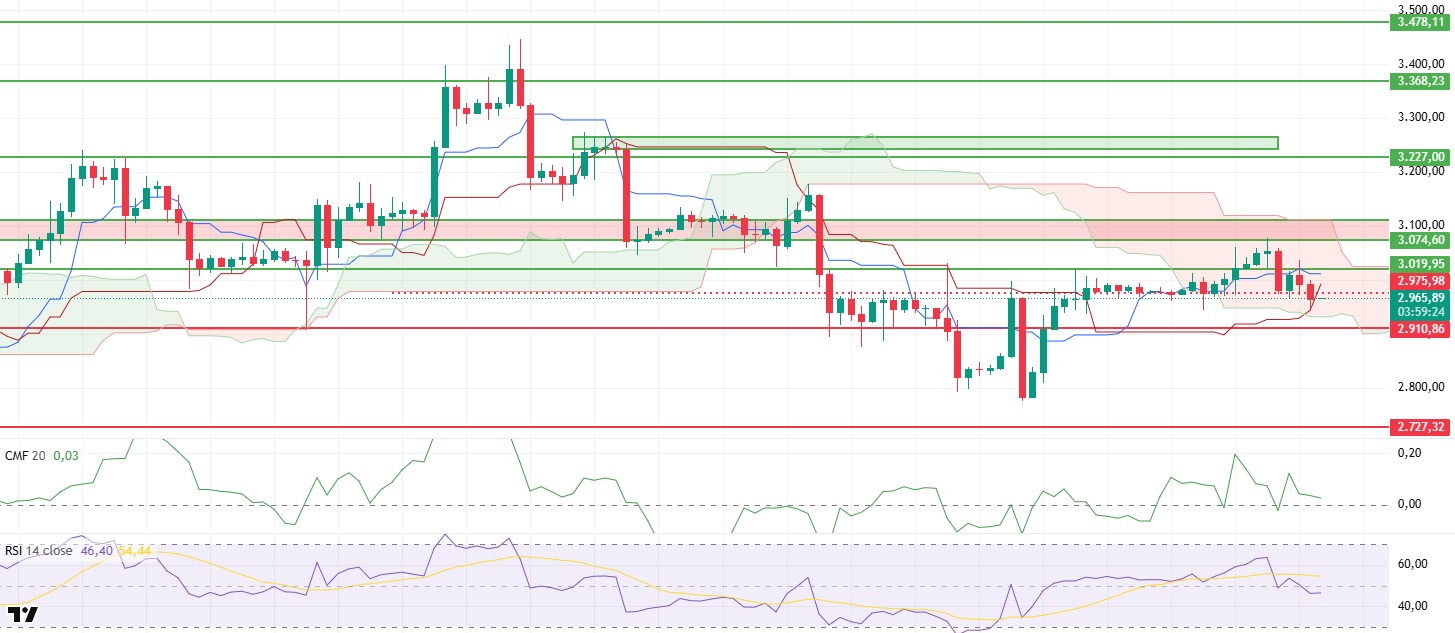
The ETH price continued its upward movement yesterday evening, rising to the $3,074 resistance level. As this region is technically a strong selling area, the price retreated with the resulting realization and fell below the $2,950 level in the morning. This pullback following the rally indicates that buyers are not losing strength, but rather encountering strong resistance.
The liquidity structure is not completely broken. Chaikin Money Flow (CMF) remains in positive territory despite sharp price fluctuations during the day. This outlook indicates that capital entering the market has not yet been withdrawn and that sales do not carry a panic atmosphere caused by liquidity. Despite liquidity being preserved, the loss of momentum is causing the price to remain under pressure in the short term.
On the momentum front, the weakening is clearly noticeable. The Relative Strength Index (RSI) has fallen sharply below the 50 level, indicating a weakening of buying momentum. This movement in the RSI suggests that upward demand has decreased in the short term and that the price is seeking to rebalance. Unless momentum recovers, attempts to rise may remain limited.
The technical structure presents a more neutral picture on the Ichimoku indicator. While the price continues to trade within the Kumo cloud, it is positioned below the Tenkan level and above the Kijun level. This structure does not produce a clear directional signal and points to a balance zone where breakouts should be monitored. The pricing within the cloud indicates that the lack of direction is continuing.
The short-term focus remains on the $3.019 level. The price may retest this area, but downward pressure is likely to persist unless this level is firmly broken. If the price manages to hold above $3.019, the technical outlook could regain strength. Otherwise, it would not be surprising to see the price fluctuate under pressure for a while longer.
Below the Form
Supports: 2,910 – 2,727 – 2,625
Resistances: 3,019 – 3,074 – 3,227
XRP/USDT
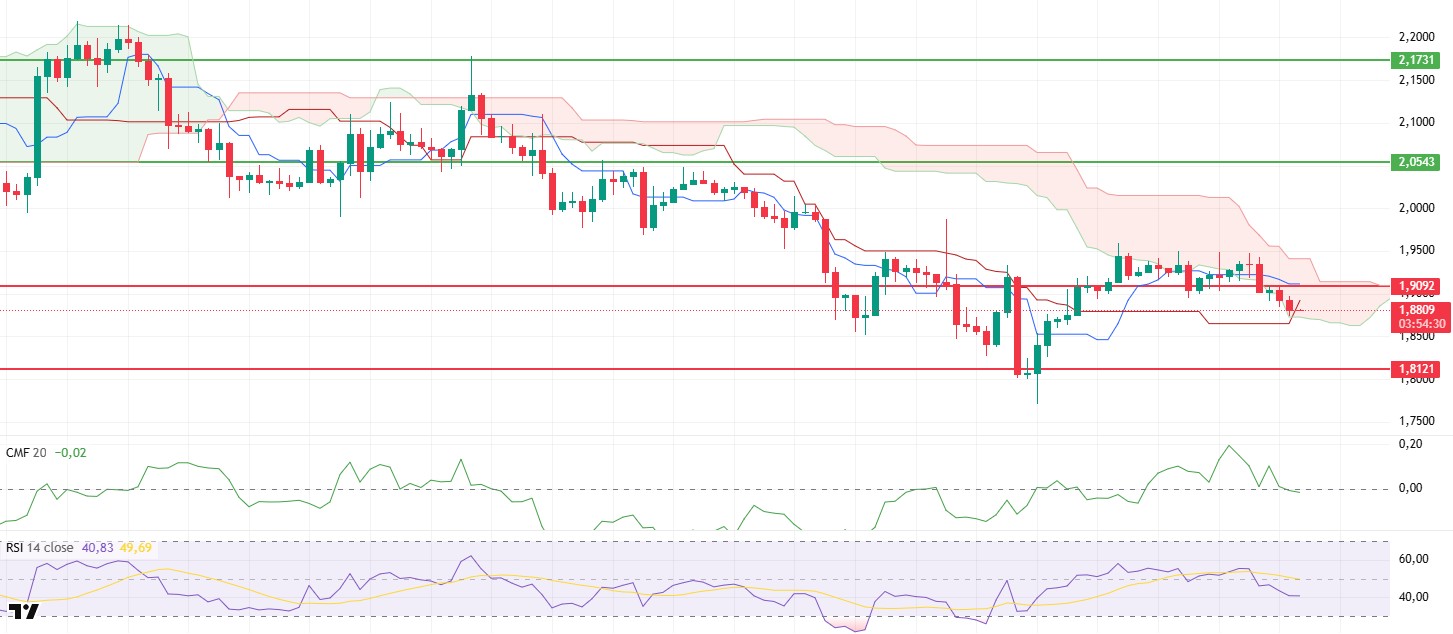
The XRP price began moving within a weakening structure after dipping below the $1.90 level yesterday evening and is attempting to hold near the lower band of the Kumo cloud. The current price continues to hover around $1.88, with buyers remaining cautious in this region. With the loss of the $1.90 level, the price’s search for direction has intensified on the downside, and upward attempts remain limited.
The liquidity outlook has deteriorated significantly. The Chaikin Money Flow (CMF) indicator has fallen into negative territory, signaling the beginning of liquidity outflows from the market. This structure stands out as one of the main reasons behind the weak pricing seen in recent hours. Unless liquidity regains strength, it seems difficult for the price to make sustained upward moves.
Pressure is also being felt on the momentum front. The Relative Strength Index (RSI) falling below the 50 level indicates a significant loss of momentum. This pullback in the RSI suggests that buyers have temporarily lost control and that sellers are more dominant in the short term. It may not be easy for the price to stabilize without a recovery in momentum.
The technical structure is also weakening on the Ichimoku indicator. Although the price manages to stay within the kumo cloud, the downward shift in the Tenkan and Kijun levels turns the short-term outlook negative. This positioning indicates that the price may encounter technical resistance in upward moves.
In the current chart, the decisive level in terms of direction remains at $1.90. Unless this region is regained, downward pressure is likely to continue, and the price may linger at lower levels. If $1.90 is breached again, the current negative outlook may weaken, and the price could enter a recovery process, albeit limited. At this stage, when liquidity, momentum, and technical structure are evaluated together, a cautious outlook is warranted for XRP.
Supports: 1.9092 – 1.8121 – 1.6224
Resistances: 2.0543 – 2.1731 – 2.2729
SOL/USDT
Circle minted an additional $500 million in USDC on the Solana network.
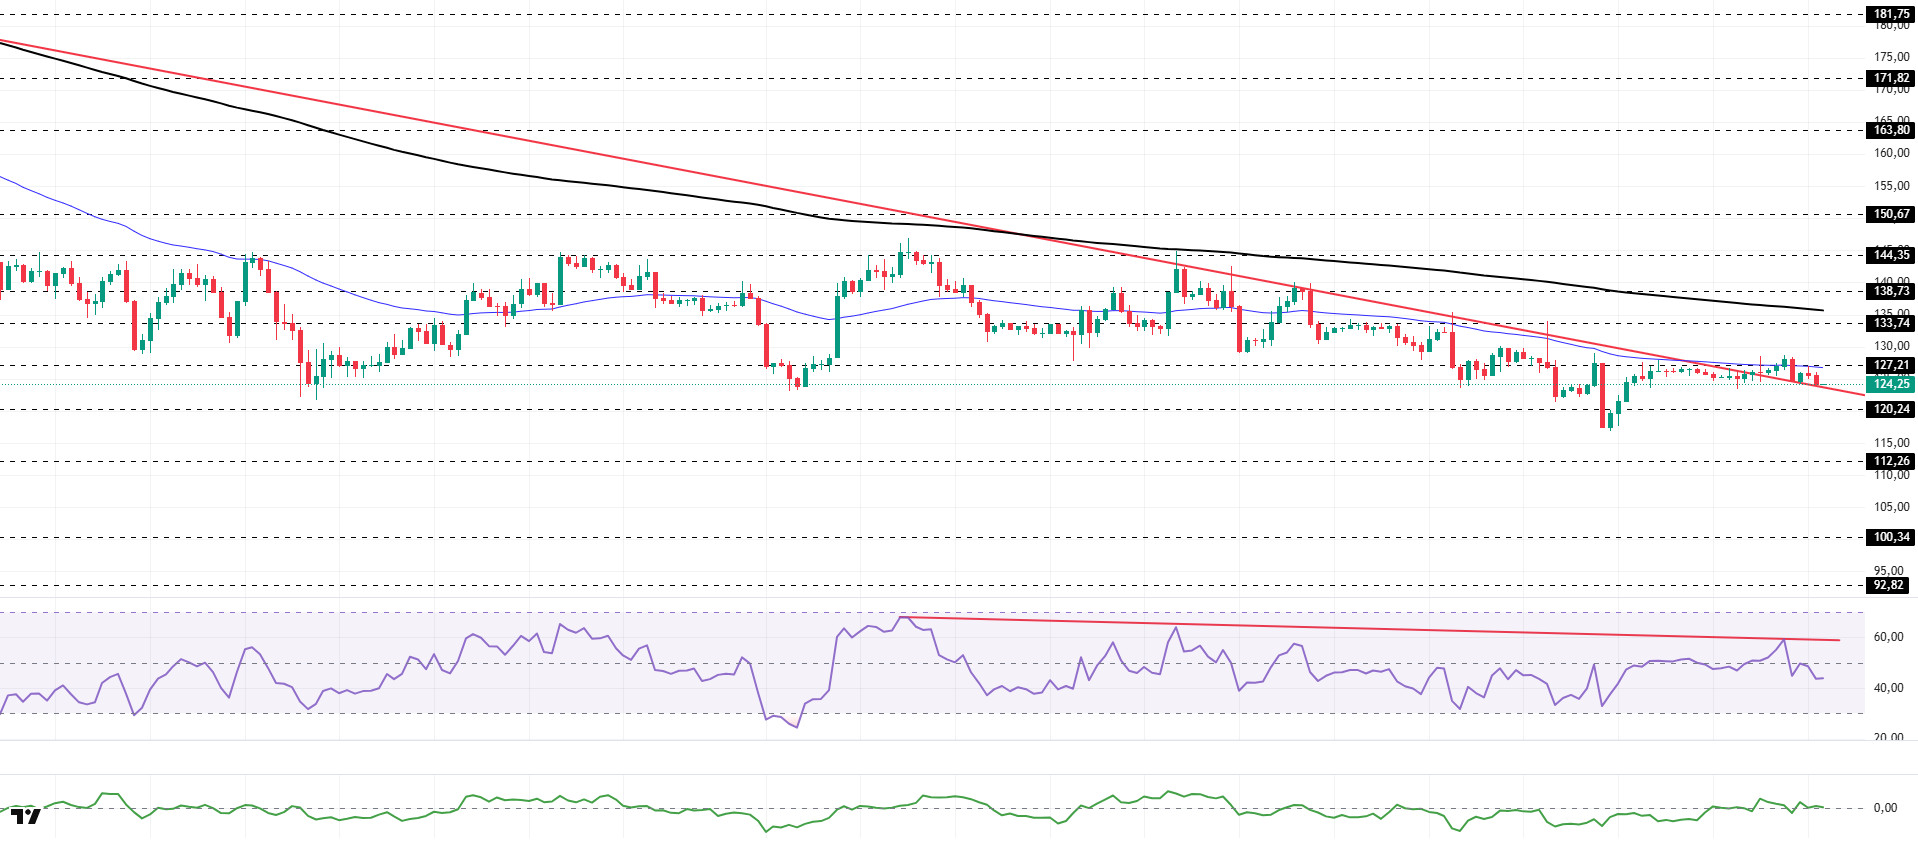
The SOL price showed a slight decline. The asset continued to trade in the upper region of the downtrend that began on October 8. The price, which retreated after encountering resistance from the 50 EMA (Blue Line) moving average, is currently testing the downtrend as support. If the price closes below this level, the $120.24 level could be monitored. In the event of an uptrend, it may test the 200 EMA (Black Line) moving average as resistance.
On the 4-hour chart, it continued to remain below the 50 EMA (Exponential Moving Average – Blue Line) and 200 EMA (Black Line). This indicates that it may be in a downtrend in the medium term. At the same time, the price being below both moving averages indicates that the asset is trending downward in the short term. The Chaikin Money Flow (CMF-20) remained in positive territory. However, a slight decrease in money inflows could push the CMF to neutral levels. The Relative Strength Index (RSI-14) fell from the positive zone to the negative level after encountering direct resistance starting on December 3. This signaled increased selling pressure. If there is an upturn due to macroeconomic data or positive news related to the Solana ecosystem, the $138.73 level stands out as a strong resistance point. If this level is broken upwards, the uptrend is expected to continue. If pullbacks occur due to developments in the opposite direction or profit-taking, the $112.26 level could be tested. A decline to these support levels could increase buying momentum, presenting a potential upside opportunity.
Supports: 120.24 – 112.26 – 100.34
Resistances: 127.21 – 133.74 – 138.73
DOGE/USDT
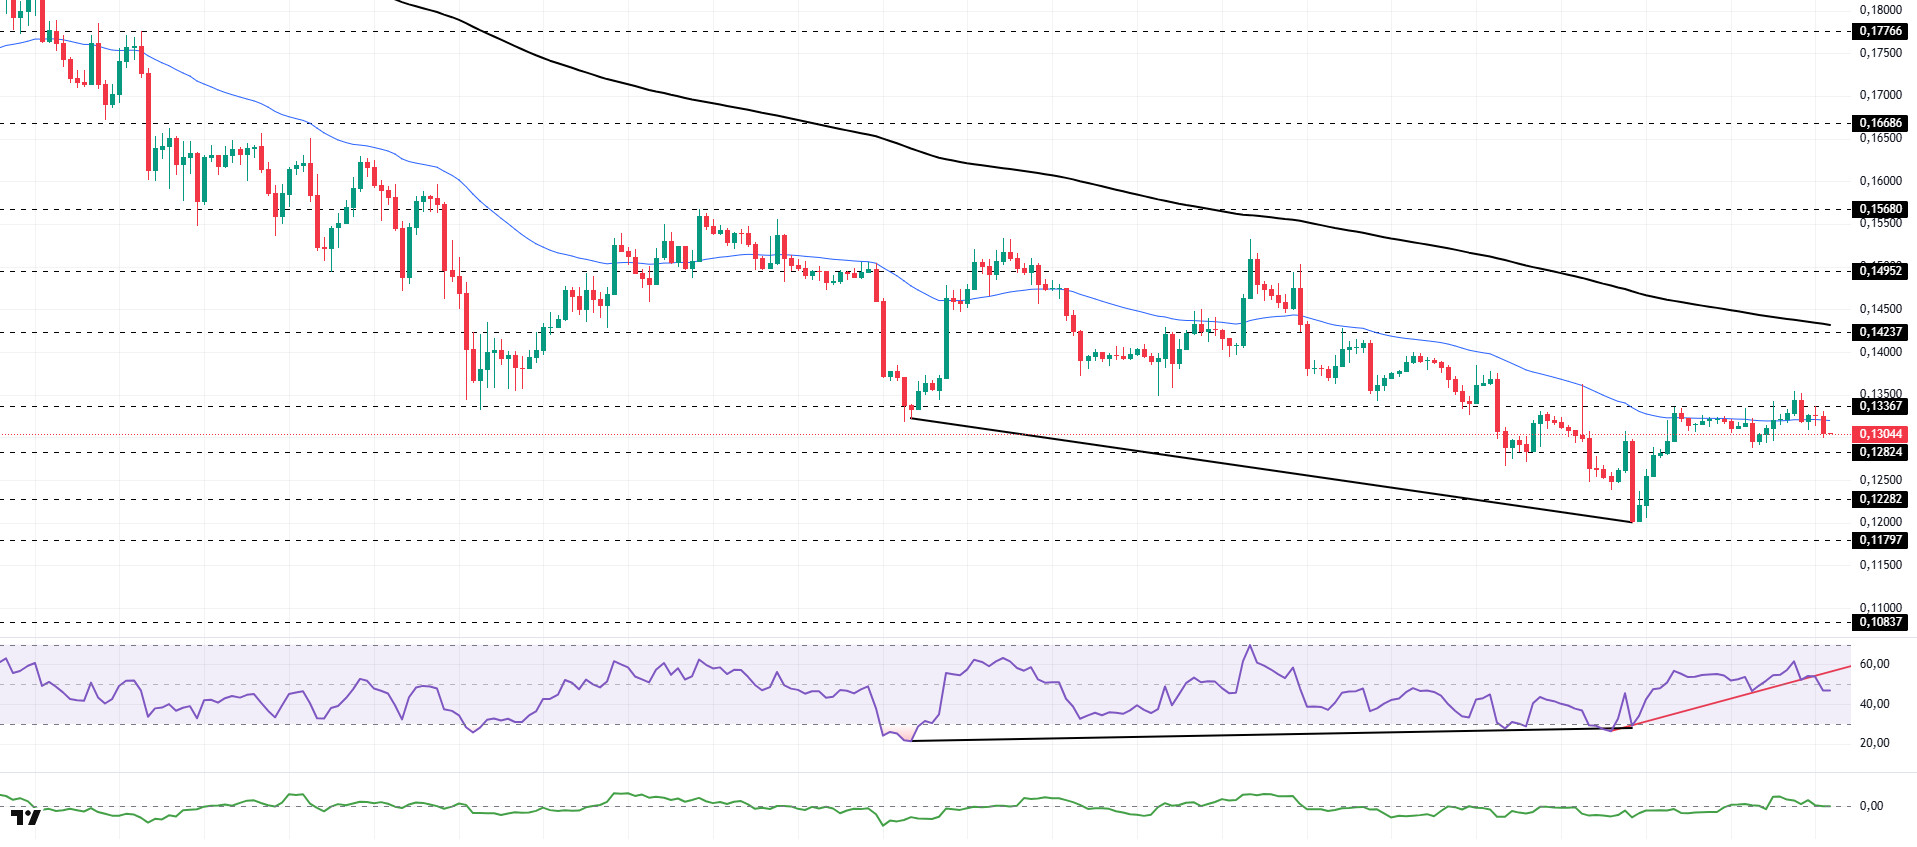
The DOGE price showed a slight decline. The asset crossed below the 50 EMA (Blue Line) moving average, signaling a pullback. Unable to break through the strong resistance level of $0.13367, the price retreated and is currently trading below the 50 EMA moving average. If the pullback continues, it may retest the $0.12824 level as support. If it rallies, the $0.13367 level should be monitored.
On the 4-hour chart, the 50 EMA (Exponential Moving Average – Blue Line) remained below the 200 EMA (Black Line). This indicates that the downtrend may continue in the medium term. The price being below both moving averages indicates a downward trend in the short term. The Chaikin Money Flow (CMF-20) has retreated to a neutral level. Additionally, a decrease in money inflows could push the CMF into negative territory. The Relative Strength Index (RSI-14) has also retreated to negative territory. At the same time, it has moved into the lower region of the upward trend that began on December 18. This indicates increased selling pressure. On the other hand, the positive divergence remains valid. In the event of potential increases driven by political developments, macroeconomic data, or positive news flow within the DOGE ecosystem, the $0.14237 level stands out as a strong resistance zone. Conversely, in the event of negative news flow, the $0.12282 level could be triggered. A decline to these levels could increase momentum and initiate a new wave of growth.
Supports: 0.12824 – 0.12282 – 0.11797
Resistances: 0.13367 – 0.14237 – 0.14952
LTC/USDT
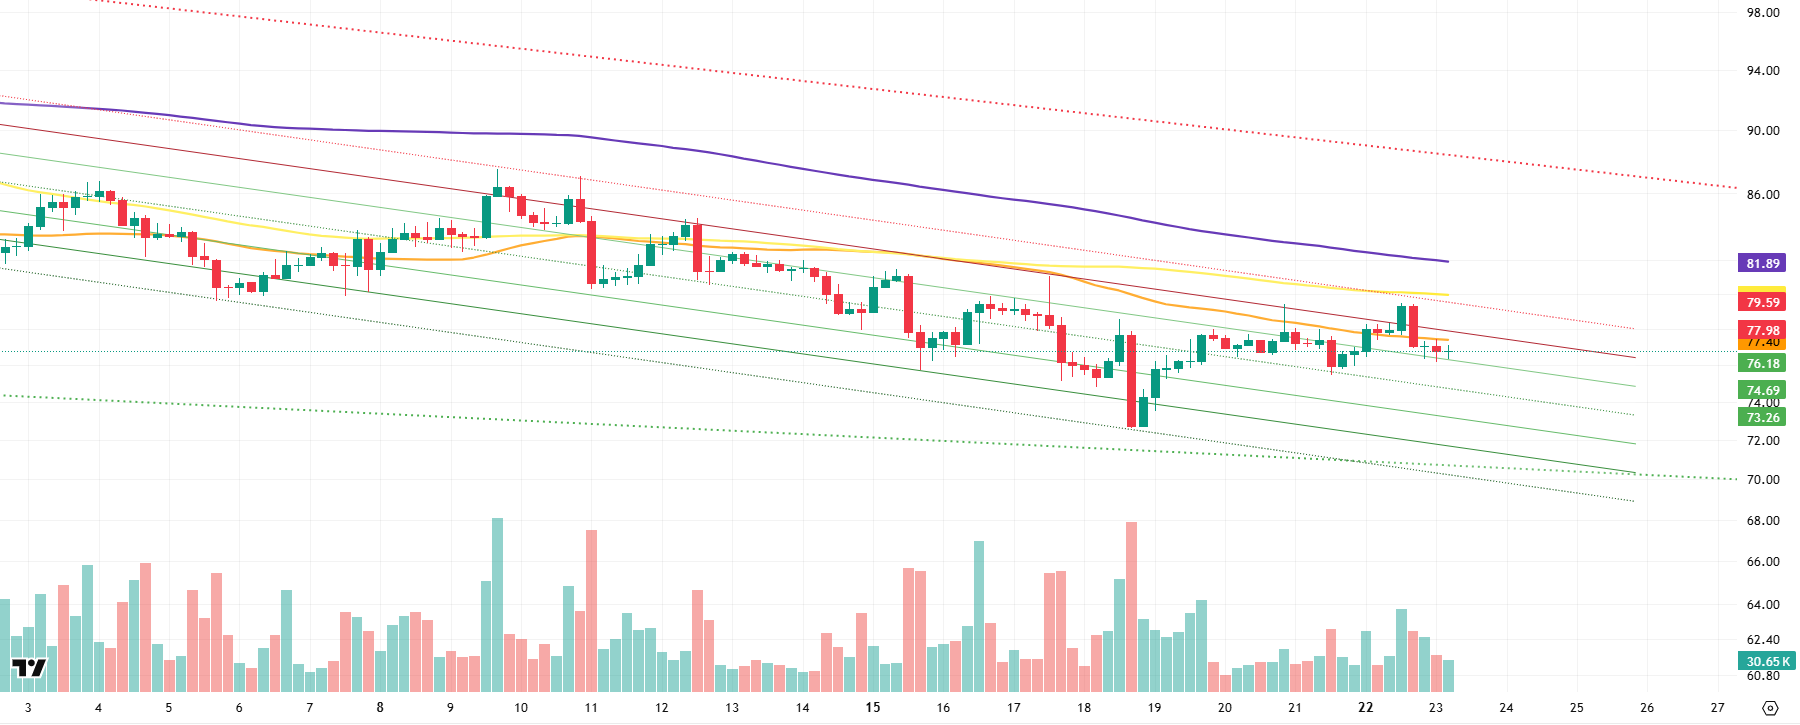
Price movements in the Litecoin (LTC) / USDT pair ended the previous day with a 0.34% increase in value. At the same time, LTC gained 0.46% against Bitcoin, indicating that Litecoin performed relatively stronger against Bitcoin despite general market movements. On the futures front, the long/short position ratio over the last 24 hours standing at 0.9461 indicates that bearish expectations among derivatives market participants are gaining strength again.
A technical analysis of Litecoin’s 4-hour USDT pair shows that the price is trading below the 200, 100, and 50-period moving averages (purple, yellow, and orange lines, respectively). This outlook is consistent with the increase in short positions relative to long positions in the derivatives markets, confirming that the main trend has regained downward momentum.
However, the current structure also holds the potential to transition to a neutral outlook and potentially evolve into a positive one. In this scenario, the first strong resistance level that the upward movement may encounter is expected to be the 50-period moving average at the 77.40 level. This level, which is a horizontal resistance, stands out as the first critical step towards neutralizing the negative outlook. If this level is breached, 77.98 will come into focus as another important falling trend resistance to monitor intraday. Should the uptrend gain momentum and head towards the 79.59 level, it is likely that the movement will remain limited, as seen in previous attempts, due to the influence of the 100-period moving average.
If the decline continues, the first important support level is monitored at 76.18. The possibility of this region also being a retest area provides a stronger structure in terms of support. However, if a downward breakout occurs, selling pressure is expected to increase, bringing the support levels of 74.69 and 73.26 into focus. The 73.26 level, in particular, holds strong reaction potential as it is located in the middle of the channel structure.
Supports: 76.18 – 74.69 – 73.26
Resistances: 77.40 – 77.98 – 79.59
BNB/USDT
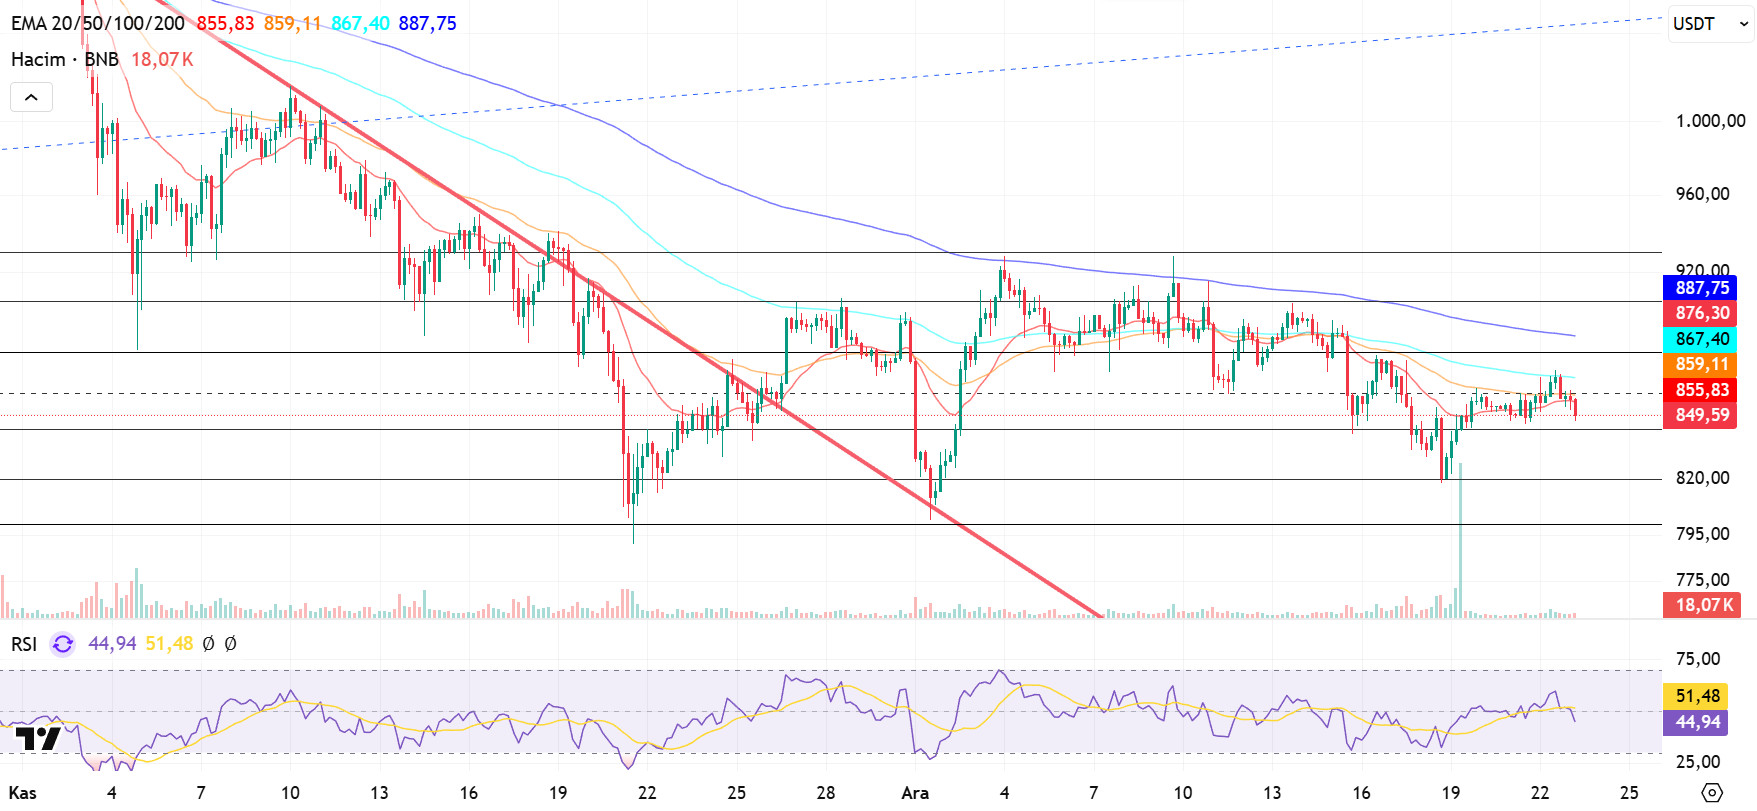
From a technical perspective, BNB/USDT, which had been searching for support for a while, ended its downward momentum with the candlestick formations that formed and turned its direction upward again. With this recovery process, BNB broke the downward trend upward with the support provided by the new candlesticks and rose to the $940 level. Although limited pressure is observed in this region depending on market conditions, the overall outlook remains positive.
The current outlook for BNB/USDT is generally positive. However, the price moving within a horizontal band raises questions about which direction it will continue in the coming period. Upward price movements are expected to reinforce the current positive outlook.
Technical indicators for BNB, currently trading in the $845-$880 range, show that low trading volumes are limiting the upward momentum. In addition, the RSI indicator appears to be hovering at relatively low levels due to weak momentum.
According to the technical picture, if selling pressure increases, the price is expected to retest the $845 support level. If this level is broken, a pullback towards the $820 and $800 support zones will be on the agenda.
Conversely, if buying appetite is maintained and market momentum strengthens, BNB is expected to retest the $880 resistance level in the first stage. If this level is exceeded, it is likely that the falling trend line will be broken, and if the trend is broken and the price remains above this level, a rise towards the $905 and $930 levels appears technically possible.
Supports: 845 – 820 – 800
Resistances: 880 – 905 – 930
Legal Notice
The investment information, comments, and recommendations contained herein do not constitute investment advice. Investment advisory services are provided individually by authorized institutions taking into account the risk and return preferences of individuals. The comments and recommendations contained herein are of a general nature. These recommendations may not be suitable for your financial situation and risk and return preferences. Therefore, making an investment decision based solely on the information contained herein may not produce results in line with your expectations.

