
Fear & Greed Index
Source: Alternative
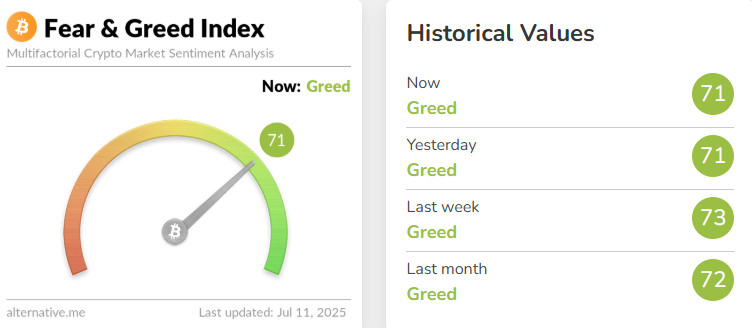
Change in Fear and Greed Value: -2
Last Week’s Level: 73
This Week’s Level: 71
The Fear and Greed Index fell from 73 to 71 this week, indicating a limited decline in market sentiment. In the US, the robustness of the labor market continued. Weekly jobless claims fell to 227K, below expectations (235K) and hit a 7-week low. This showed that economic activity was resilient. However, the minutes of the Fed’s June meeting emphasized the risks of tariffs on inflation and indicated that there may not be a rate cut in July. This cautious message weakened markets’ expectations for an early easing. On the trade front, Treasury Secretary Bessent postponed the new tariffs, which expired on July 9, until August and announced that negotiations with countries were ongoing, which eased demand concerns to some extent. On the other hand, President Trump’s announcement that he would raise tariffs on a wide range of products including copper, pharmaceuticals and semiconductors from the current 10 percent level increased global uncertainty. On the regulatory front, the SEC’s new guidance for crypto ETF applications was an important step towards speeding up approvals by standardizing the listing process for funds linked to various crypto assets ranging from Solana to XRP, reducing uncertainty in the sector. The US House also declared July 14-18 as “Crypto Week” and announced that it is preparing to discuss digital asset legislation. This development kept the expectation of increased institutional interest in the crypto sector alive. BTC also hit a new all-time high of 117,500. As a result, there was a partial pullback in risk appetite as investors weighed regulatory clarity and strong employment data against ongoing trade tensions. Nevertheless, the index still remains at a high level, indicating that the markets remain generally optimistic.
Fund Flows
Source: CoinShares
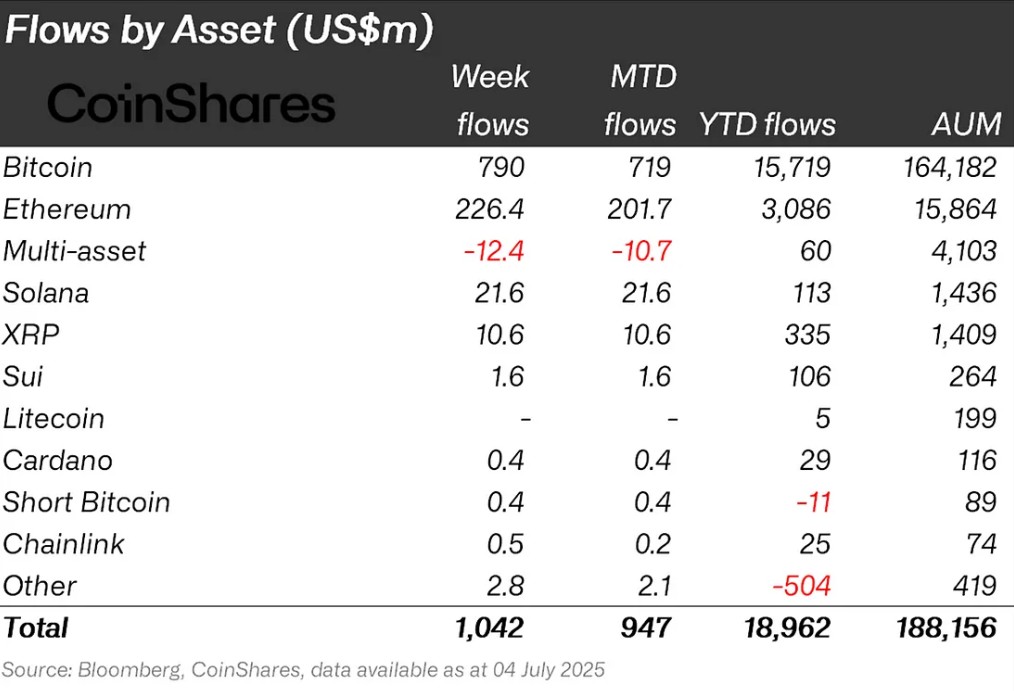
Overview The crypto market rebounded strongly on the back of easing macroeconomic uncertainties and positive news on interest rate cut expectations. The end of the long-standing Iran-Israel tension in the Middle East and Trump’s pressure for an interest rate cut were among the factors that supported the markets. As a result of all these developments, Bitcoin gained about 9%.
Fund Inflows:
Bitcoin (BTC): The ongoing geopolitical tension in the Middle East, the US President’s rhetoric on interest rate cuts and the positive atmosphere observed in the market supported investor confidence and paved the way for increased fund inflows. While these developments created a general relaxation in the markets, they also contributed to maintaining interest in Bitcoin and altcoins. As a matter of fact, inflows to Bitcoin funds reached $790 million this week.
Ethereum (ETH): Spot ETH performed strongly on the back of institutional interest and fund inflows. This week, Ethereum saw inflows of $226.4 million.
Short Bitcoin: Inflows into short bitcoin positions totaled $0.4 million.
Litecoin (LTC): A partnership was formed between Mastercard and Chainlink that will allow cardholders to purchase crypto using on-chain liquidity. Ltc saw a fund inflow of $0.2 million this week.
Ripple (XRP): ipple recently confirmed a new custody services agreement with Bank of New York Mellon for stablecoin reserves pegged to the US dollar. Fund inflows in Xrp this week totaled $10.6 million.
Solana (SOL): The first Solana staking ETF (SSK) to begin trading in the U.S. marked an important milestone for Solana, receiving $12 million on its first day. Solana saw inflows of $21.6 million.
Cardano (ADA): The Cardano network is preparing for a major update known as the Chang hard fork. This update will bring features that support decentralization, such as the creation of annual budgets, a treasury, and a governance model that strengthens community-driven decision-making, which has caused great excitement in the community. Cardano saw $0.4 million inflows this week.
Chainlink (LINK): Chainlink has made significant strides in its goal to gain market share by partnering with major financial institutions such as UBS Asset Management and Swift for tokenized funding deals. Link saw an inflow of $0.5 million this week on the announcement of this collaboration.
SUI: Cetus introduced the ‘Cetus Pro’ Beta to enhance token trading on the Sui network. Sui saw $1.6 million in inflows this week.
Other: Altcoins saw sectoral and project-based rallies. These attacks led to an inflow of $2.8 million in fund flow data.
Fund Outflows:
Multi-asset: Despite ETF data, it also caused outflows in the multi-asset group
Total MarketCap
Source: Tradingview
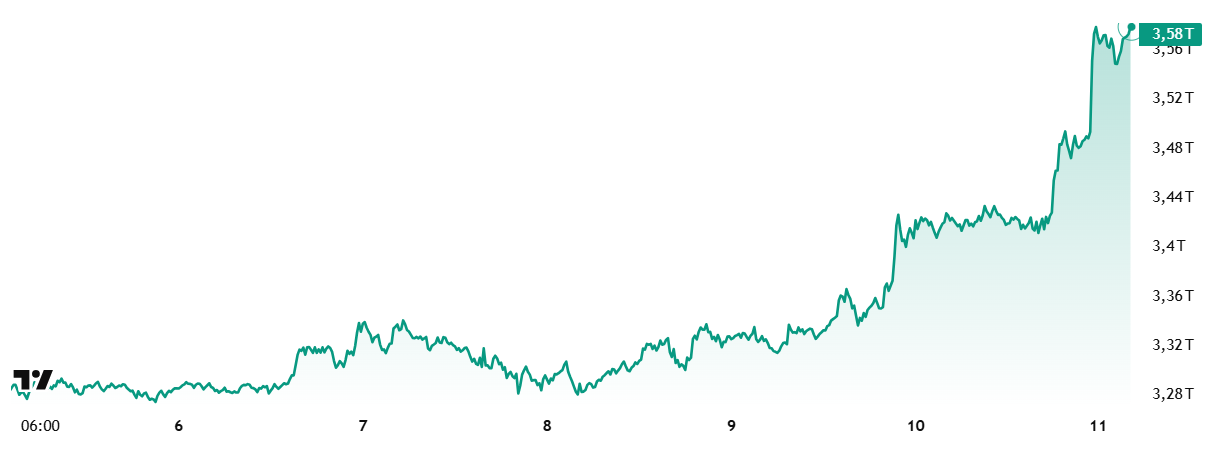
- Last Week Market Capitalization: 33 trillion Dollars
- Market Capitalization This Week: 58 trillion Dollars
The cryptocurrency market showed an increase of approximately 7.26% in total market capitalization with a capital inflow of 243 billion dollars this week. Thus, the total market capitalization increased to 3.57 trillion dollars. This development, along with the third consecutive positive trend after last week’s close, is an important signal that the upward trend continues. The distance from current levels to the all-time high market capitalization of $3.73 trillion seems quite small. If this momentum is maintained and consecutive positive closes continue in the coming weeks, it is quite possible that this region will be surpassed. This strengthening in market structure indicates that investor sentiment has turned positive and risk appetite is on the rise again.
Total 2
Total 2 started the new week with a market capitalization of $1.15 trillion and rose by about 9.2% during the week, recording a value increase of $106 billion. With this rise, the Total 2 market capitalization reached 1.26 trillion dollars. In order for the Total 2 index to reach its peak again, it needs to gain more than 30%. This suggests a weaker performance compared to Bitcoin since its previous high.
Total 3
The Total 3 index started the week at 844.04 billion dollars. With capital inflows of approximately $61.94 billion during the week, the total market capitalization increased by approximately 7.1% to $906 billion.
This rise indicates that investor interest is predominantly focused on Ethereum. At the same time, it can be said that the upward movement across the market is not yet broad-based and risk appetite is largely concentrated in highly liquid assets. On the other hand, it is quite likely that the new peak realized on bitcoin will have a positive impact on altcoins in the coming period.
Bitcoin Dominance
Bitcoin Dominance
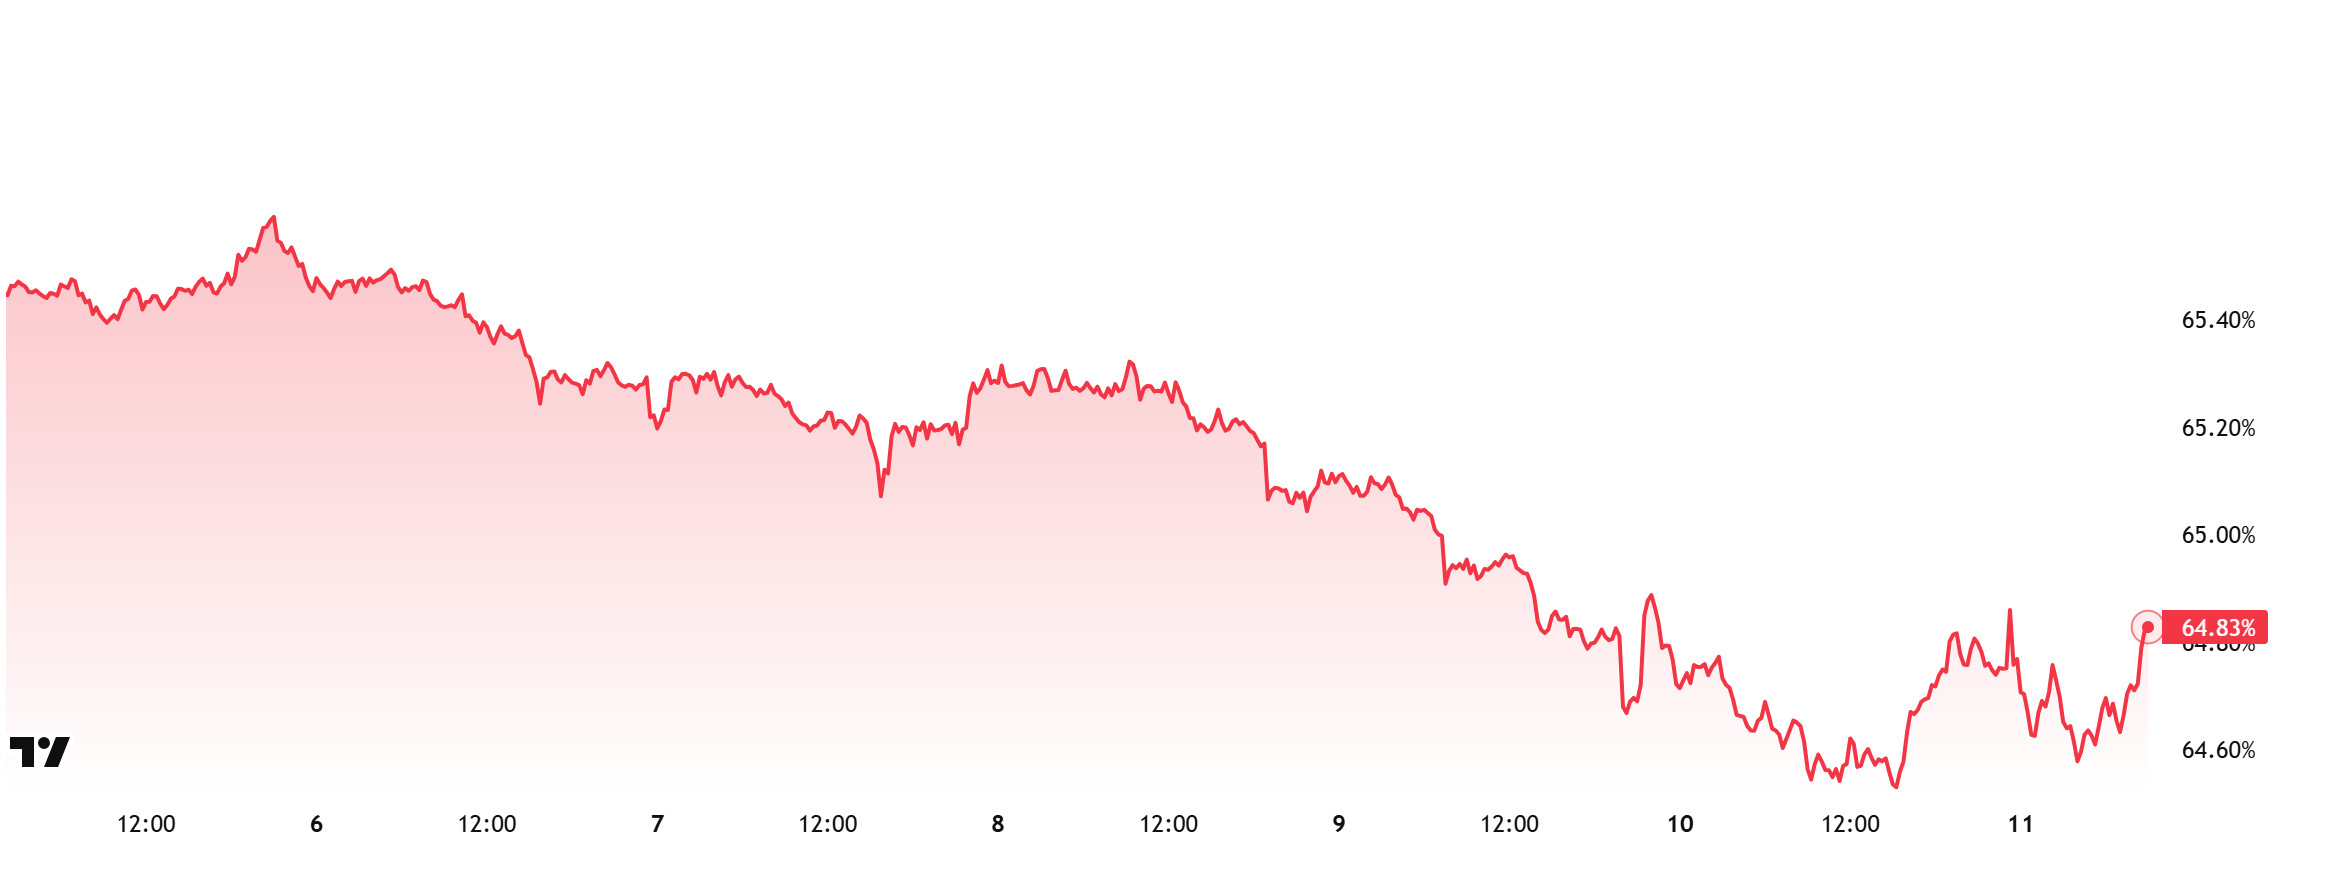
Bitcoin dominance, which started the week at 65.30%, fell to 64.64% during the week. The dominance recovered slightly after this decline and is currently at 64.83%.
This week, 2,205 Bitcoins were purchased by Metaplanet and 116 Bitcoins were purchased by The Blockchain Group, Europe’s first Bitcoin treasury company.
Data on Bitcoin spot ETFs show a total net inflow of $1.69 billion so far.
Following Trump’s statements on tariffs, the risk appetite in the markets increased. This development led to an increase in investor confidence and accelerated capital inflows. The steady demand from institutional investors, continued strong net capital inflows to spot Bitcoin ETFs and reduced global uncertainty pave the way for an improvement in risk perception across the market and a reorientation of capital towards digital assets. Increased risk appetite is leading to capital being allocated not only to Bitcoin, but also to Ethereum and other altcoins. If Ethereum and other altcoins outperform Bitcoin, this could reduce Bitcoin’s market dominance. Depending on these developments, Bitcoin dominance can be expected to consolidate in the 63% – 65% band next week.
Ethereum Dominance
Source: Tradingview
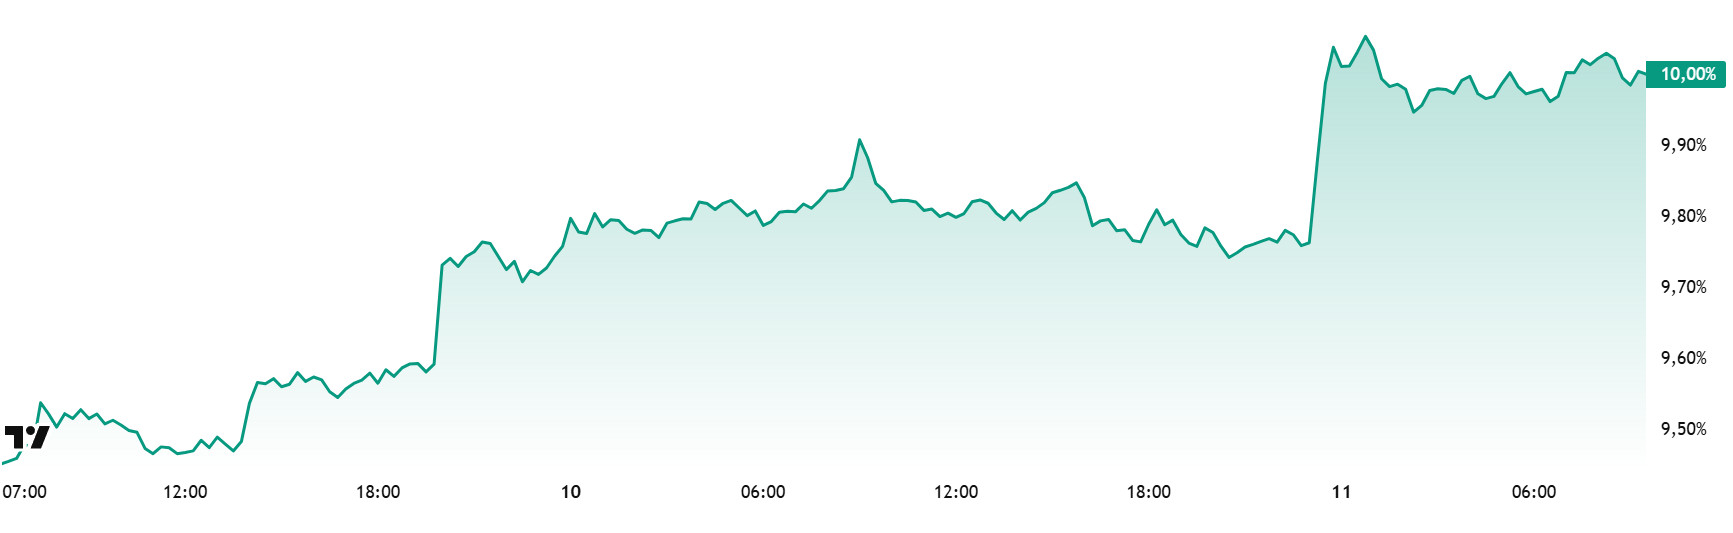
Weekly Change:
- Last Week’s Level: 9.33%
- This Week’s Level: 10%
Ethereum dominance, which rose as high as 10% as of the second week of June, failed to cross this critical threshold and retreated to 8.60%. However, the dominance, which found support at these levels, regained a positive momentum and exhibited an upward trend in the last three weeks.
In the current week, it has been observed that upward movements in Ethereum dominance continue. Accordingly, while Ethereum dominance completed last week at 9.33%, it is trading at around 10% as of current data.
In the same period, Bitcoin dominance, unlike Ethereum, showed a negative outlook and exhibited a downward trend.
Looking at the key developments supporting this recovery in Ethereum dominance; The US Securities and Exchange Commission (SEC) confirmed that Truth Social has officially received the Ethereum ETF application. In addition, BTCS Inc. announced that the targeted funding amount for Ethereum staking and block production activities has been increased to $225 million. On the other hand, Ethereum co-founder Joseph Lubin stated that holding Ethereum in institutional treasuries is a driver of ecosystem growth.
Bitcoin Spot ETF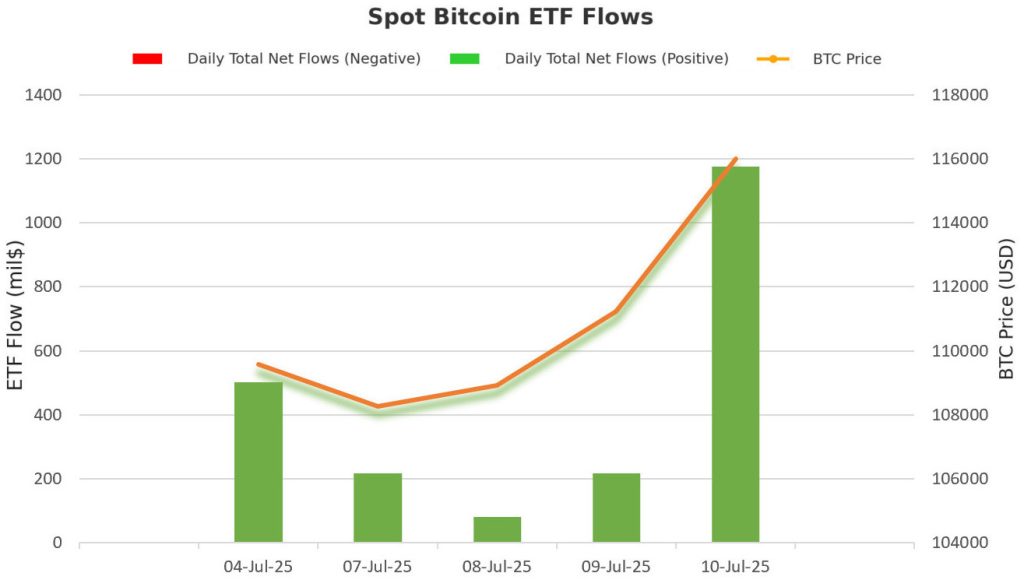
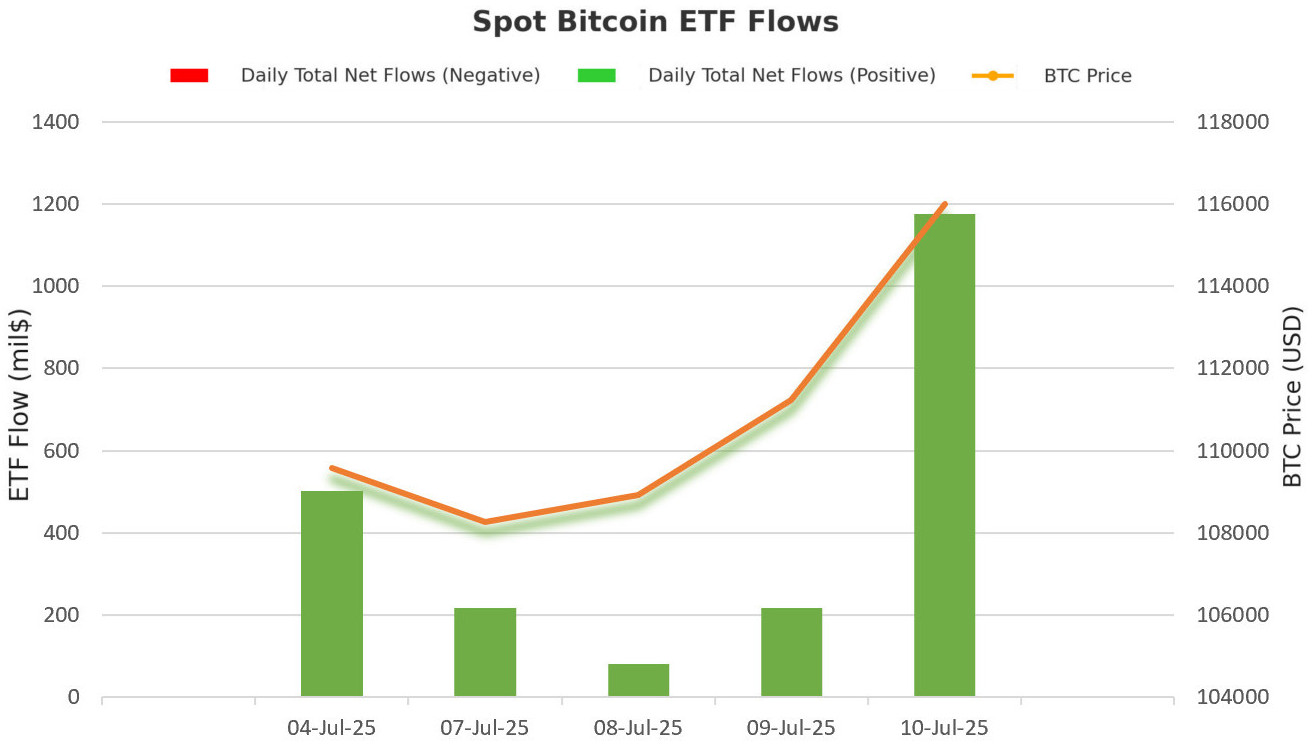
NetFlow Status: Between July 04-10, 2025, Spot Bitcoin ETFs saw a total net inflow of $2.189 billion. The largest net inflow during this period was on July 10, with a massive inflow of $1.175 billion. It was the second largest daily net inflow since the launch of ETFs. Net inflows of $805.5 million into BlackRock’s IBIT ETF, $399.9 million into Fidelity’s FBTC ETF and $315.6 million into ARK’s ARKB ETF stood out.
Bitcoin Price: Bitcoin, which started at $109,584 between July 04-10, 2025, closed the week at $116,010, gaining 5.86%. The 4.29% daily increase on July 10 created a remarkable synchronization in both price and ETF flows. The move also paved the way for a new ATH level.
Cumulative Net Inflows: Spot Bitcoin ETFs’ total cumulative net inflows rose to $51.31 billion at the end of the 374th trading day.
| DATE | COIN | PRICE (Open) | PRICE (Close) | Change % | ETF Flow (mil$) |
|---|---|---|---|---|---|
| 04-Jul-25 | BTC | 109,584 | 107,984 | -1.46% | 501.2 |
| 07-Jul-25 | BTC | 109,203 | 108,262 | -0.86% | 216.5 |
| 08-Jul-25 | BTC | 108,262 | 108,922 | 0.61% | 80.1 |
| 09-Jul-25 | BTC | 108,922 | 111,233 | 2.12% | 215.7 |
| 10-Jul-25 | BTC | 111,233 | 116,010 | 4.29% | 1175.6 |
| Total for 04 – 10 Jul 25 | 5.86% | 2189.1 | |||
The series of positive net flows in the spot Bitcoin ETF market reached the 6th day. Especially the near-record entry on July 10 shows that the market perception remains quite strong. Demand for large funds such as BlackRock, Fidelity and Ark clearly demonstrates the confidence of institutional investors. Bitcoin’s surpassing the ATH level in this process shows that the activity in the ETF market continues to have a direct impact on the price. Maintaining this trend in the medium term sends positive signals in terms of both price stability and investor interest.
Ethereum spot ETF
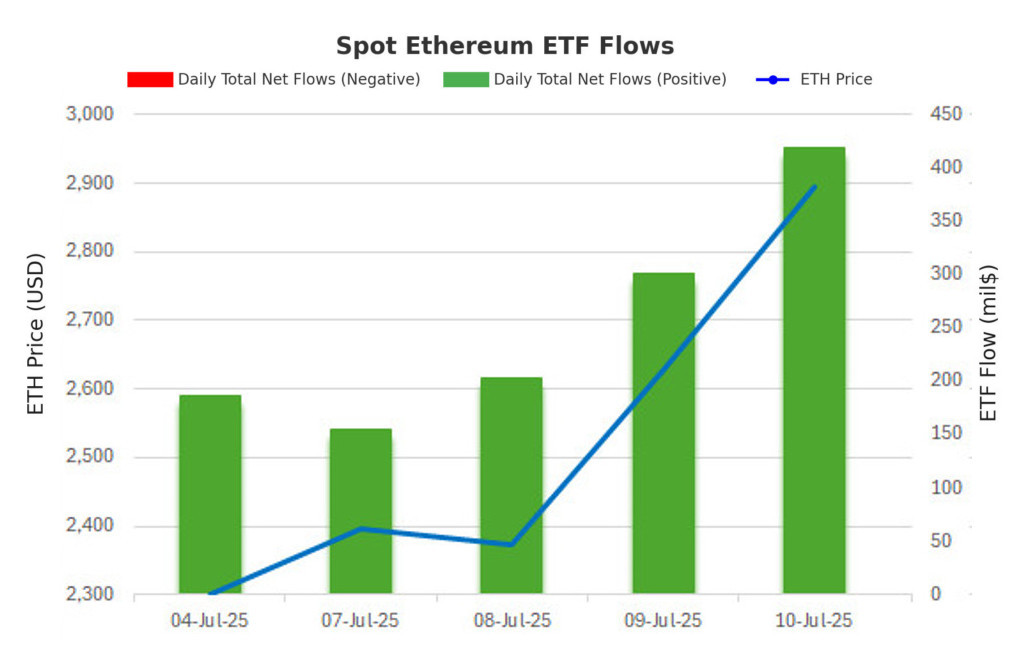
Between July 4-10, 2025, Spot Ethereum ETFs saw a total net inflow of $703.2 million. The strongest inflows on a daily basis were $383.1 million on July 10. BlackRock’s ETHA ETF had a net inflow of $538 million, Grayscale’s ETH and ETHE ETFs totaled $74.8 million, and Fidelity’s FETH ETF had a net inflow of $75 million. Institutional interest in the funds remained quite strong during this period. Spot Ethereum ETFs’ total cumulative net inflows at the end of the 242nd trading day reached $5.119 billion.
| DATE | COIN | PRICE (Open) | PRICE (Close) | Change % | ETF Flow (mil$) |
|---|---|---|---|---|---|
| 04-Jul-25 | ETH | 2,591 | 2,508 | -3.20% | 0 |
| 07-Jul-25 | ETH | 2,570 | 2,542 | -1.09% | 62.1 |
| 08-Jul-25 | ETH | 2,542 | 2,615 | 2.87% | 46.7 |
| 09-Jul-25 | ETH | 2,615 | 2,768 | 5.85% | 211.3 |
| 10-Jul-25 | ETH | 2,768 | 2,951 | 6.61% | 383.1 |
| Total for 04 – 10 Jul 25 | 13.89% | 703.2 | |||
During this period, Ethereum price appreciated by 13.89% from $2,591 to $2,951. Ethereum price and fund flows moved upwards in parallel. High inflows on the ETF side, especially on July 9 and 10, were effective in Ethereum’s rise above the $2,900 level. This concerted move shows that investor confidence is strengthening and institutional positions are expanding. If institutional demand continues in this way, the ETF effect could continue to drive upward momentum on the Ethereum price.
Bitcoin Options Distribution
Source: Laevitas
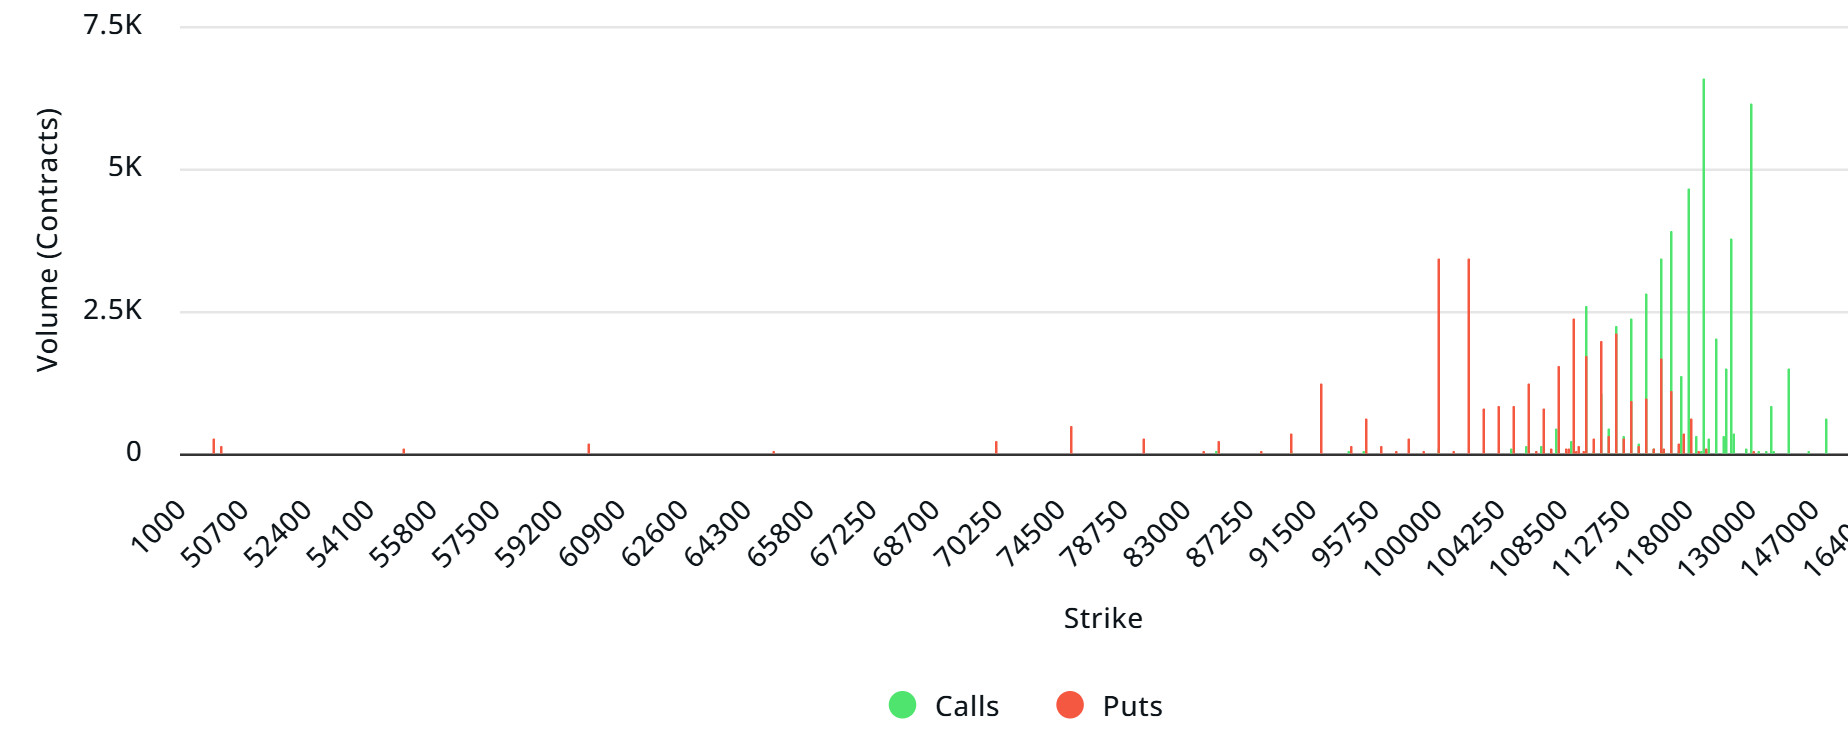
BTC: Notional: $3.99B | Put/Call: 0.94 | Max Pain: $107K
Deribit Data: Deribit data shows that BTC options contracts with a notional value of approximately $3.99 billion expired today. At the same time, according to the data in the last 24 hours, if we look at the risk conversion in the next 1-week period, put options are the dominant side in hedging more than call options. This indicates that the expectation of a decline has increased with the recent rise. When we look at the expected volatility, it is above the realized volatility. This shows that put option fees are cheap. On the other hand, the positive spread value indicates that investors are acting appetite. Skew values, on the other hand, have a bullish value today, while there is selling pressure next week.
Laevitas Data: When we examine the chart, it is seen that put options are concentrated in the $ 100,000 – $ 115,000 band. Call options are concentrated between $113,000 and $130,000 and the concentration decreases towards the upper levels. At the same time, the level of approximately 110,000 dollars is seen as support and 120,000 dollars as resistance. On the other hand, there are 3.44K put options at the $ 100,000 level, where there is a peak and there is a decrease in put volume after this level. However, it is seen that 6.58K call option contracts peaked at the $120,000 level. When we look at the options market, we see that call contracts are dominant on a daily and weekly basis.
Option Maturity:
Put/Call Ratio and Maximum Pain Point: If we look at the options in the last 7 days data from Laevitas, the number of call options increased by about 11% compared to last week and amounted to 110.09K units. In contrast, the number of put options was 71.98K, up 46% from last week. The put/call ratio for options was set at 0.94. This indicates that call options are much more in demand among investors than put options. Bitcoin’s maximum pain point is seen at $107,000. It can be predicted that BTC is priced at $ 118,200 and if it does not break the pain point of $ 107,000 downwards, the rises will continue. Going forward, there are 9.01K call and 6.74K put options at the time of writing.
Ethereum Options Distribution
Source: Laevitas
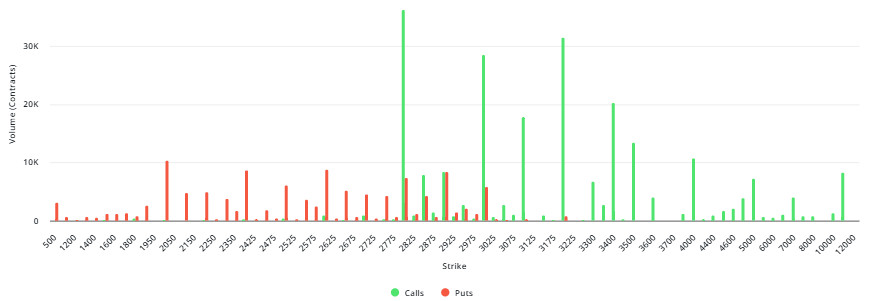
ETH: 609M notional | Put/Call: 1.04 | Max Pain: $2,550
Laevitas Data: Looking at the data on the chart, we see that put options are particularly concentrated at the price levels between $2,600 and $2,900. The highest put volume is at the $2,600 level with around 8,100 contracts and this level can be considered as a possible support zone. On the other hand, there is a remarkable concentration in call options at the $2,800 and $3,200 levels. The $2,800 level in particular stands out with a high call volume of about 36,000 contracts.
Deribit Data: Short-term volatility expectations have increased in the market. ATM volatility is at 77.65% and has risen above 16%. This shows that investors expecting sharp movements in the coming days are increasing. 25 Delta RR remained positive but slightly declined, meaning that the upside expectation has weakened slightly, although it remains positive. The most striking part is the 209% increase in open positions. This shows that serious new money has entered the market. Call volume increased, but put volume rose much more sharply (405%). Traders are still cautious and seem to be hedging against downside risk.
Option Expiry:
Ethereum options with a notional value of $609 million expire on July 4. The Max Pain level is calculated at $2,550, while the put/call ratio is at 1.04.
Legal Notice
The investment information, comments and recommendations contained in this document do not constitute investment advisory services. Investment advisory services are provided by authorized institutions on a personal basis, taking into account the risk and return preferences of individuals. The comments and recommendations contained in this document are of a general type. These recommendations may not be suitable for your financial situation and risk and return preferences. Therefore, making an investment decision based solely on the information contained in this document may not result in results that are in line with your expectations.