
Active Addresses
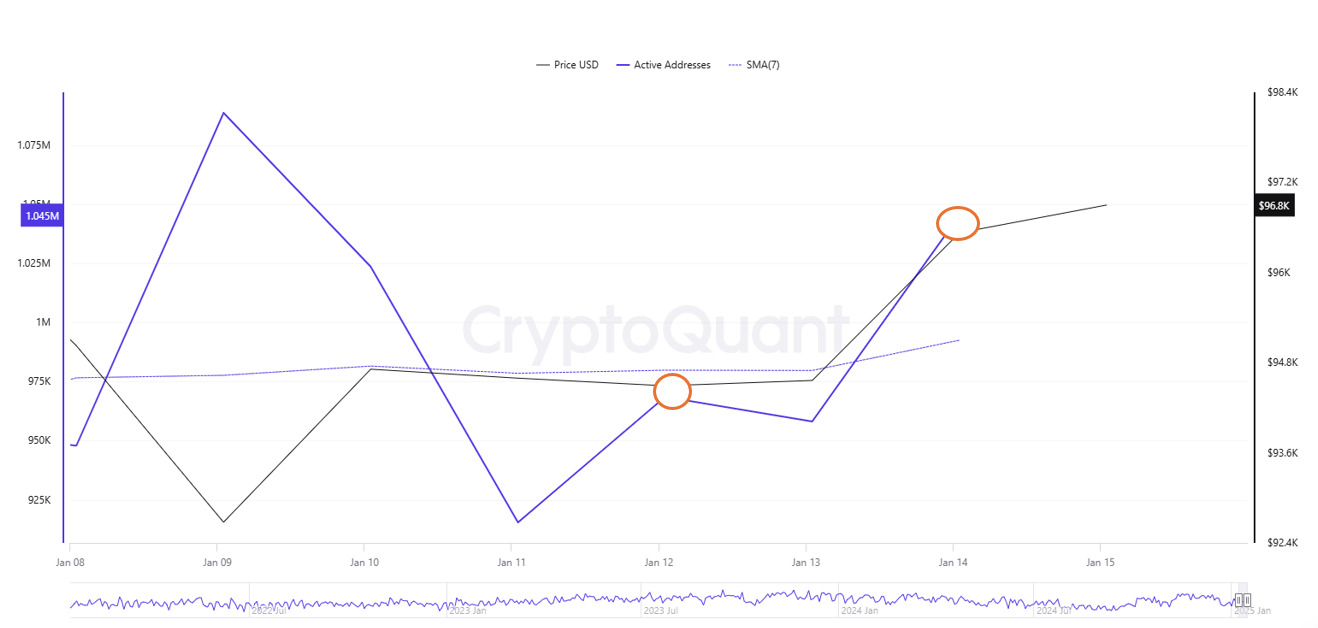
In the number of active addresses, $915,416 entered the exchanges between Ocak 08 and Ocak 15, 2025, this week. Bitcoin fell from a high of $97,000 to a low of $92,000 during this period. The highest number of active addresses since the first week of Ocak, we see that Bitcoin purchases accelerated in the region where the price and the number of active addresses intersect in the region marked on the chart of addresses ready to trade. On Ocak 9, the number of active addresses rose to 1,088,725, indicating that the market is strengthening, and investors are more interested. When we follow the 7-day simple moving average, it is observed that the price follows an upward trend on the dates when these average cuts the price. Bitcoin reached 979,708,148 in correlation with the active address EMA (7). This situation indicates that the Bitcoin price is experiencing entries at $ 96,000 levels.
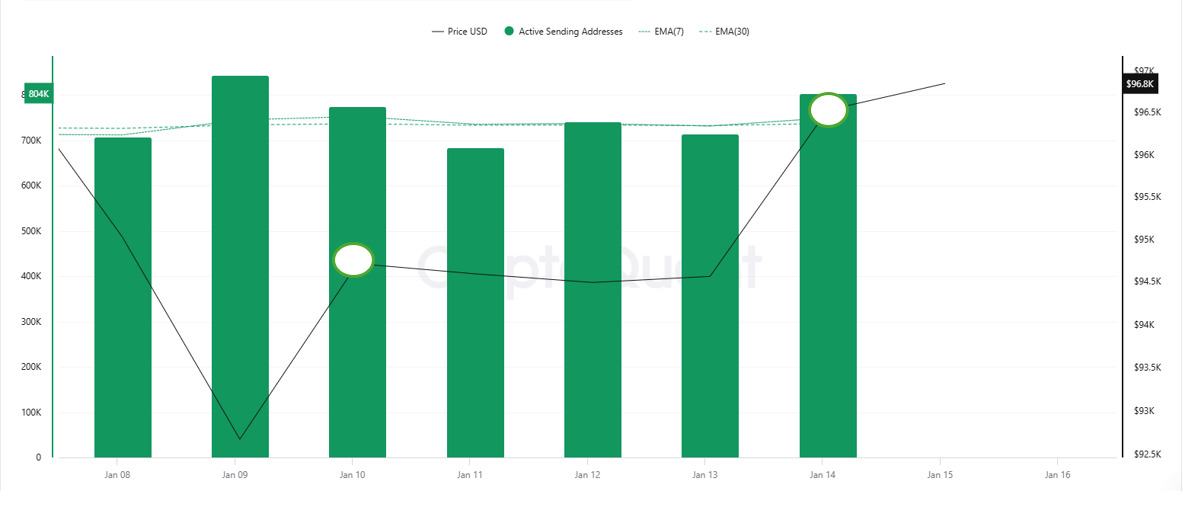
On the outflows, there was a significant increase in active shipping addresses towards Ocak 13, along with the Black Line (price line). On the day of the price peak, active shipping addresses rose as high as 714,983 , indicating that buyers sold their positions as Bitcoin stayed around the $94,000 level for a while.
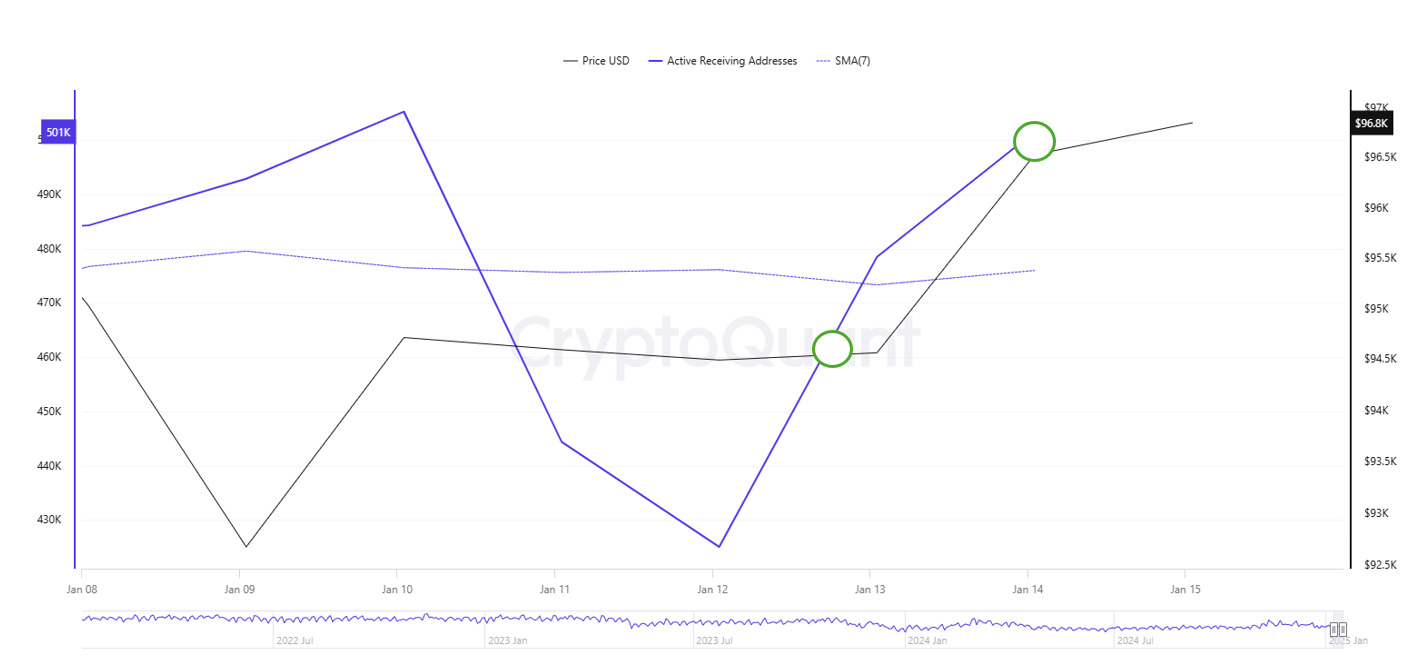
Active Receiving Addresses, on the other hand, show that on Ocak 10, the price approached the highest level of the number of buyers (505,190) and investors went to increase their bitcoin positions. Bitcoin shows the $96,000 level as the longest buying level for traders. However, on the chart, the SMA (7-Day) at 473,297,571 seems to change the trend direction at the point where it intersects with the price. This may indicate the costing levels of buyers before the price rises.
Breakdowns
MRVR
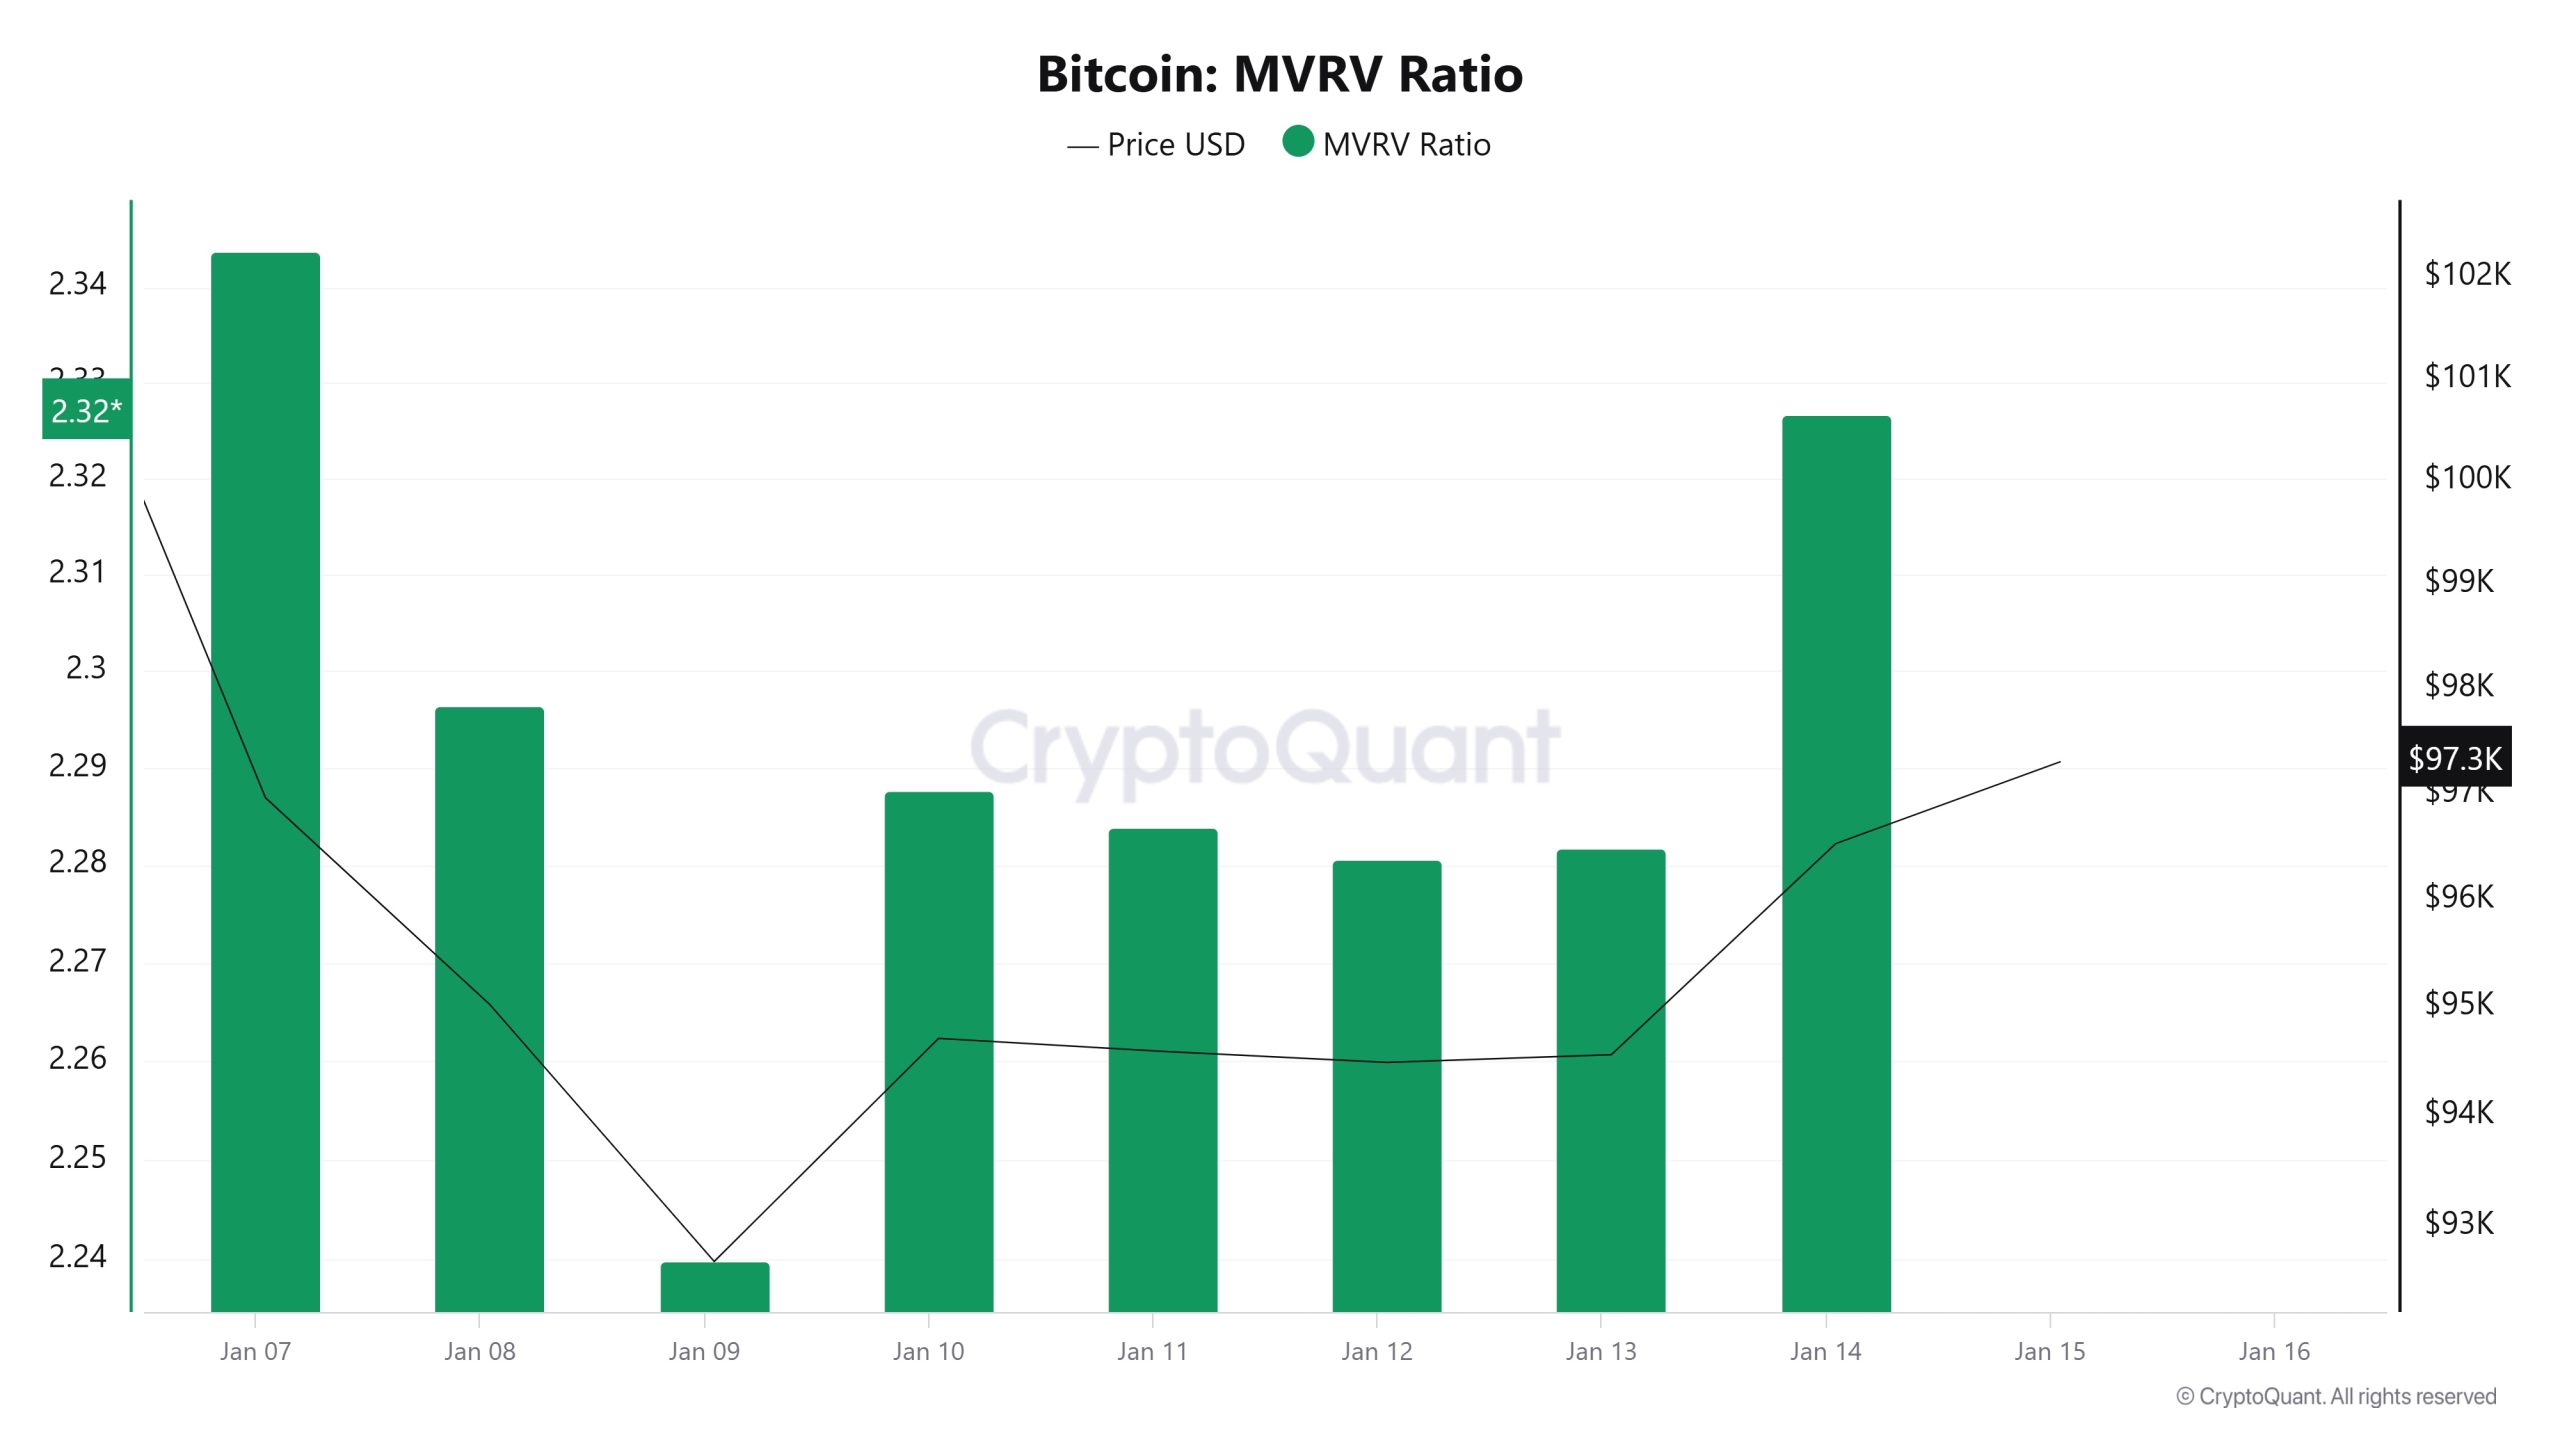
As of Ocak 8, the Bitcoin price was at 95,026 and the MVRV Ratio was 2.29. On Ocak 14, the Bitcoin price rose to 96,529 and the MVRV Ratio increased to 2.32. This represents an increase of 1.58% in price and 1.31% in MVRV Ratio. The limited increase in Bitcoin price and MVRV Ratio suggests that market participants are cautiously optimistic. The increase in the MVRV Ratio to 2.32 indicates that the market capitalization has reached a relatively high point compared to historical averages, but there are no signs of overvaluation. This indicates that a balanced outlook is maintained in the market
Realized Price
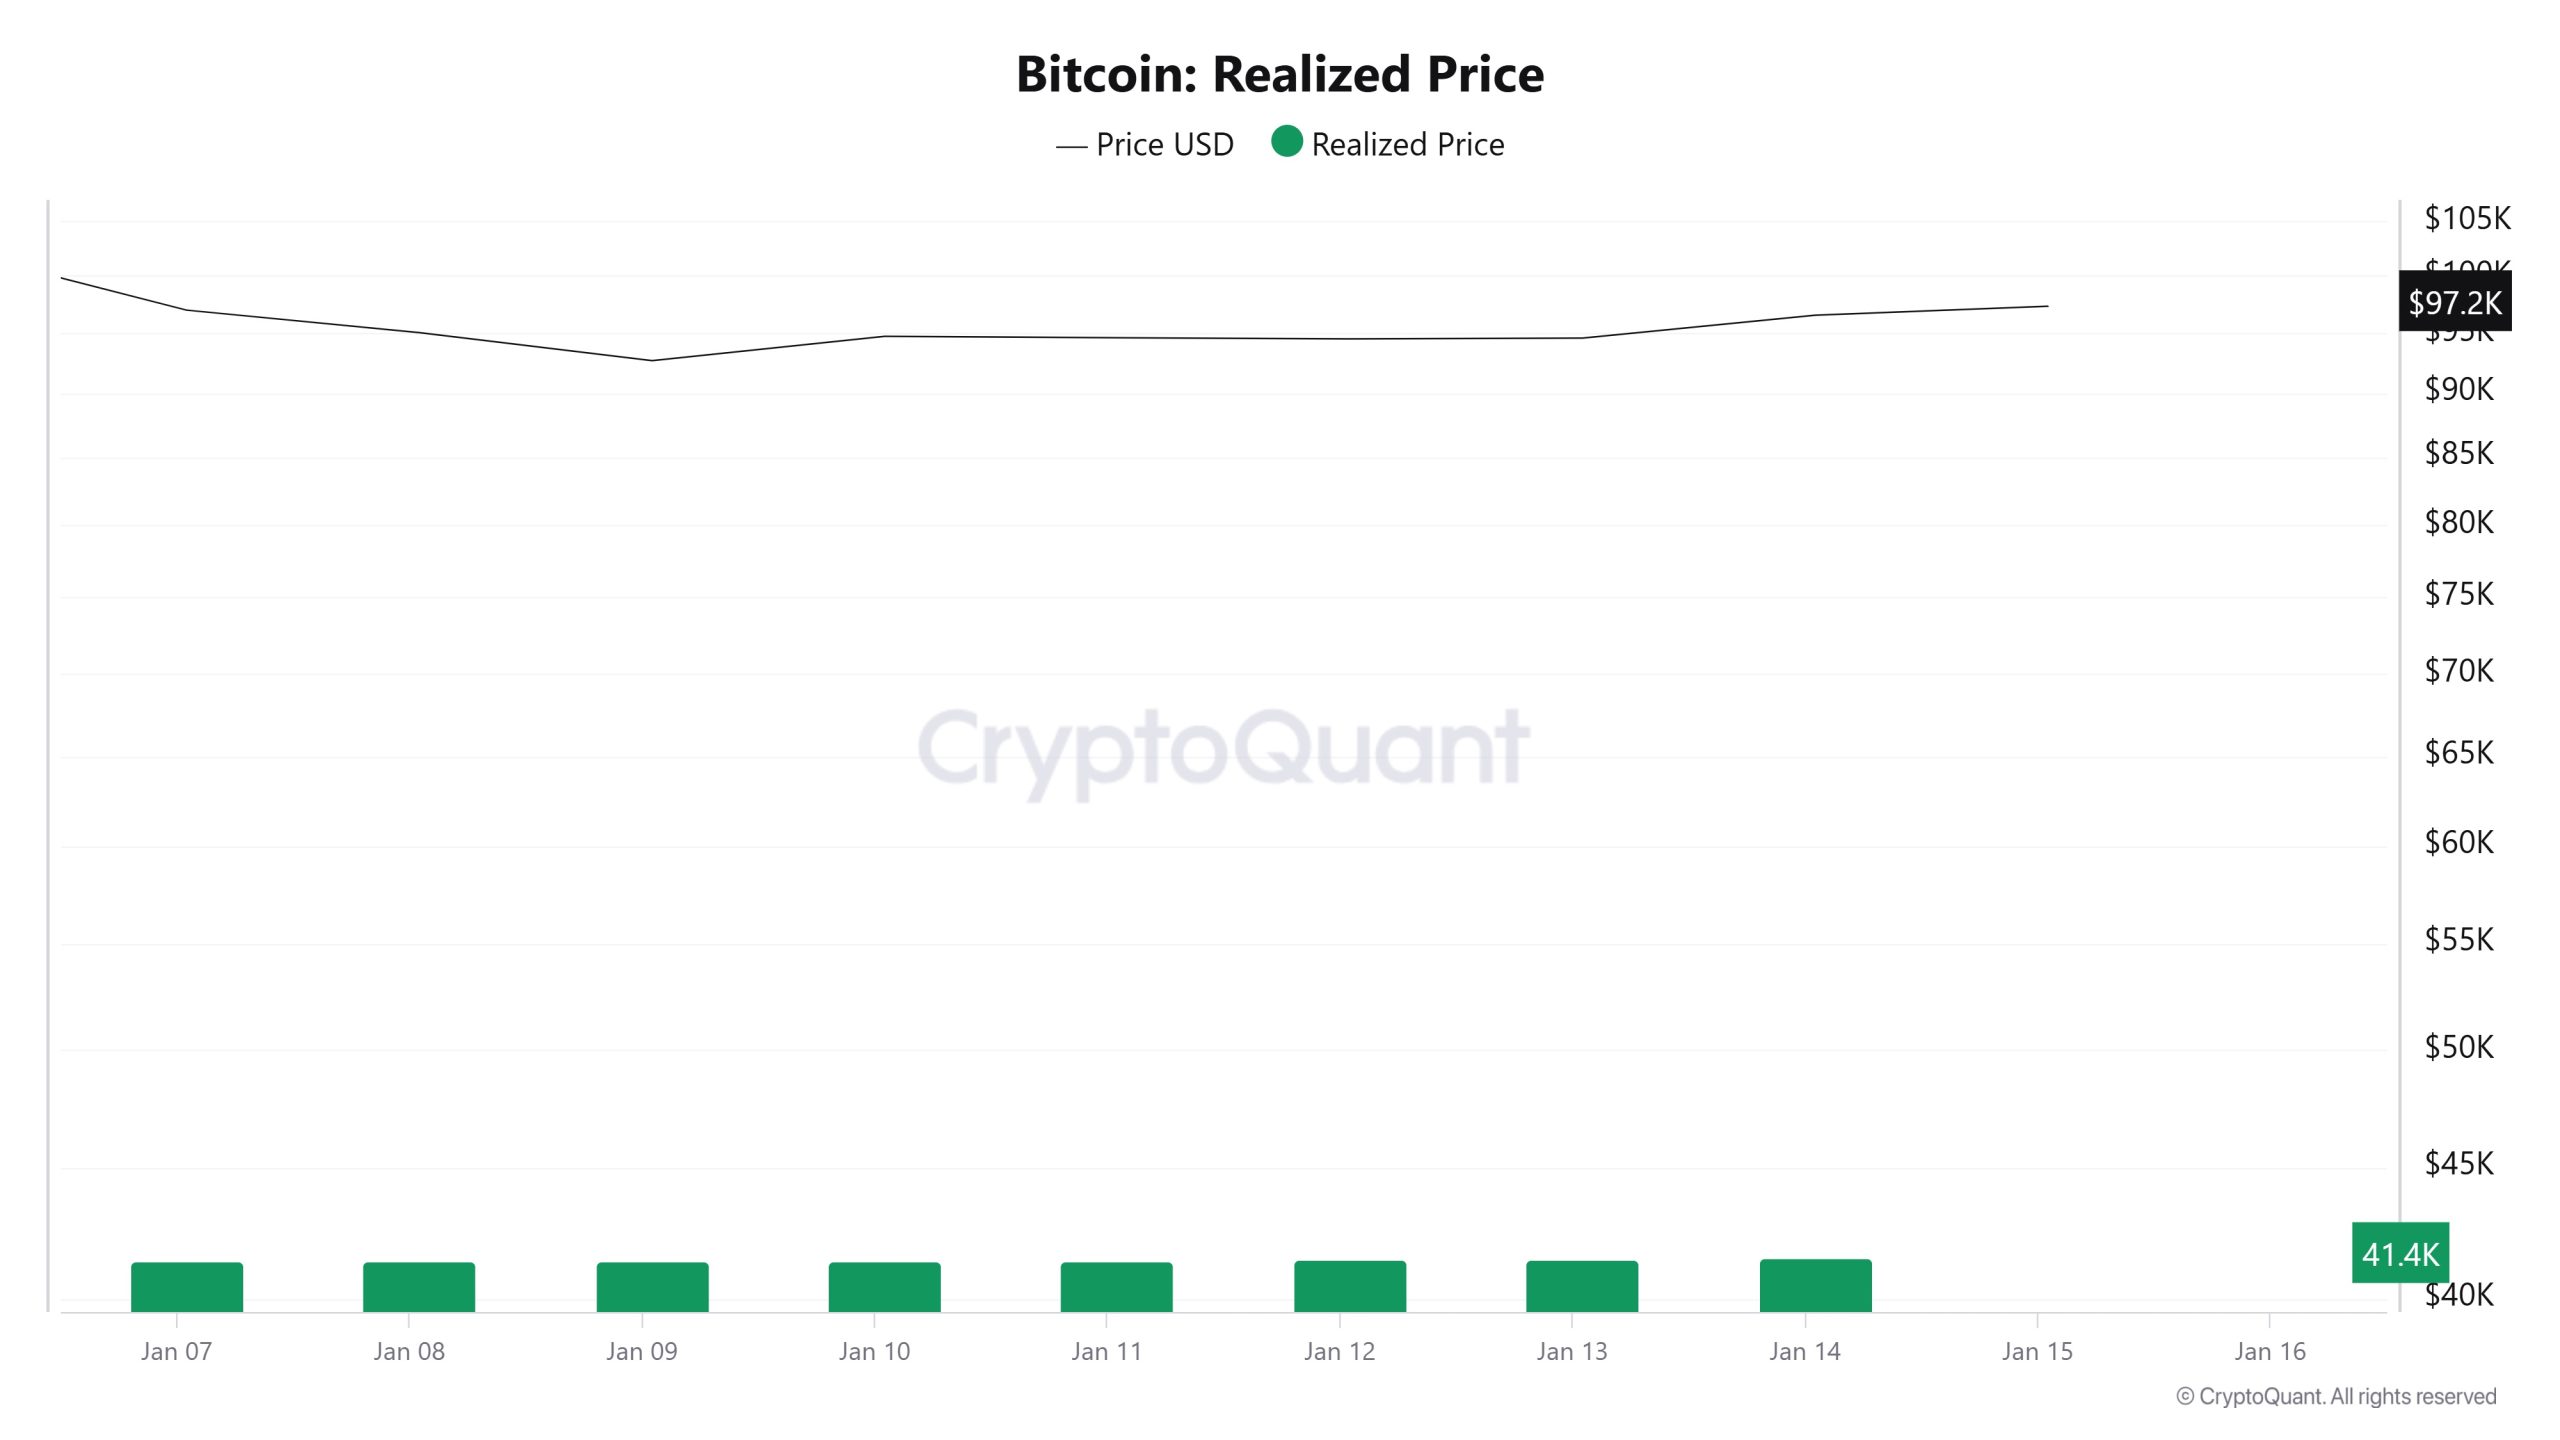
On Ocak 8, the Bitcoin price was 95,026 while the Realized Price metric was 41,379. On Ocak 14, the Bitcoin price rose 1.58% to 96,529 while the Realized Price metric increased by 0.26% to 41,488. The faster rise in the Bitcoin price compared to the Realized Price metric suggests that short-term traders are playing a more active role in the market and speculative demand is influential. The limited increase in the Realized Price metric indicates that the support of long-term investors continues, but this support is gradual and cautious. The slower rate of increase in the Realized Price metric may indicate that long-term buying has not gained strong momentum, but overall, Bitcoin’s long-term value remains intact.
Spent Output Profit Ratio (SOPR)
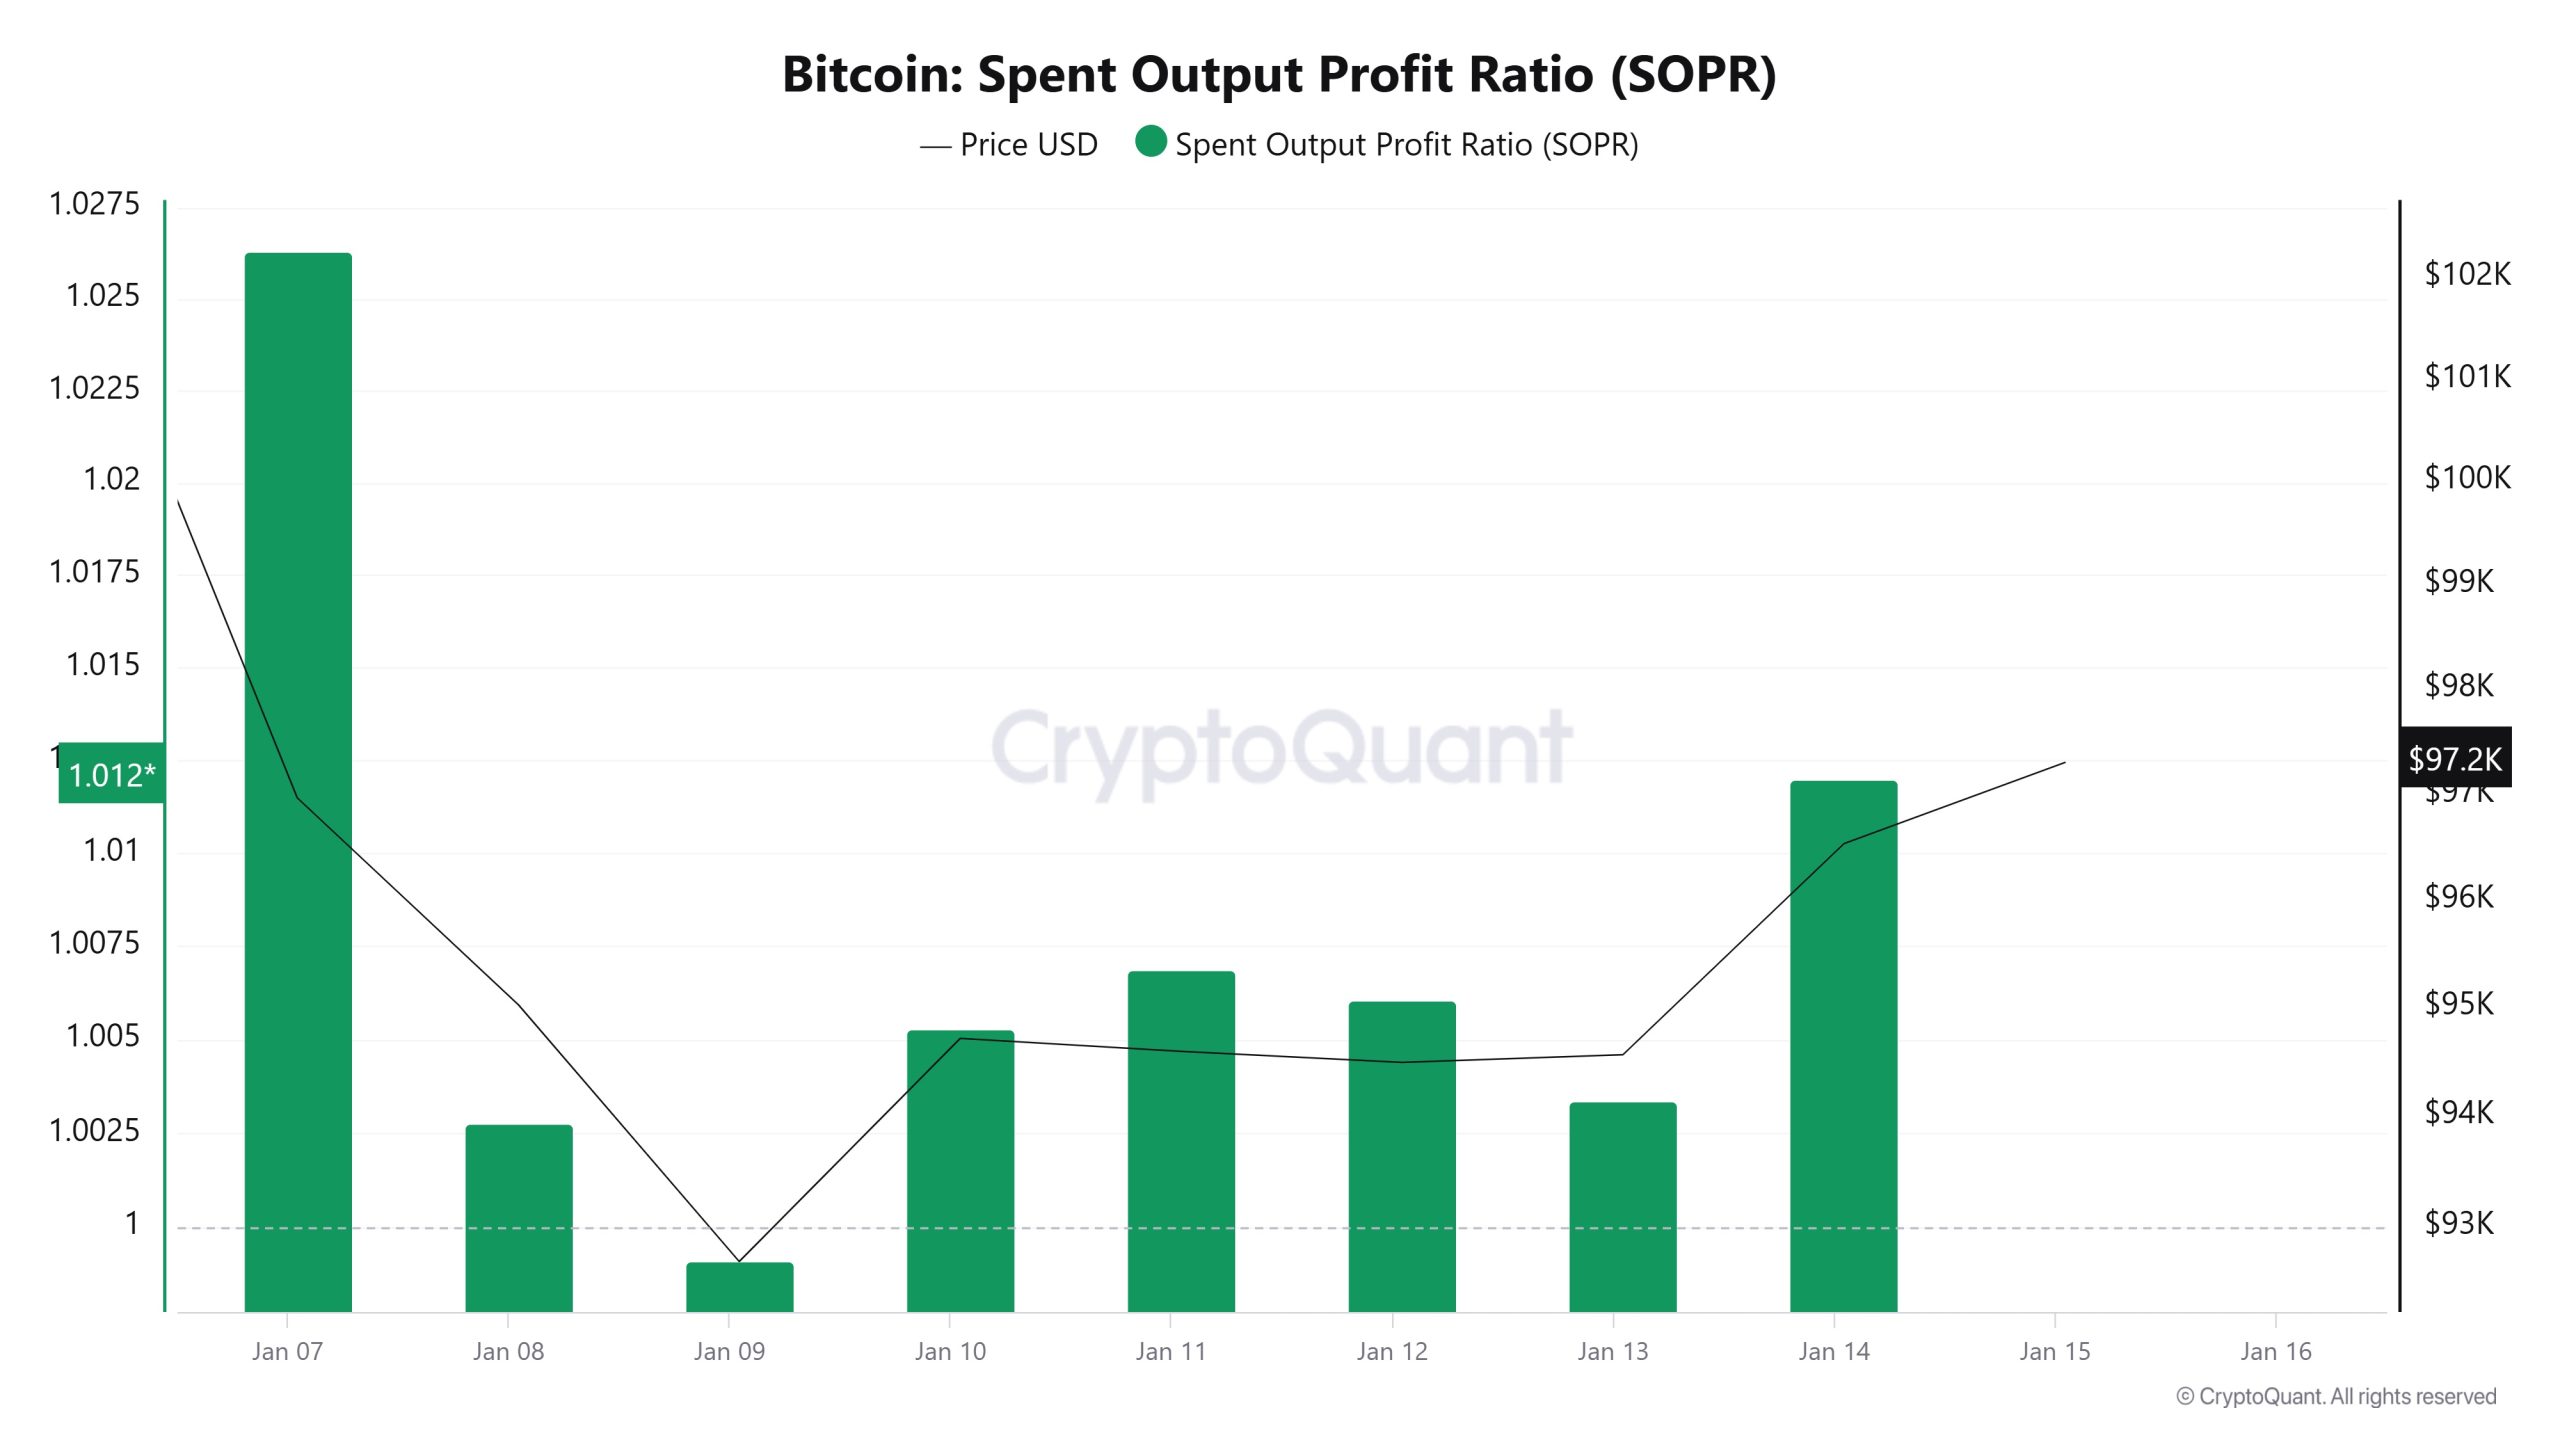
On Ocak 8, the Bitcoin price was at 95,026 while the SOPR metric was at 1. On Ocak 14, the Bitcoin price rose 1.58% to 96,529 while the SOPR metric was at 1.01, an increase of 1%. A SOPR metric above 1 indicates that market participants are mostly selling at a profit. This limited increase in the SOPR metric suggests that profit realizations are in a healthy balance and there is no excessive selling pressure in the market. This may suggest that the uptrend in the market is sustainable and participants continue to act cautiously
Türevler
Açık Faiz
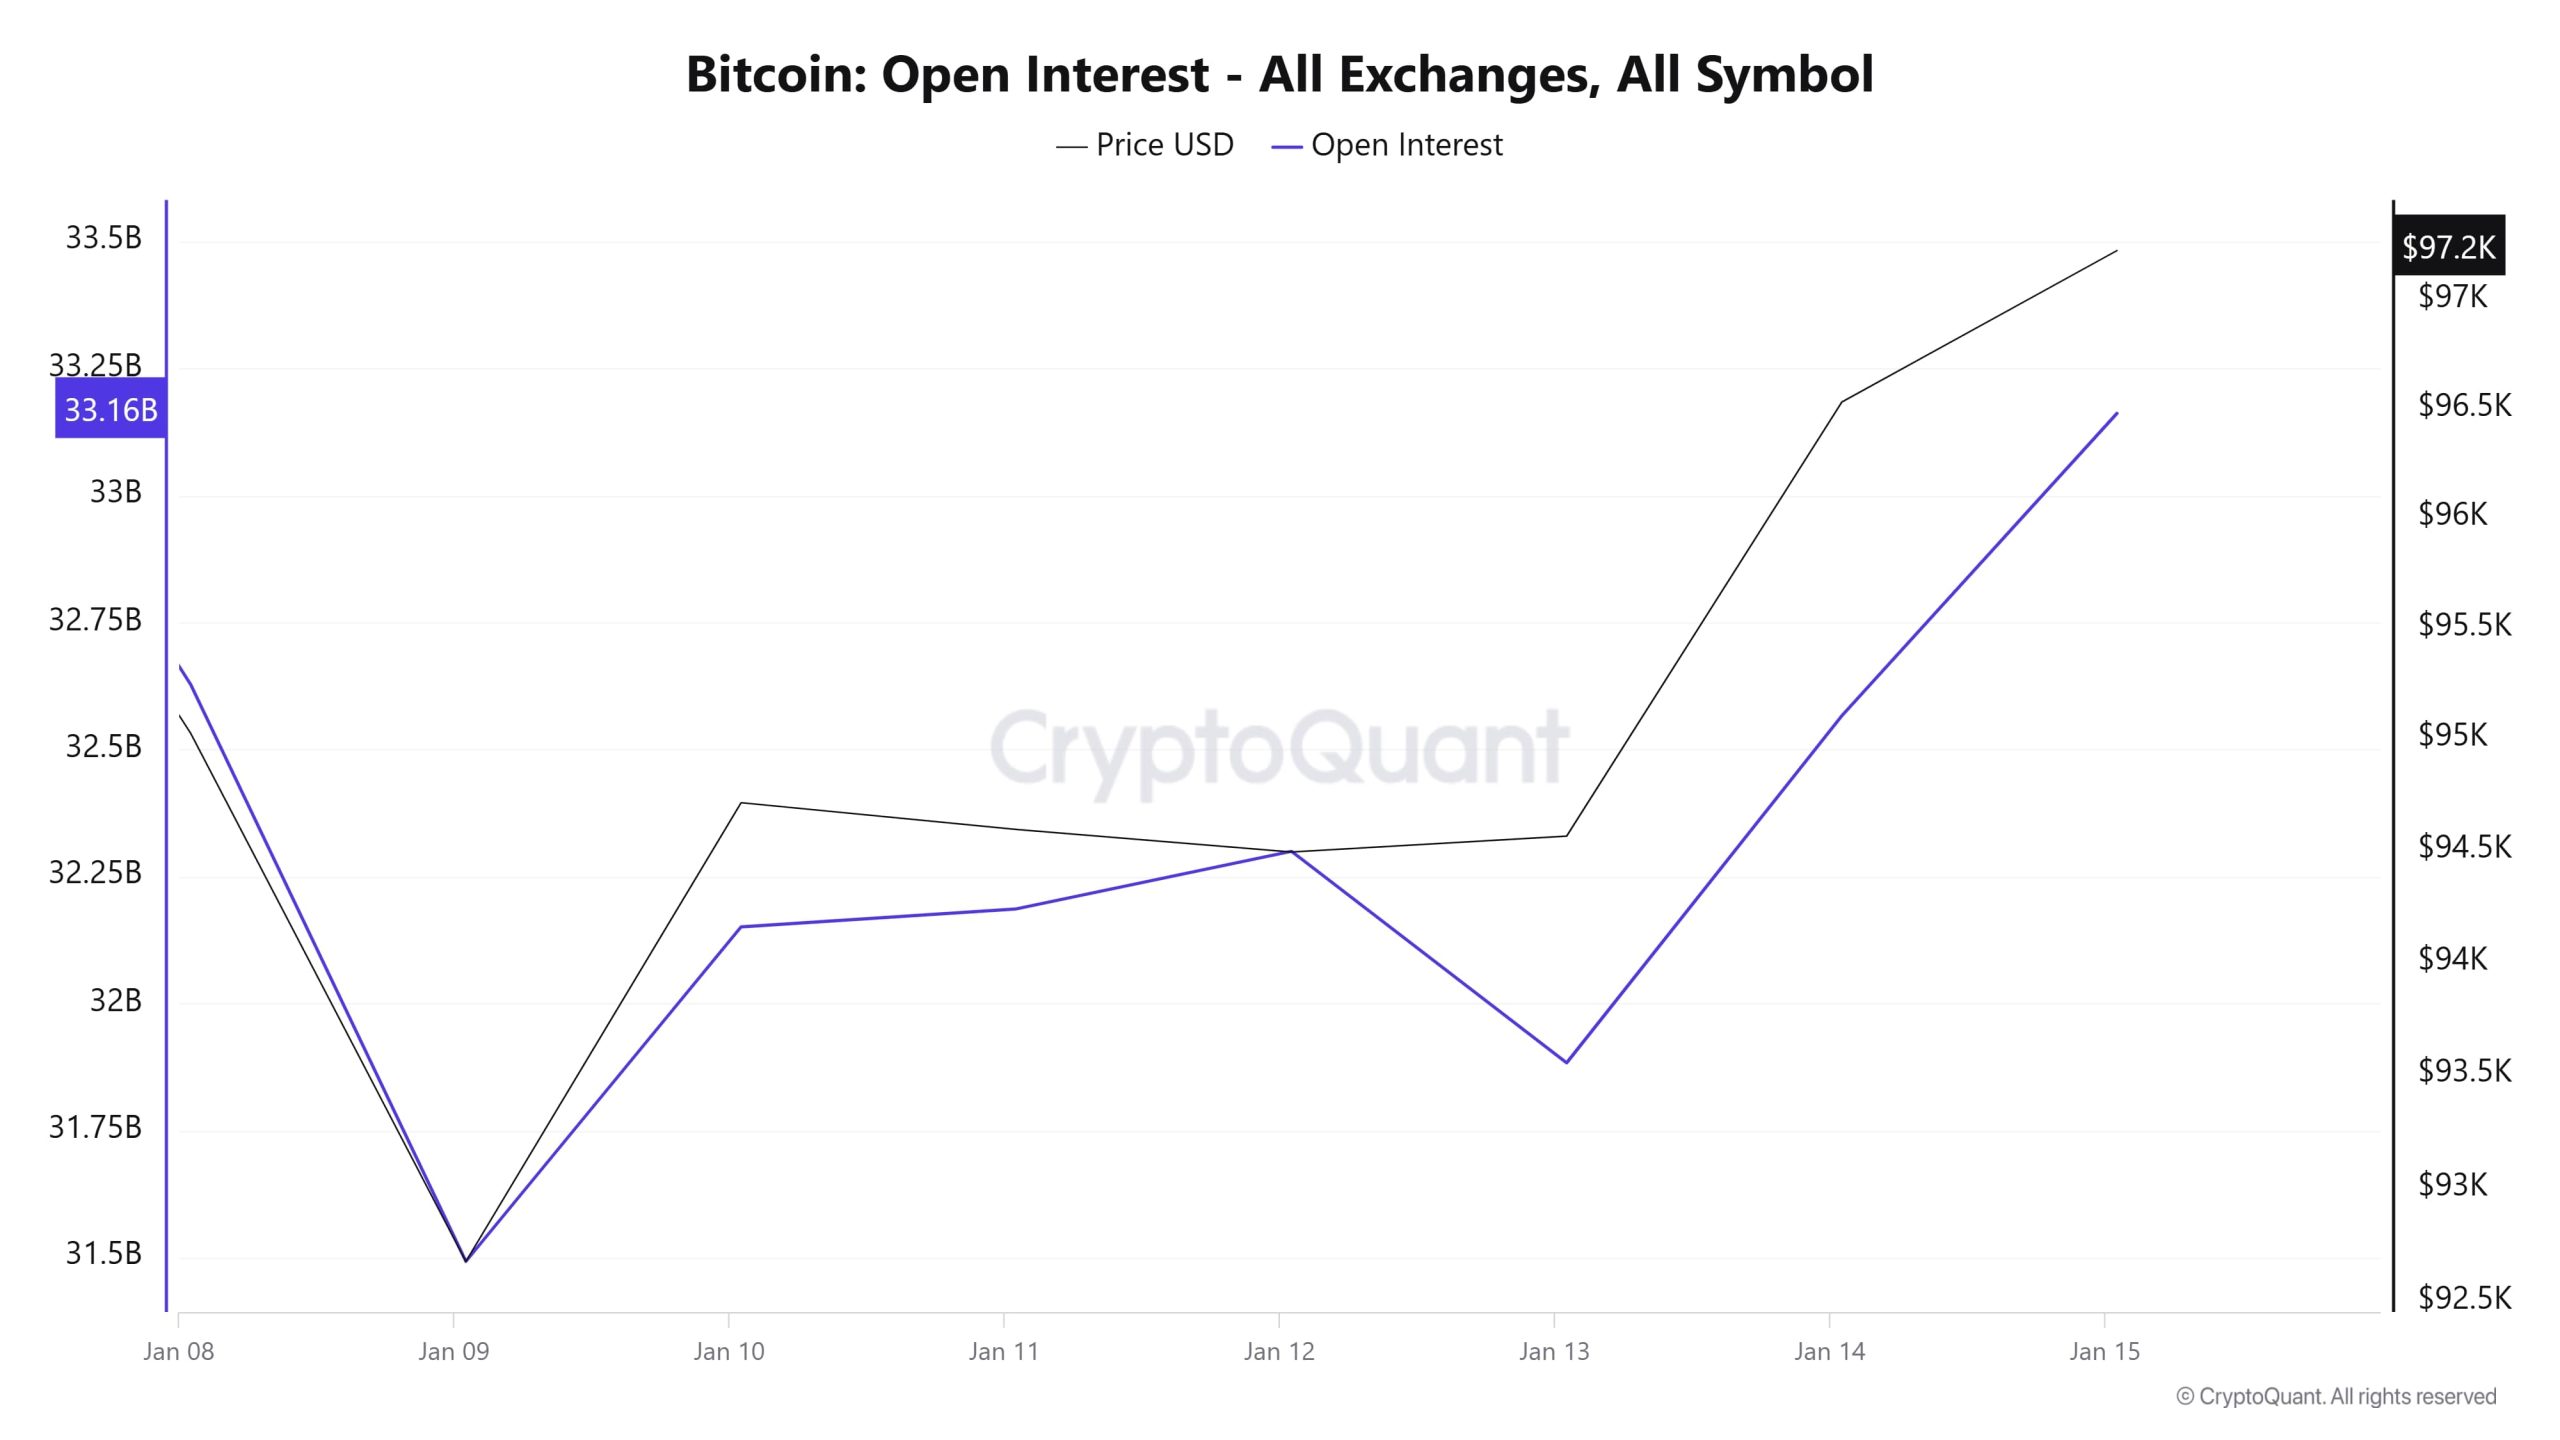
Interest has been on a steady upward trend, indicating increased investor interest in the futures market and more capital flowing into the market. The accompanying rise in the price indicates that the upward trend is strong in the current market conditions and that investors’ market expectations are shaped in a positive direction.
The sharp declines on Ocak 9th and Ocak 13th, which occurred simultaneously in both price and open interest, indicate that positions in the market were quickly closed. Such declines are usually seen during periods when investors engage in risk-reduction strategies due to short-term uncertainty. However, since Ocak 14th, there has been a strong increase in price and open interest again. This rise clearly shows that new positions have entered the market and the risk appetite of participants has increased again. Especially the parallel increase in price and open interest is an important indicator for the sustainability of the bullish momentum.
However, the rapid rise in open interest also suggests that the market has become over-leveraged, a risk that could lead to large liquidations if price movements reverse. While rising open interest usually indicates the strengthening of a trend, if the price flattens or declines, it could be a sign of market tightness or the start of profit realizations. Such a scenario could lead to large volatility, especially when leverage is high.
-
Fonlama Oranı
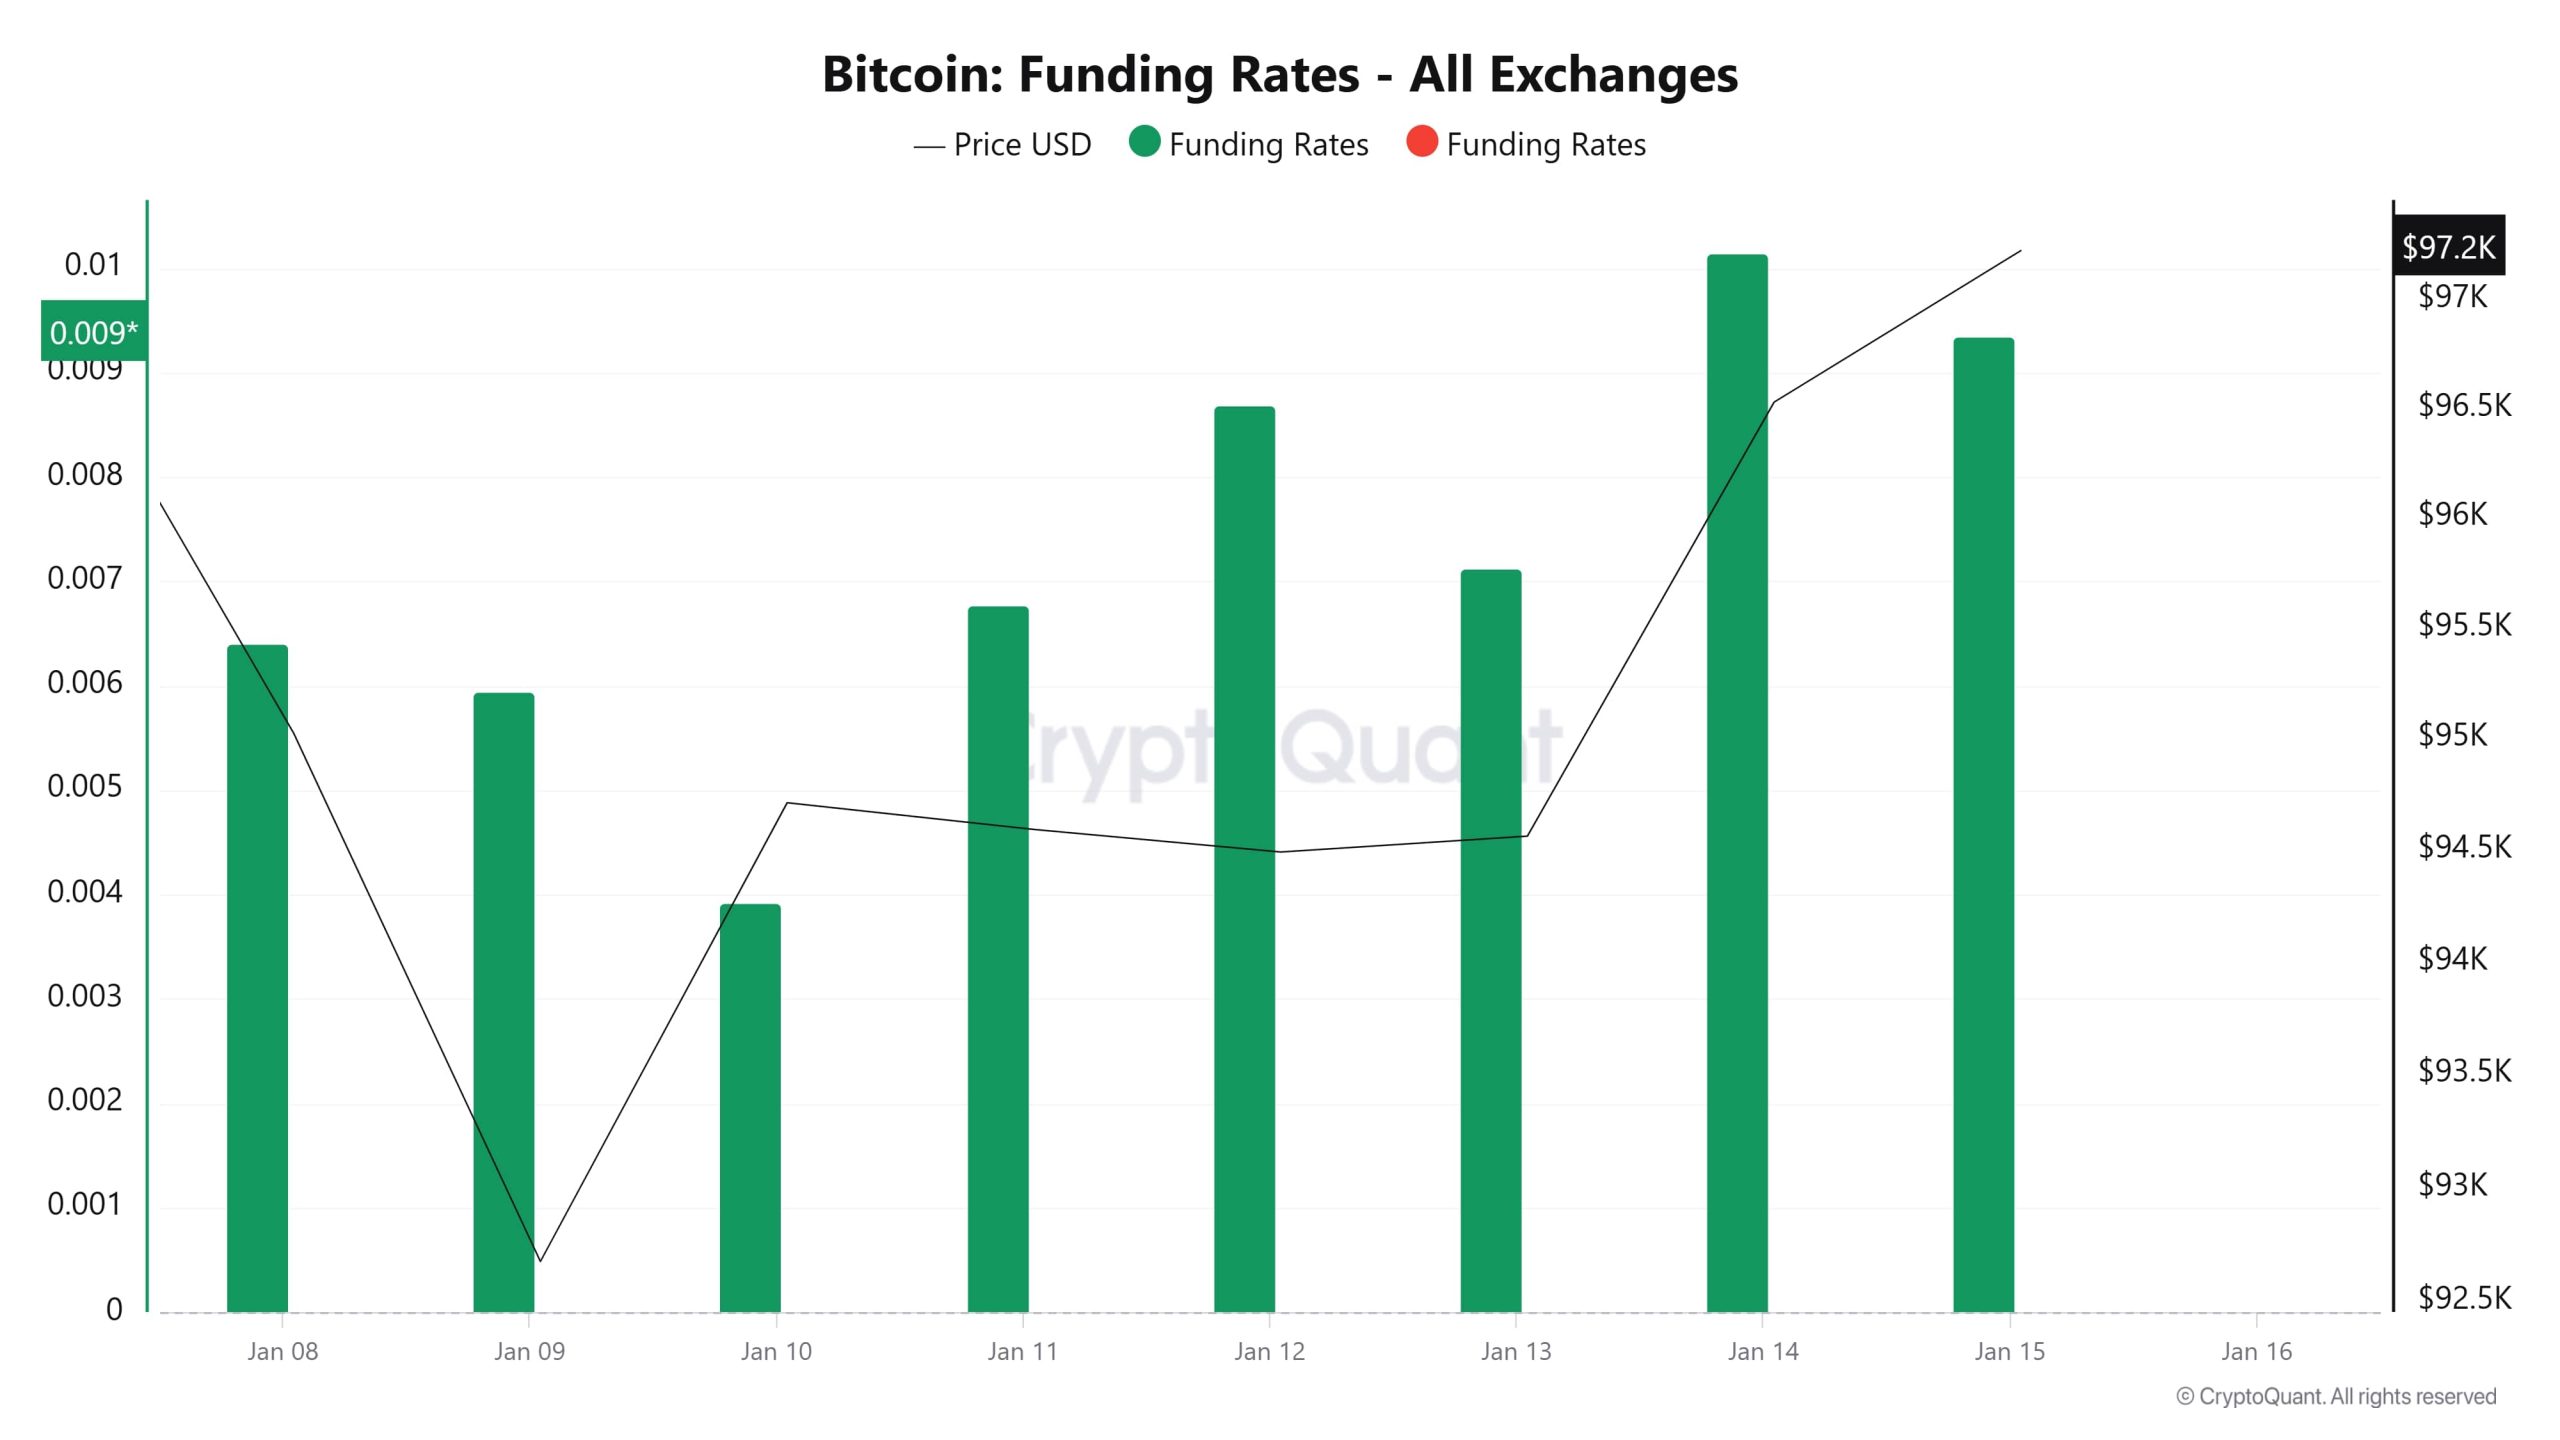
Bitcoin funding rates continue to be positive and the price is on an uptrend. Positive funding rates indicate that the market is largely made up of long positions and investors have strong bullish expectations. The decline around Ocak 9 suggests that there was a pullback in both the funding rates and the price, suggesting that investors closed positions or short positions gained weight. However, the rise in the funding rate after Ocak 14th suggests that bullish expectations are again strengthening in the market. However, if the funding rate remains at high levels for a prolonged period of time, the market may become overleveraged and risk a possible correction.
Uzun ve Kısa Tasfiyeler
After a very active week similar to last week, Bitcoin continues to price above the $96,000 level again. With the deep declines on Ocak 8, 9 and 13, high liquidations in both long and short positions stand out. When the liquidity heatmap is analyzed, the liquidation block formed up to 99,000 levels stands out. Although rises up to these levels seem possible, the lack of sufficient spot support and low volume data may indicate that Bitcoin is at a critical decision stage that requires caution.
| Tarih | Uzun Tutar (Milyon $) | Kısa Tutar (Milyon $) |
|---|---|---|
| 08 Ocak | 26.44 | 17.08 |
| Ocak 09 | 21.53 | 5.48 |
| Ocak 10 | 7.21 | 23.29 |
| Ocak 11 | 1.74 | 2.01 |
| Ocak 12 | 12.31 | 1.16 |
| Ocak 13 | 22.69 | 23.06 |
| Ocak 14 | 6.31 | 10.84 |
| Toplam | 98.23 | 82.92 |
Tedarik Dağıtımı
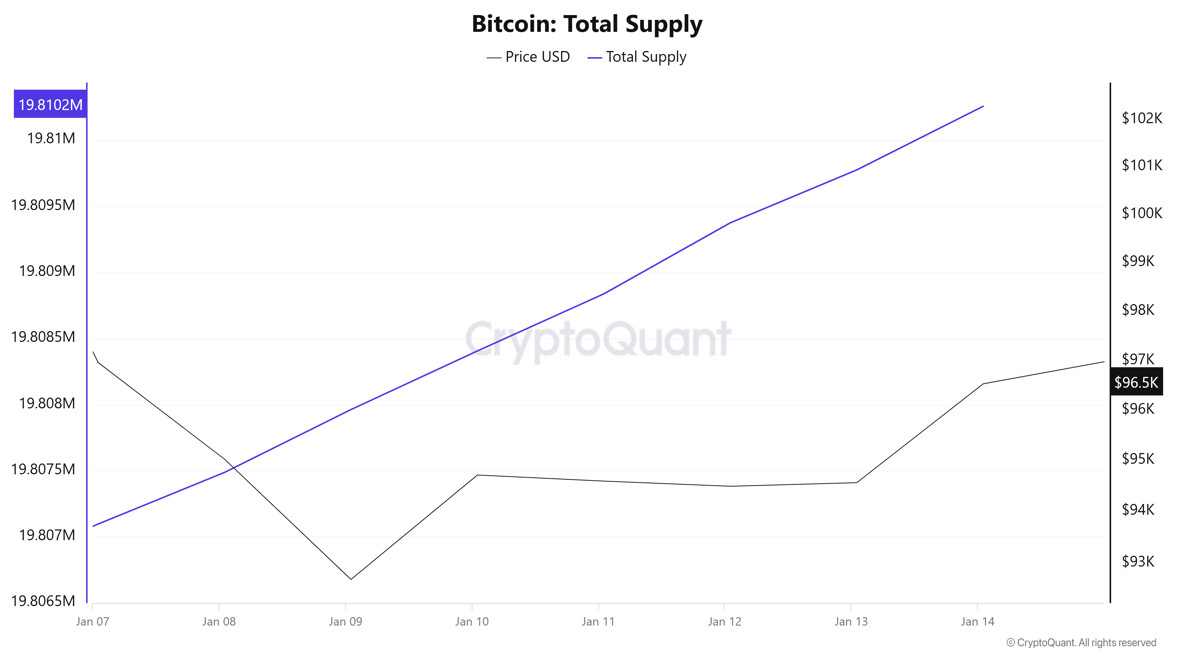
Total Supply: It reached 19,810,255 units, up about 0.0159% from last week.
New Supply: The amount of BTC produced this week was 3,159.
Velocity: Continued decline compared to the previous week.
| Cüzdan Kategorisi | 07.01.2025 | 14.01.2025 | Değişim (%) |
|---|---|---|---|
| < 0.1 BTC | 1.589% | 1.590% | 0.063% |
| 0.1 – 1 BTC | 5.417% | 5.417% | - |
| 1 – 100 BTC | 32.285% | 32.320% | 0.108% |
| 100 – 1k BTC | 22.609% | 22.569% | -0.177% |
| 1k – 100k BTC | 34.824% | 34.835% | 0.032% |
| > 100k BTC | 3.271% | 3.270% | 0.031% |
Bitcoin’s total supply reached 19,810,255 units, up 0.0159% from last week. In total, 3,159 BTC were produced this week. When we examine the supply distribution, it is noticeable that there are remarkable changes in different wallet categories. In particular, there was a 0.108% growth in the medium-sized investors (1-100 BTC) category, while there was a 0.177% decrease in the large investors (100-1k BTC) category. On the other hand, mega whale wallets (>100k BTC) have remained relatively stable, with only a small decrease of 0.031%.
Looking at the overall picture, we can easily say that the accumulation trend in the market continues. However, the decline in velocity compared to the previous week suggests that the market is still in a sluggish phase and investors are more inclined to hold on to their BTC holdings. This could mean that market participants are adopting a more cautious approach and waiting for the right time to make a significant move.
Döviz Rezervi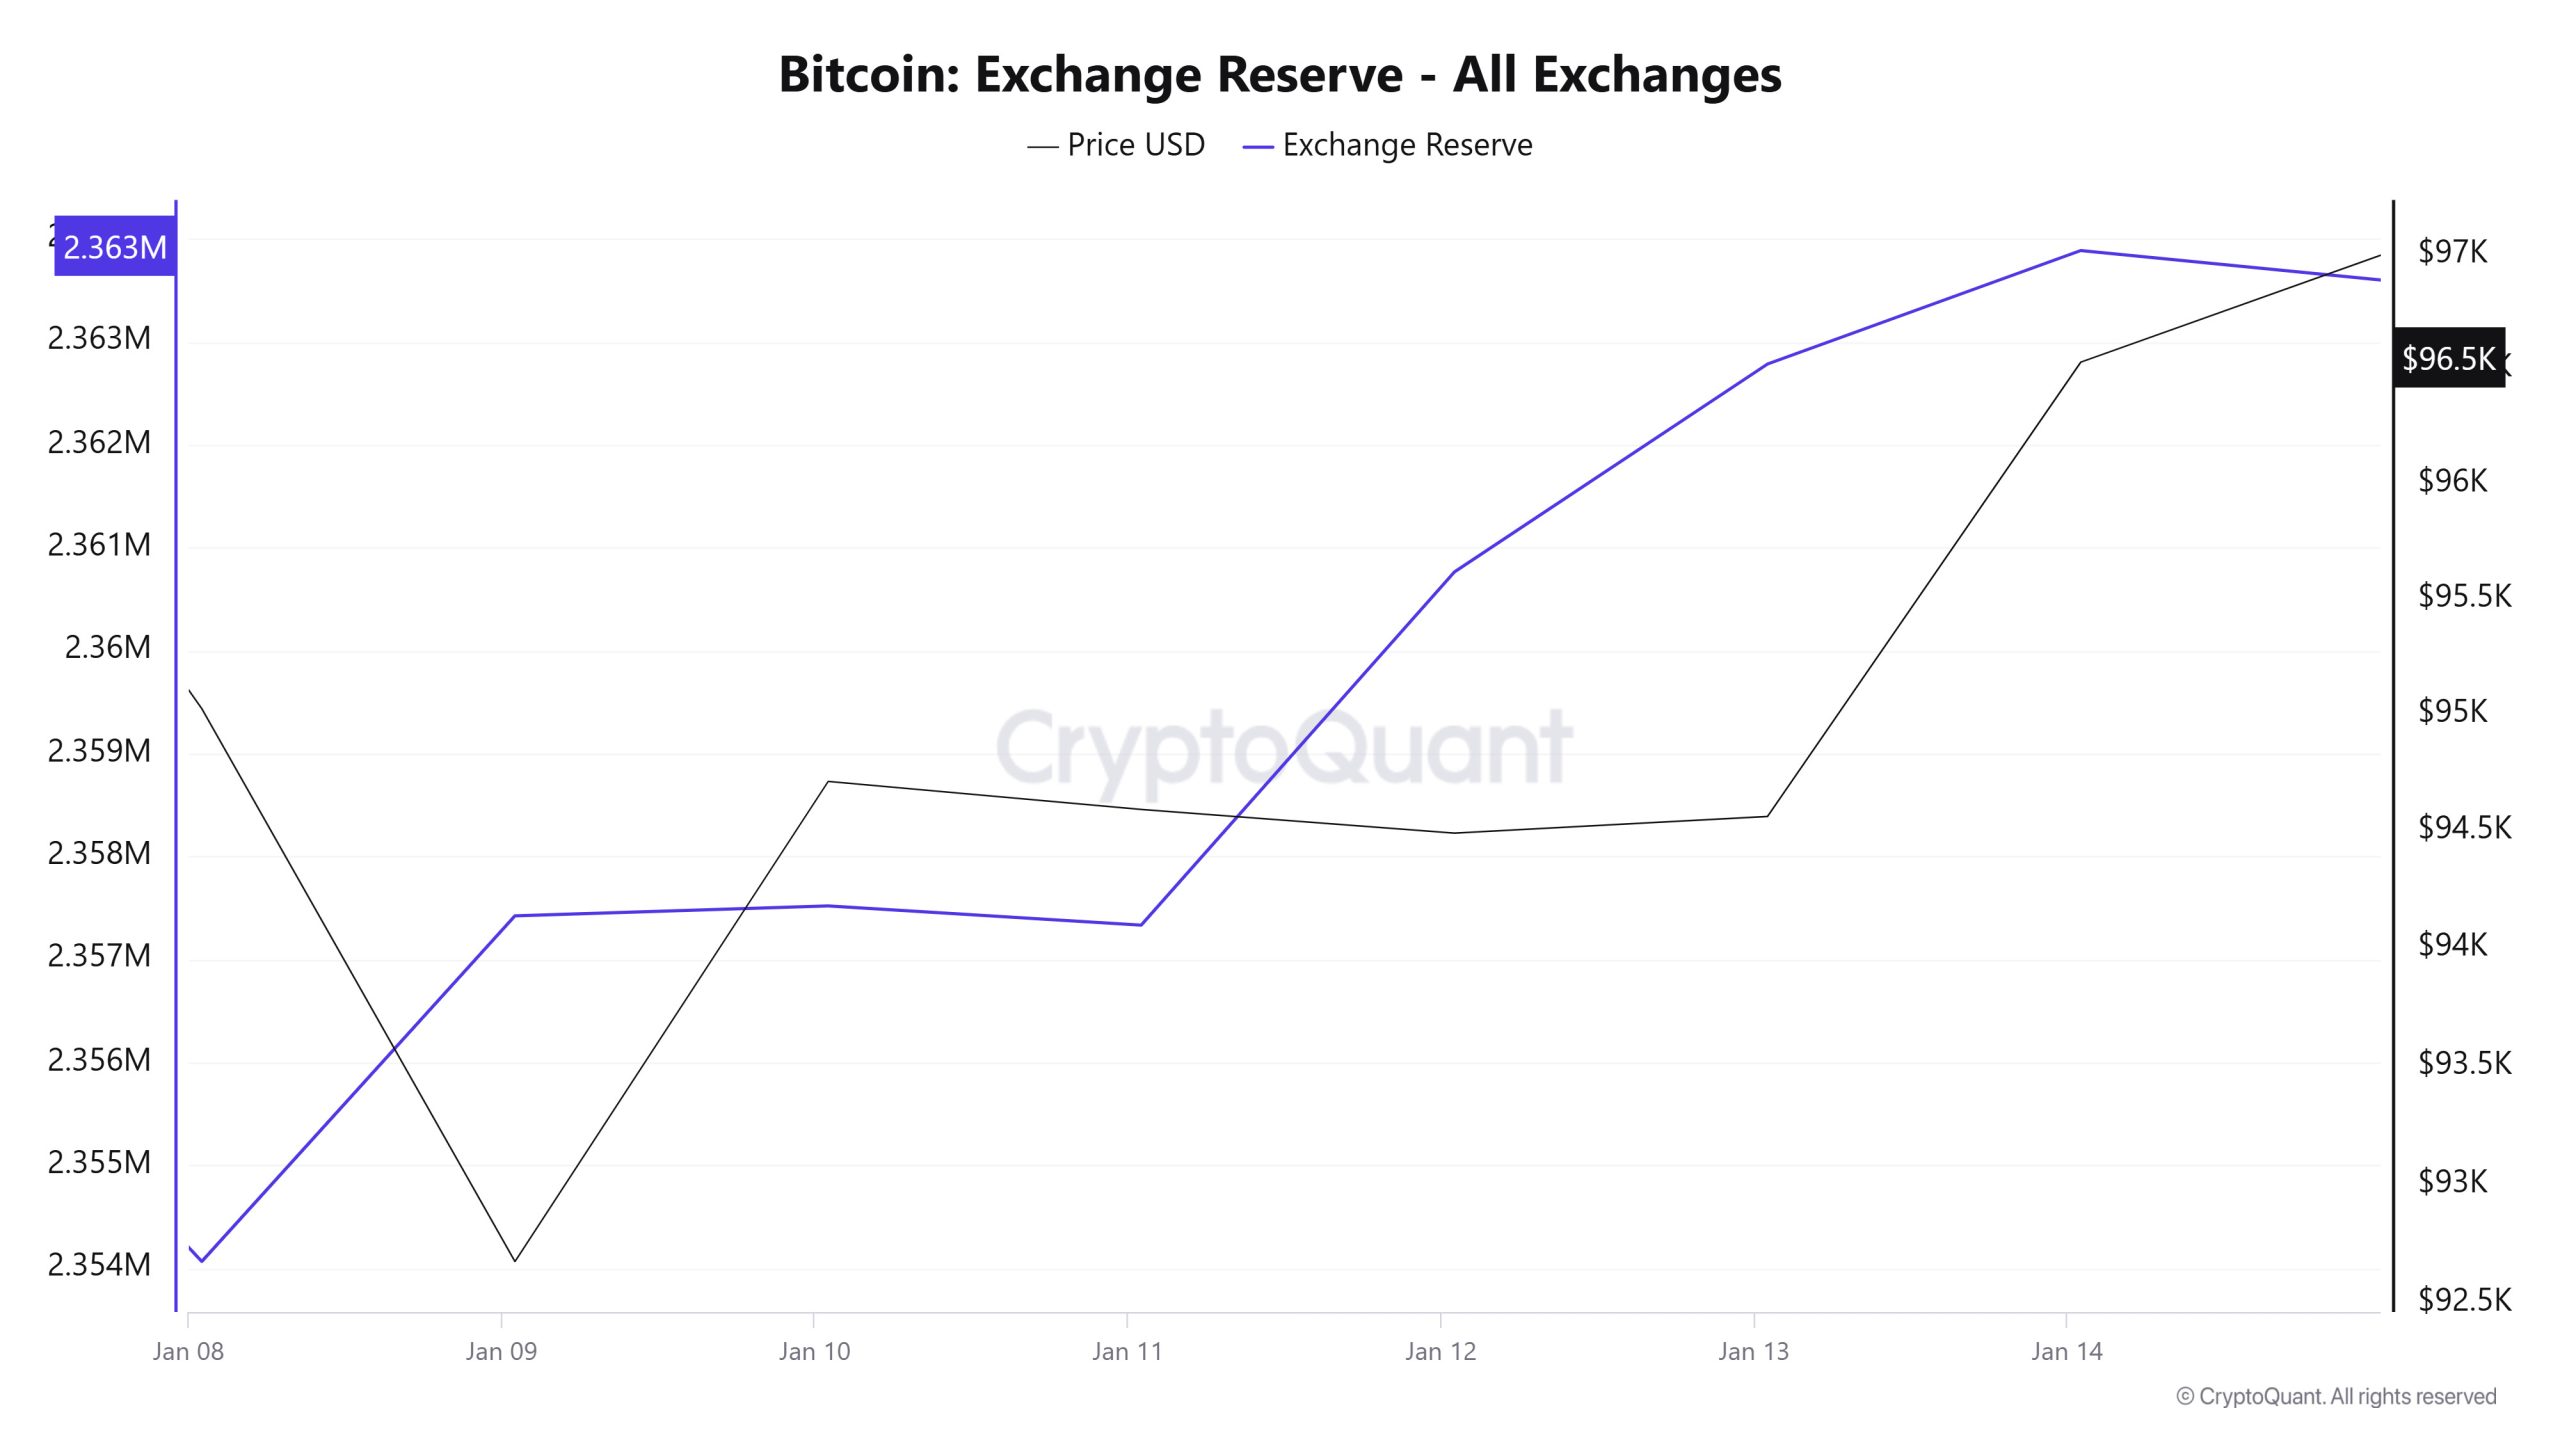
Between Ocak 08-14, 2025, Bitcoin reserves on exchanges increased by 0.4% from 2,354,064 BTC to 2,363,886 BTC, with a net inflow of 9,822 BTC. Particularly noteworthy during this period were high net inflows of 3,432 BTC on Ocak 12, 2025 and 3,358 BTC on Ocak 9, 2025. In contrast, there was a net outflow of -3,249 BTC on Ocak 08, 2025. The Bitcoin price started at $95,026 on Ocak 08, 2025 and rose to $96,530 by the end of the week. Notably, on Ocak 09, 2025, the price fell to $92,676, but prices remained on an upward trend throughout the week.
| Tarih | 8-Jan | 9-Jan | 10-Jan | 11-Jan | 12-Jan | 13-Jan | 14-Jan |
|---|---|---|---|---|---|---|---|
| Exchange Inflow | 46,407 | 32,131 | 27,310 | 10,097 | 12,112 | 32,363 | 36,783 |
| Exchange Outflow | 49,656 | 28,774 | 27,213 | 10,284 | 8,681 | 30,343 | 35,681 |
| Exchange | -3,249 | 3,358 | 97 | -187 | 3,432 | 2,020 | 1,102 |
| Döviz Rezervi | 2,354,064 | 2,357,422 | 2,357,519 | 2,357,332 | 2,360,764 | 2,362,783 | 2,363,886 |
| BTC Price | 95,026 | 92,676 | 94,713 | 94,594 | 94,492 | 94,563 | 96,530 |
The increase in Bitcoin reserves in stock exchanges reduced the selling pressure on the market in the short term and contributed to a gradual recovery in prices. Prices remained more stable, especially on days with high net inflows. In contrast, the net outflows seen at the beginning of the week suggest that investors tend to take profit realizations or adjust their positions according to market expectations. In the long run, continued reserve increases may lead to excess supply in the market and put pressure on prices. However, in the short term, market dynamics continue to be mostly shaped by entry-exit movements and investor sentiment.
Ücretler ve Gelirler
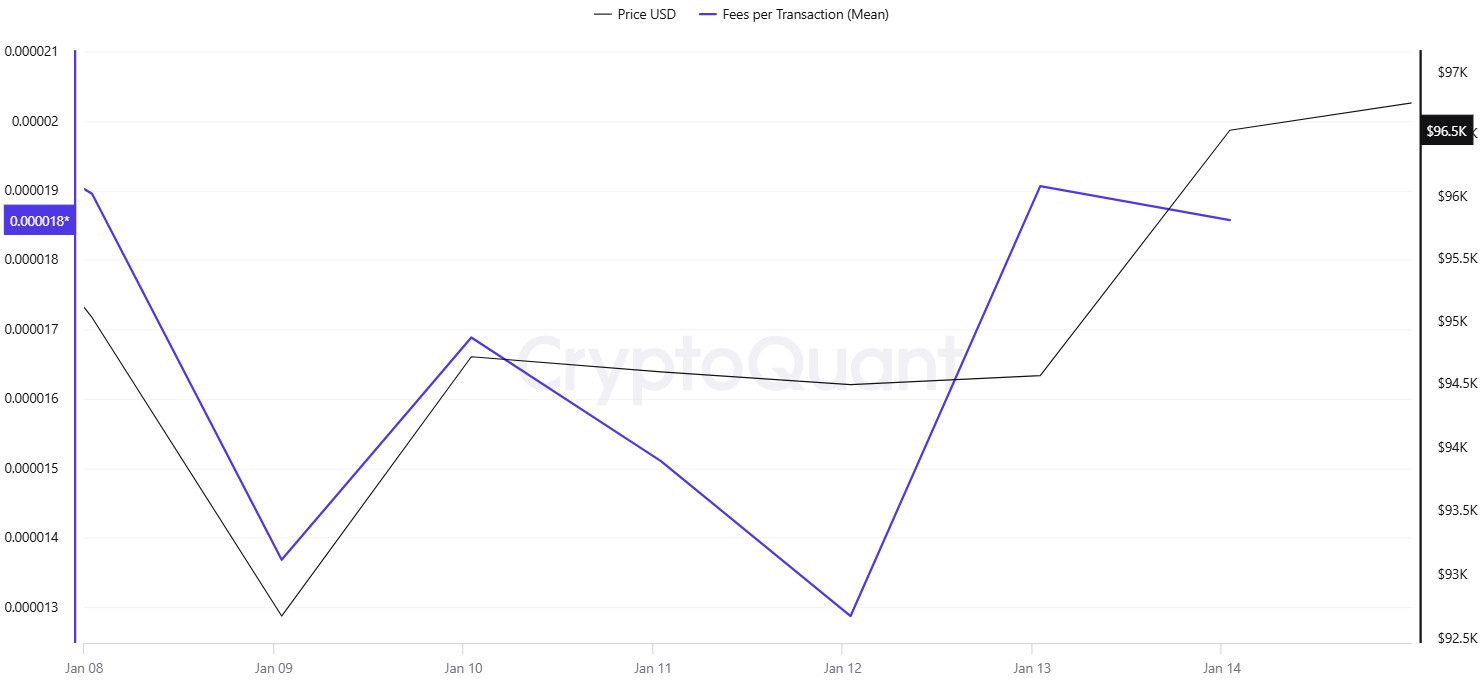
When the data of Bitcoin Fees per Transaction (Mean) between Ocak 08-14, it was observed that this value was at 0.00001895 on Ocak 08, the first day of the week. Until Ocak 10, Bitcoin Fees per Transaction (Mean), which followed a parallel course with Bitcoin price, decreased in the following days due to the horizontal movements in Bitcoin price. In this context, it fell to 0.00001287 on Ocak 12, reaching the lowest value of the week.
On Ocak 13th, with the sharp drop in Bitcoin price and increased volatility, Fees per Transaction (Mean) value started to rise again and reached 0.00001906. This value was also recorded as the highest level of the week.
Miner Flows
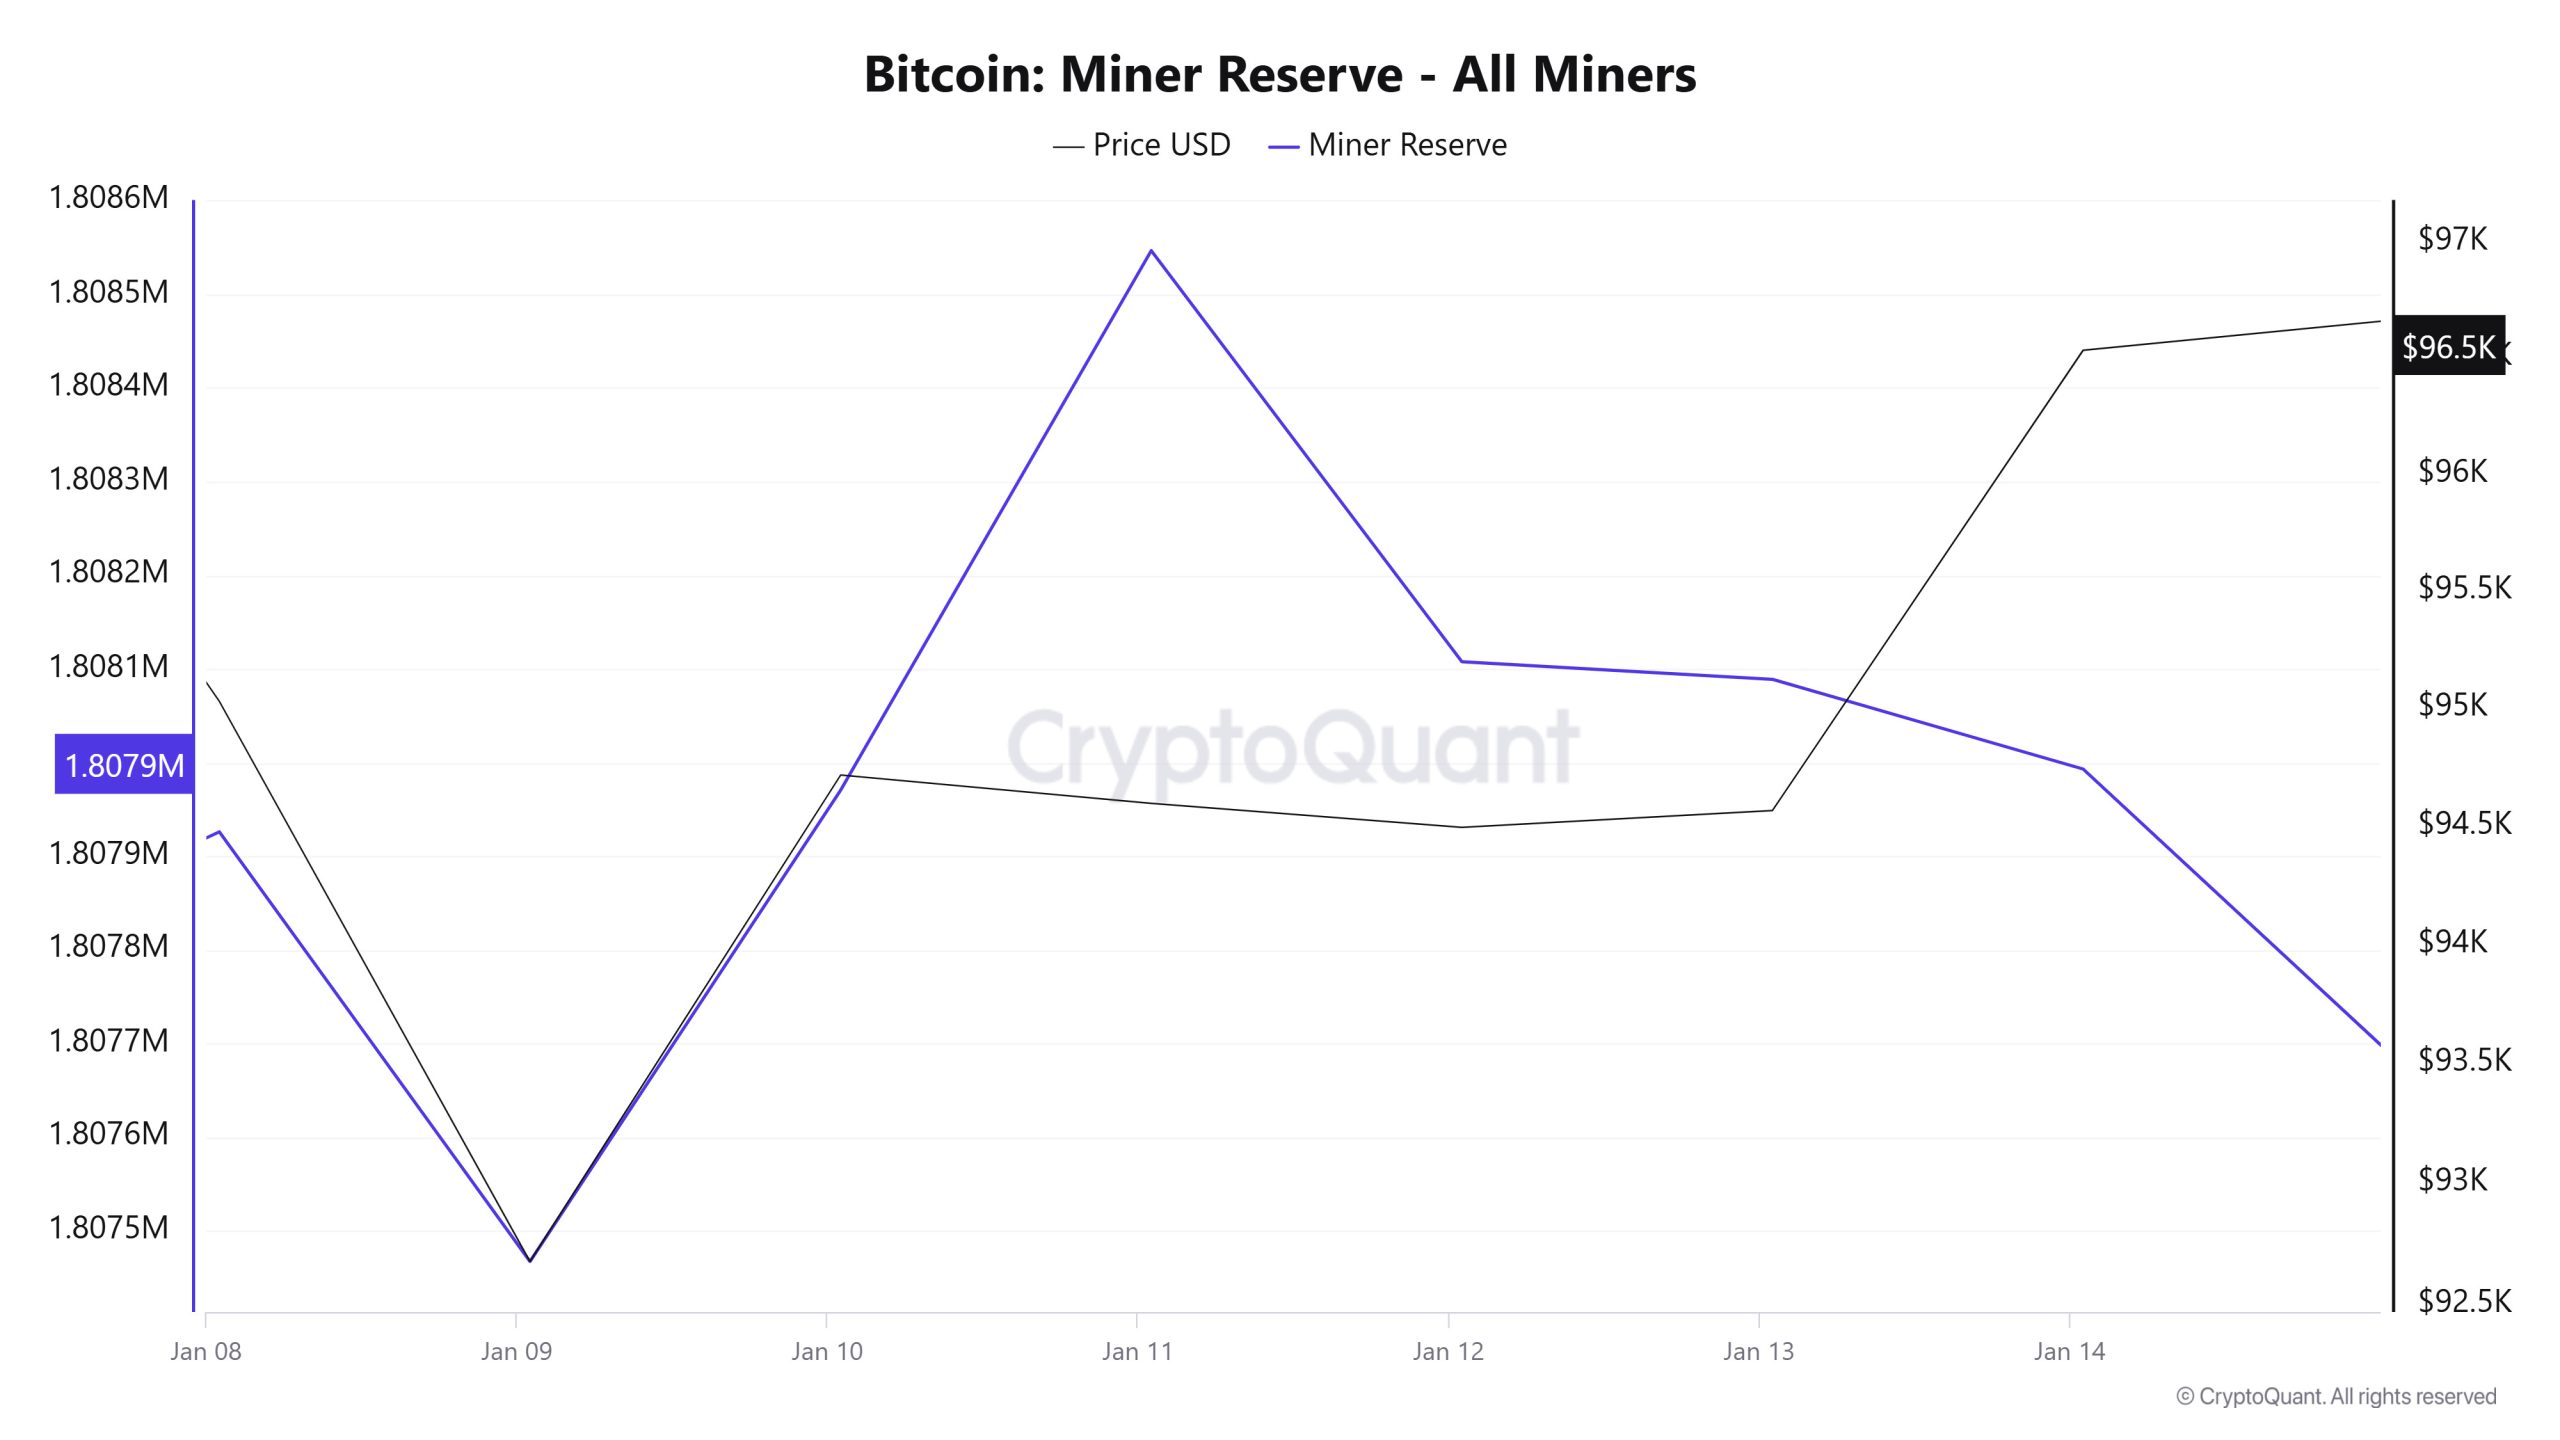
As can be seen in the Miner Reserve chart, the number of Bitcoins in miners’ wallets increased this week. Although the week started with a positive correlation between Miner Reserve and Bitcoin price, this correlation turned negative towards the end of the week.
Miner Inflow, Outflow and NetFlow
Between Ocak 8 and Ocak 14, 38,562 Bitcoins exited miners’ wallets and 38,784 Bitcoins entered miners’ wallets between the same dates. This week’s Miner Netflow was 222 Bitcoin. On Ocak 8, the Bitcoin price was $95,026, while on Ocak 14 it was $96,530.
During the week, the net flow (Miner Netflow) was generally positive as Bitcoin inflow into miner wallets (Miner Inflow) was higher than Bitcoin outflow from miner wallets (Miner Outflow).
If the negative correlation between Miner Reserve and Bitcoin price continues in the coming week, increased inflows to miner wallets may create a selling reaction in the market, and possible increases in Miner Netflow may have a downward impact on Bitcoin price.
| Ocak 8 | Ocak 9 | Ocak 10 | Ocak 11 | Ocak 12 | Ocak 13 | Ocak 14 | |
|---|---|---|---|---|---|---|---|
| Miner Inflow | 6,145.41 | 6,505.27 | 7,142.91 | 2,975.08 | 3,606.77 | 7,030.65 | 5,378.75 |
| Miner Outflow | 5,990.12 | 6,964.03 | 6,639.89 | 2,398.66 | 4,045.94 | 7,049.33 | 5,474.56 |
| Miner Netflow | 155.28 | -458.76 | 503.02 | 576.43 | -439.17 | -18.68 | -95.81 |
İşlem
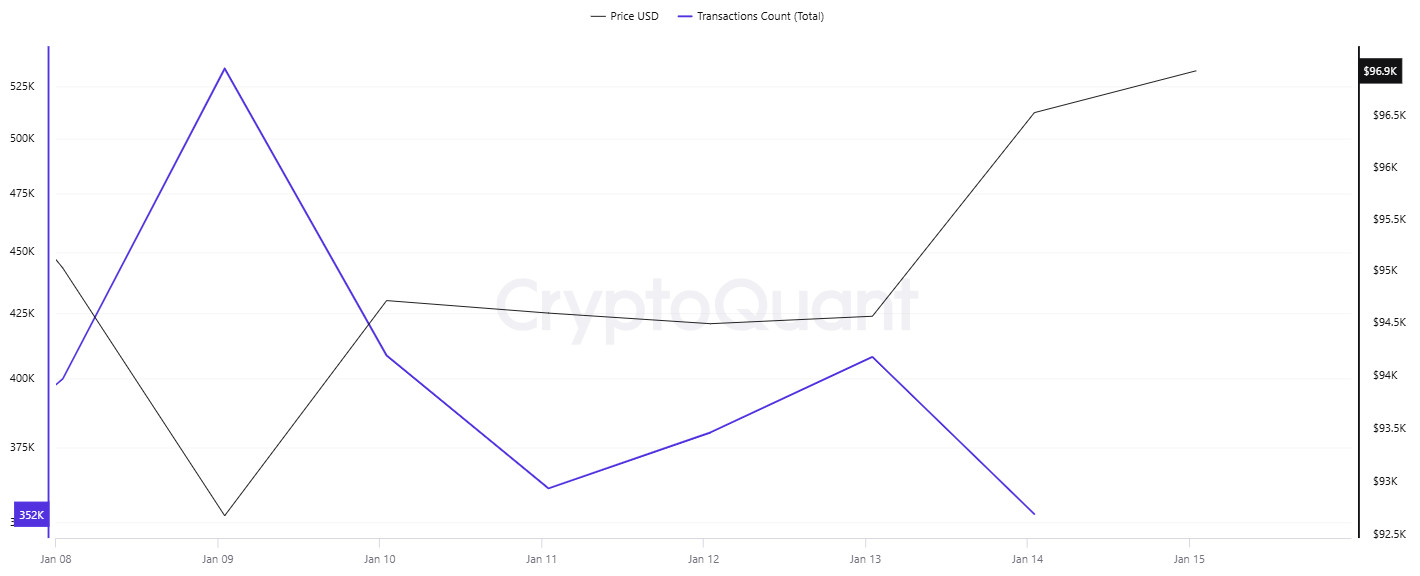
Transaction Count
On Ocak 8, the number of transfers was on a downward trend, while on Ocak 9 there was a sudden peak and an intense increase in the number of transfers. Subsequently (the weekend of Ocak 11-12 was excluded due to the lack of routine transfers), the number of transfers gradually started to decline, reaching a low on Ocak 14. Unusually, the direct correlation between the number of transfers and the Bitcoin price was more of an inverse correlation last week. This inverse correlation between the price and the number of transfers strengthens the possibility that the transfers made on the network may have created selling pressure by flowing Bitcoin from wallets to exchanges.
Tokens Transferred
It is observed that the direct proportion between the amount of Bitcoin transferred, and the price has been maintained this week. However, it is noteworthy that on Ocak 9, when the number of transactions peaked, the amount of Bitcoin transferred remained lower than on other days. This suggests that the increase in the number of transfers during the price drop on Ocak 9 may have been driven by small investors.
Whale Activities
The number of large transactions on the Bitcoin network dropped from 33,450 to 16,180 in the past month, a decrease of 51.64%. This indicates a significant reduction in whale activity. On the other hand, while selling pressure is increasing in the Bitcoin market, buyers are waiting at deep levels, indicating that prices may rise again in the near future.
In a statement on the subject, Hyblock Capital explained how investors are waiting for opportunities: At the price level on the order book, there was an uptrend, but now that trend has turned bearish, signaling the selling pressure that market makers usually operate under.
As a result, after the recent drop in the Bitcoin price, it was not surprising that selling pressure prevailed at these levels. Bitcoin has fallen from $102,000 to $90,000 in recent days, mainly due to US inflation concerns. From the 1% to 2% level to the 2% to 5% level, the same action continued. This showed that there were more sell orders than buy orders in the market and buyers were waiting to enter the market at these levels. After this decline, the whales stepped in as buyers, with more buy orders, and the market recovered, trading above $97,000 at the time of writing.
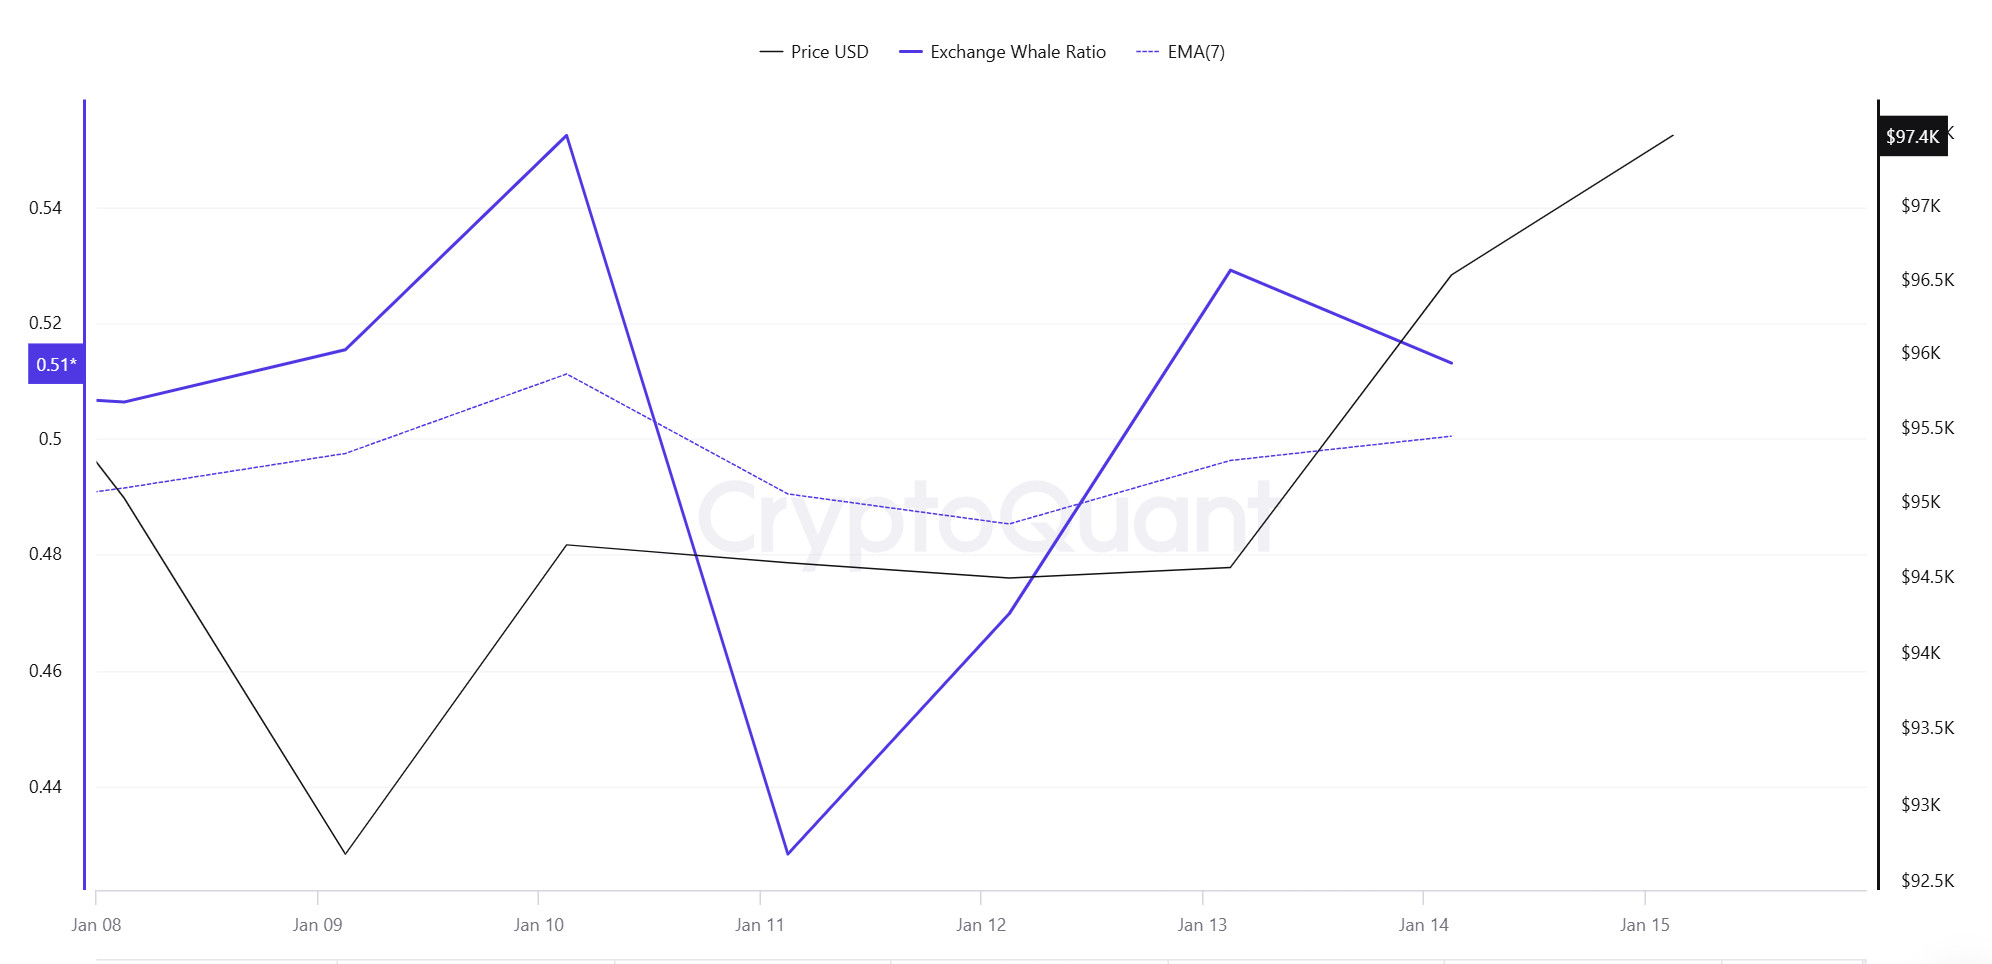
Whales Data:
When we look at the last 7 days of whale movements, it shows that central exchanges are used by whales in a high way. When we look at this ratio, it is seen at a rate of 0.51, while central exchanges have been used with the same intensity according to the last 7 days. When this ratio is above 0.350, it usually means that whales often use central exchanges. This may mean that there may be selling pressure at any moment. In the first half of this week, more BTC sellers used centralized exchanges. At the same time, when we look at the total BTC transfer, it is seen that approximately 4,760,329 BTC moved, an increase compared to last week.
YASAL BİLDİRİM
Bu dokümanda yer alan yatırım bilgi, yorum ve tavsiyeleri yatırım danışmanlığı hizmeti niteliği taşımamaktadır. Yatırım danışmanlığı hizmeti, yetkili kuruluşlar tarafından kişilerin risk ve getiri tercihleri dikkate alınarak kişiye özel olarak verilir. Bu dokümanda yer alan yorum ve tavsiyeler genel niteliktedir. Bu tavsiyeler mali durumunuz ile risk ve getiri tercihlerinize uygun olmayabilir. Bu nedenle, sadece bu dokümanda yer alan bilgilere dayanarak yatırım kararı vermeniz beklentilerinize uygun sonuçlar doğurmayabilir.
NOTE: All data used in Bitcoin onchain analysis is based on Cryptoqaunt.

