
BTC/USDT
Looking at the key developments, the US House of Representatives is preparing to vote on the “GENIUS Act” stablecoin bill, while the Treasury Department officially canceled broker reporting requirements for decentralized exchanges. Fed official Moussallem emphasized that stablecoins could play an important role in payment systems, while another Fed member, Waller, left the door open for a rate cut in July. Daly stated that the economy is in good shape, with strong growth and employment, and inflation declining.
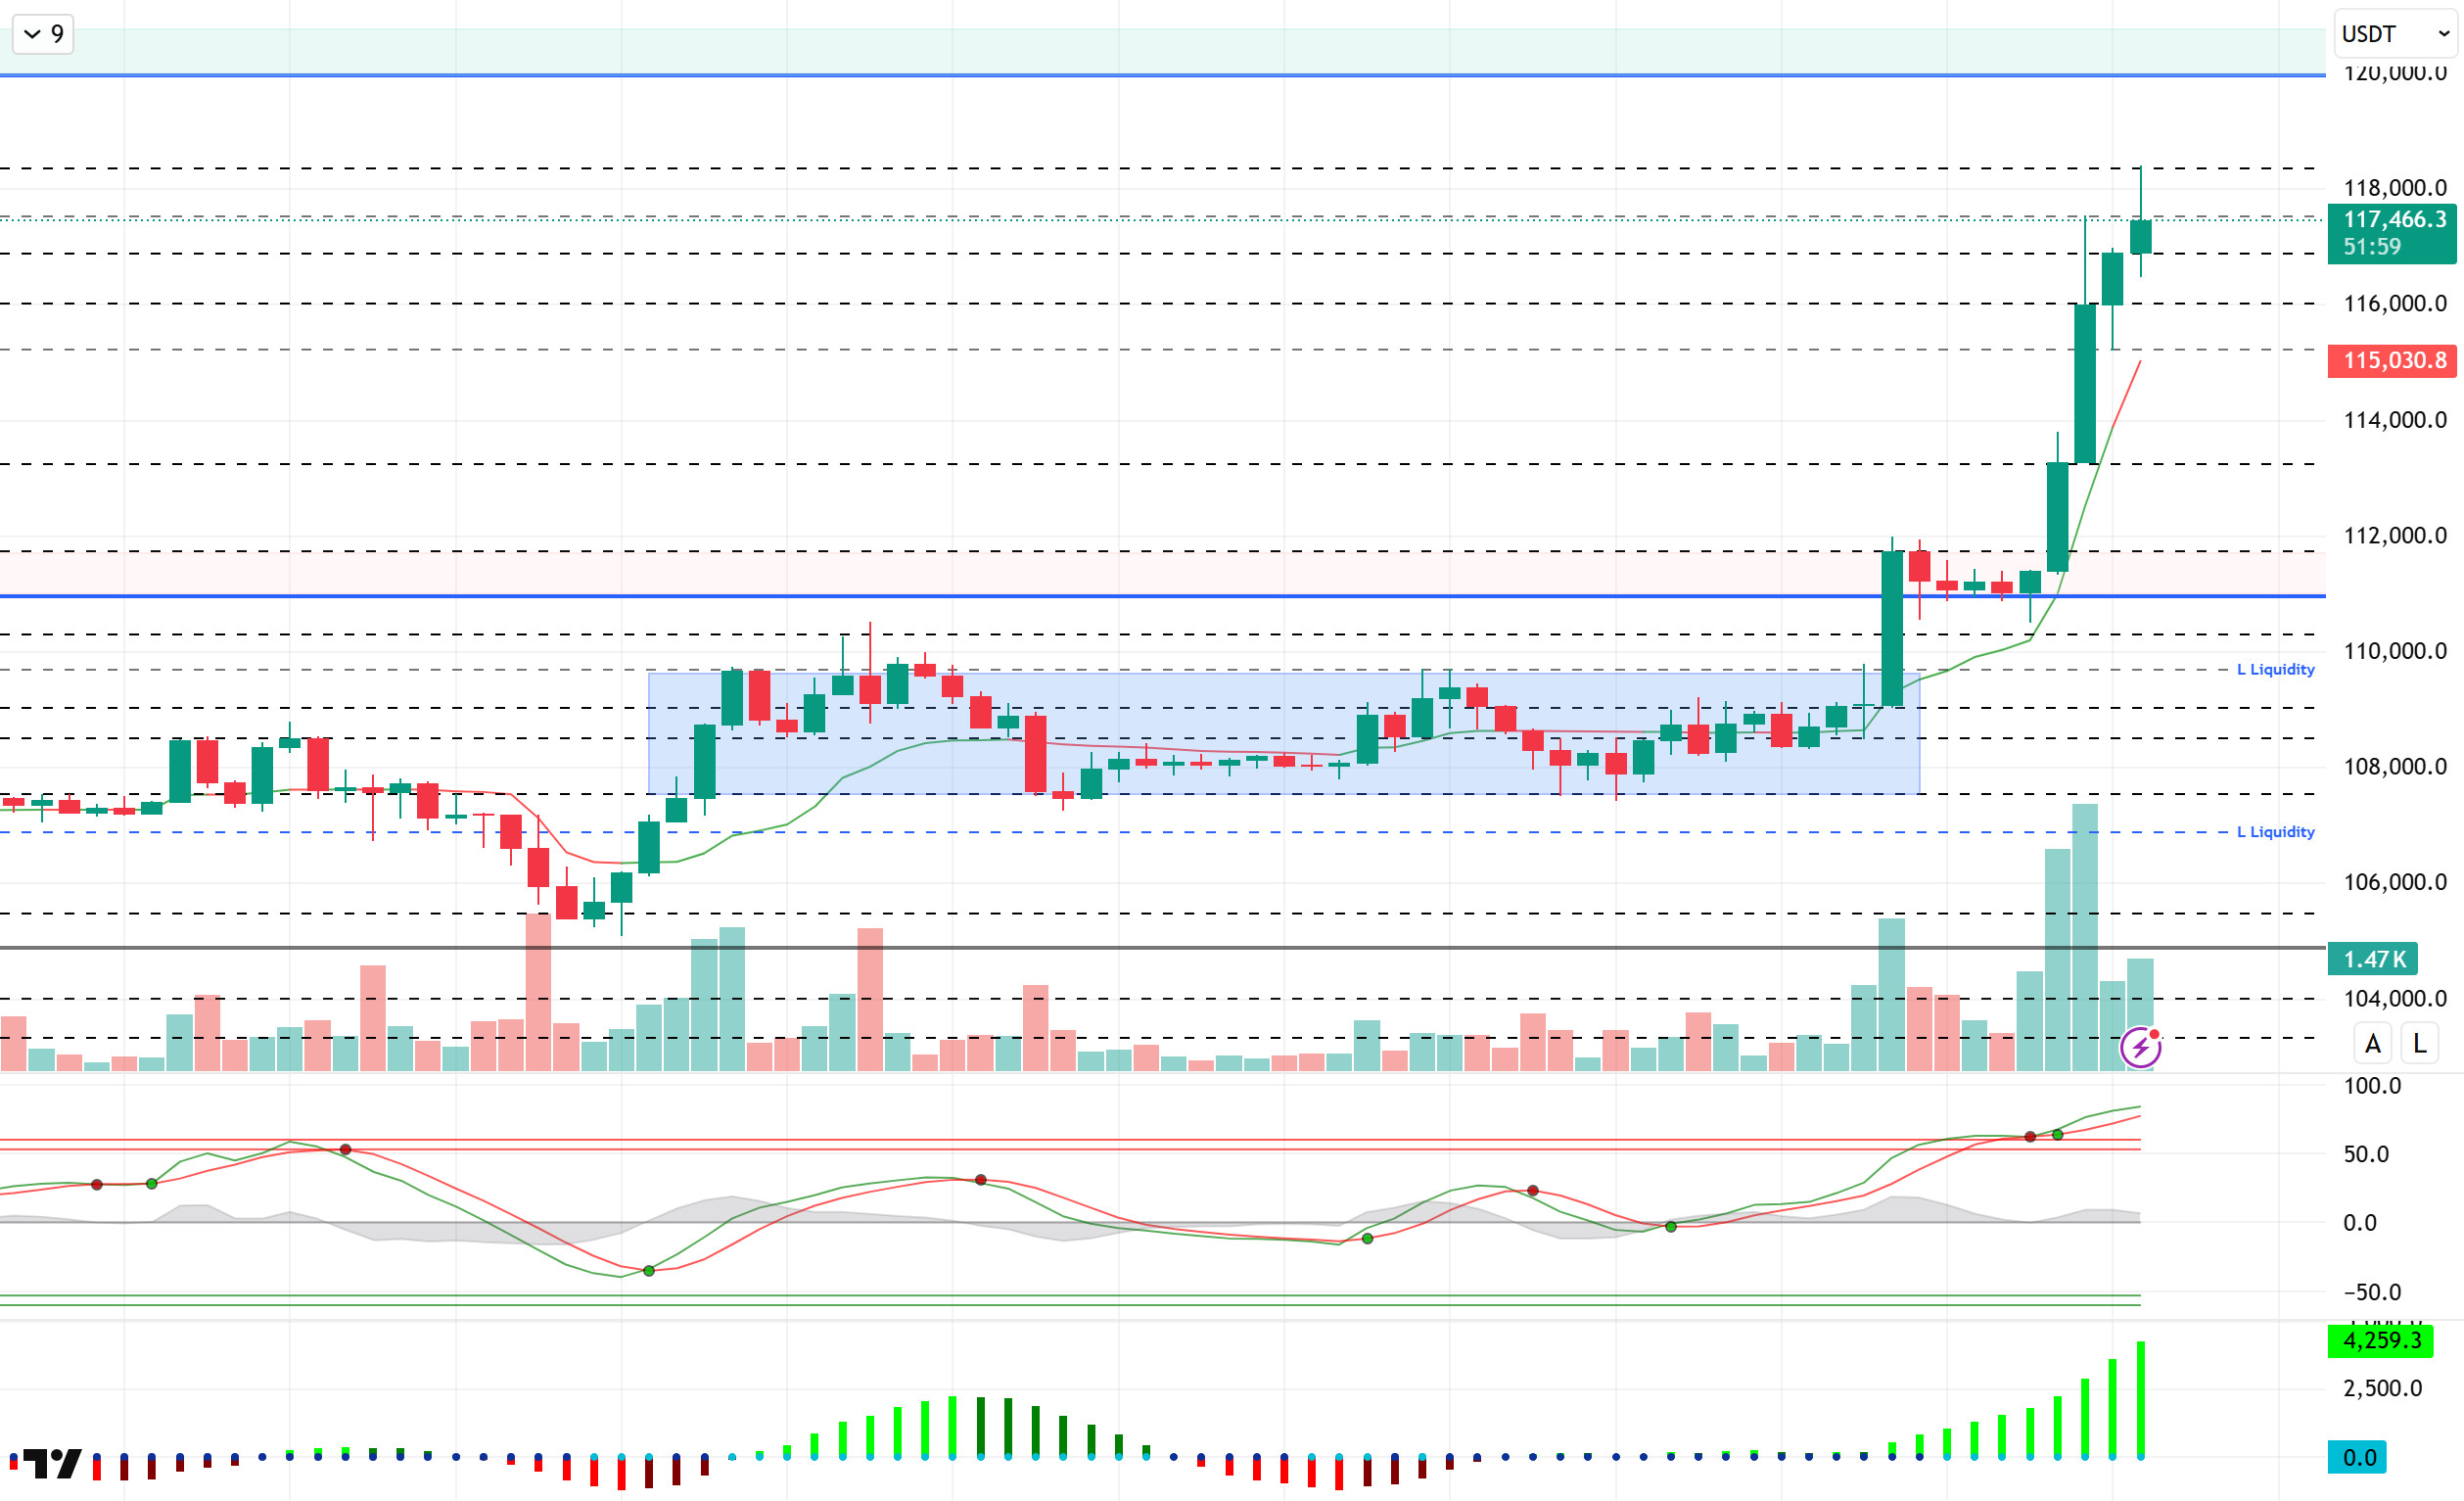
Bitcoin rallied with a 6% daily increase, reaching an all-time high of $118,400. The total value of the cryptocurrency market reached $3.7 trillion. Bitcoin’s market dominance rose to 65%. In the institutional investment sector, Smarter Web Company and KULR attracted attention with new purchases, while Bitcoin spot ETFs saw a net inflow of $1.17 billion. Additionally, 6,924 BTC was transferred from whale wallets that had been inactive for a long time. In the options market, $4 billion worth of BTC contracts expired today.
Looking at the technical picture, the BTC price tested the 112,000 level yesterday, then recorded a slight pullback and formed a minor flag pattern, retreating to the 110,500 level. After regaining momentum, BTC showed an aggressive rise this time and reached 118,400, its all-time high. As of the time of this analysis, BTC is maintaining its strong stance and continues to trade near its all-time high at 117,800, with high volatility and increasing volume.
Technical indicators, Wave Trend (WT) entered the overbought zone with the latest uptrend, signaling a trend reversal, despite showing divergence with the upward movement. However, the Squeeze Momentum (SM) indicator’s histogram moved into the positive zone, continuing to provide momentum support without showing signs of weakening. The Kaufman moving average has risen to the 115,000 level.
Looking at liquidity data, a short-term accumulation of buy positions at the 110,000 level is observed, while a strong accumulation of buy positions at the 106,600 level continues over a broader time frame. The fact that this upward movement began without these positions closing is quite notable, and we once again witnessed one of BTC’s aggressive movements within its market cycle.
In summary, while fundamental developments continue to act as catalysts for pricing, the developments mentioned above have created a driving force for pricing. Technically, despite showing weakness after an upward movement in the short term, increasing momentum and risk appetite have pushed the price to its ATH level. Liquidity data failed to hinder the upward trend. From this point forward, psychological levels will be monitored for BTC, with the 120,000 level serving as a resistance zone. In the event of potential profit-taking, the 116,800 – 116,000 range will be monitored as minor support levels.
Supports 116,800– 116,000 – 115,000
Resistances 118,400 – 120,000 – 125,000
ETH/USDT
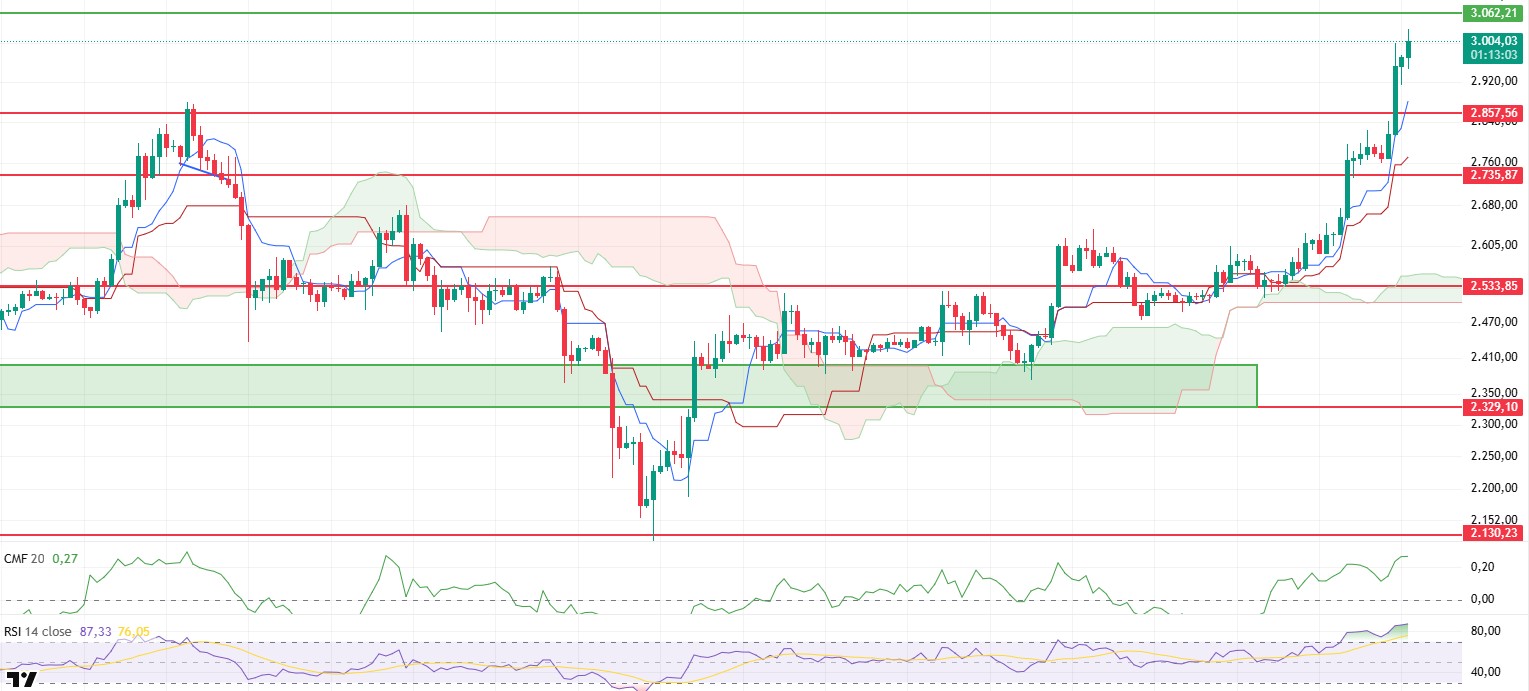
Ethereum gained significant momentum yesterday evening, rising to the $3,000 level, driven by strengthening technical indicators and positive on-chain data. By morning, this level was also surpassed, with the 3,000 dollar band breaking upward, leaving behind a technically critical resistance zone. This movement has reinforced market participants’ confidence in the upward trend, while the alignment of technical and fundamental indicators is drawing attention to the price’s ability to maintain its current levels.
When on-chain data is analyzed, it is evident that the Cumulative Volume Delta (CVD) indicator plays a decisive role in price increases driven by high-volume purchases from spot markets. This indicates that the upward trend is supported by healthy buying interest and is not driven by artificial price movements. On the other hand, funding rate data continuing to show an upward trend indicates an increase in long positions in futures markets and that investors are maintaining their upward expectations. However, this situation also brings the risk of volatility due to the high concentration of leveraged positions.
The Chaikin Money Flow (CMF) indicator remains in positive territory, accompanying the upward movement of the price. Continued liquidity inflows indicate that internal market fund flows are also positive and buyer interest is sustained. This provides structural support for the price to remain at current levels.
The Relative Strength Index (RSI) indicator continues to move in the overbought zone alongside the upward trend. Although there are no signs of weakening momentum yet, the RSI remaining in this zone indicates that the risk of a correction should not be ignored.
Overall, technical and fundamental indicators suggest that the price may continue its upward trend. The $3.062 level is important as the next resistance point, and if this level is clearly broken, the uptrend could take on a more aggressive form. On the other hand, in a potential correction scenario, the 2,857 dollar level emerges as a critical support level. A sustained break below this support level does not appear likely in the short term given the current market structure; however, the possibility of pullbacks should not be overlooked, especially considering the RSI’s current position.
Top of Form
Below the Form
Supports 2,857 – 2,735 – 2,533
Resistances 3.062 – 3.246 – 3.455
XRP/USDT
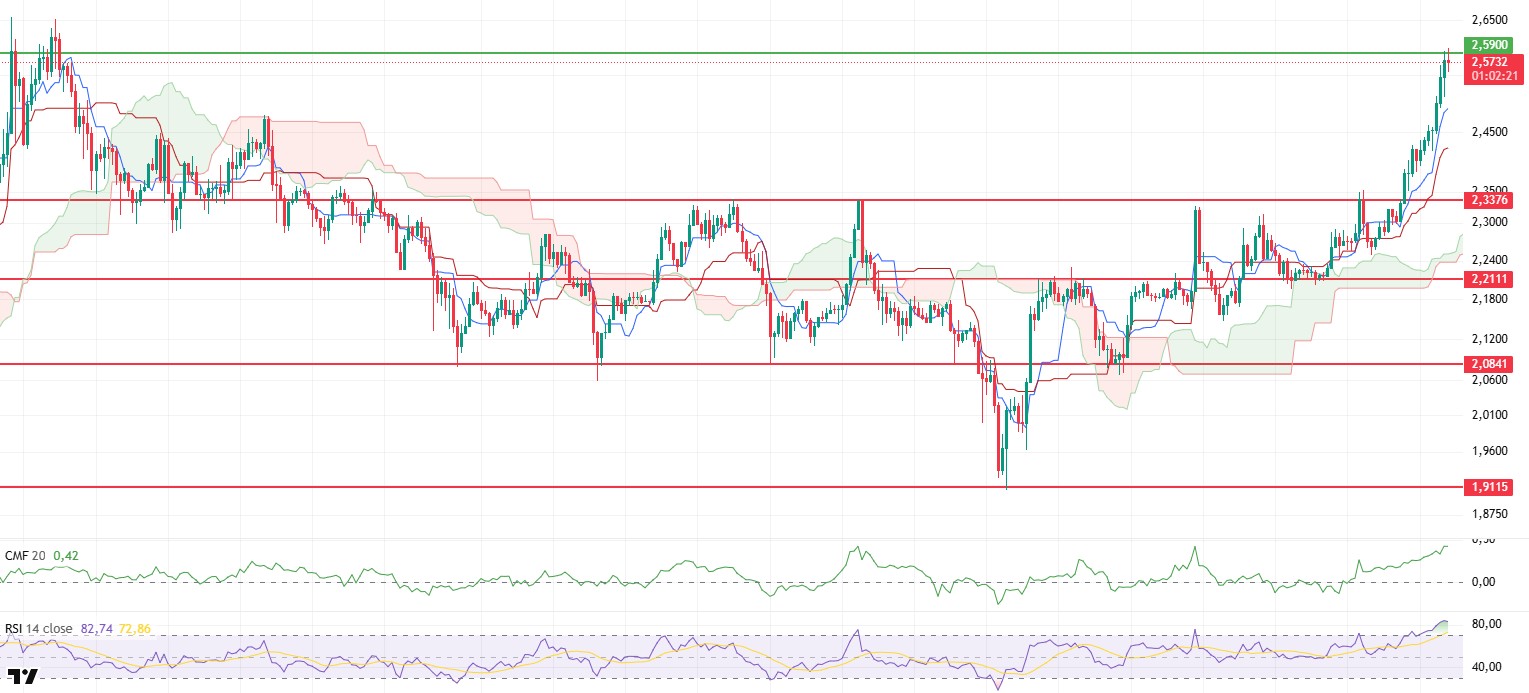
XRP strengthened its upward trend, which began when it surpassed the $2.33 level, and managed to climb to $2.59. This level stands out as a technically significant resistance point, but despite the price experiencing a slight pullback from this area, the absence of any clear weakening signals in technical indicators suggests that the current upward trend is sustainable. Particularly, the sustained strong buyer interest and the market structure exhibiting supportive characteristics are increasing the likelihood of the price breaking above the 2.59 dollar resistance level.
When technical indicators are examined in detail, it can be seen that the Chaikin Money Flow (CMF) indicator continues to rise steadily in positive territory. This indicates that liquidity entering the market is increasing significantly and capital inflows are continuing, providing a structural foundation for price movements. The CMF’s upward trend indicates that buyer pressure in the market remains strong.
The Relative Strength Index (RSI) indicator continues to move in the overbought zone. While this keeps the possibility of a short-term correction on the table, the fact that the price remains strong despite the RSI being in an overbought condition indicates that market momentum has not weakened. Additionally, the absence of any significant weakening signals in the Ichimoku cloud components further supports the technical outlook for the upward trend to persist.
Overall, even if it doesn’t happen during the day, there’s still a chance that XRP could keep going up and hit $2.59 by the evening. If it stays above this level, we could see things pick up even more. On the other hand, the $2.33 level stands out as an important support point in case of potential pullbacks. A break below this level could weaken the technical structure and pave the way for deeper sell-offs. Therefore, the preservation of this support level will play a decisive role in the short-term outlook.
Supports 2.2111 – 2.0841 – 1.9115
Resistances 2.3376 – 2.5900 – 2.8347
SOL/USDT
BIT Mining is entering the Solana ecosystem and plans to create a SOL treasury of up to $300 million in several phases. DeFi Dev Corp has purchased 153,225 tokens worth $23.7 million.
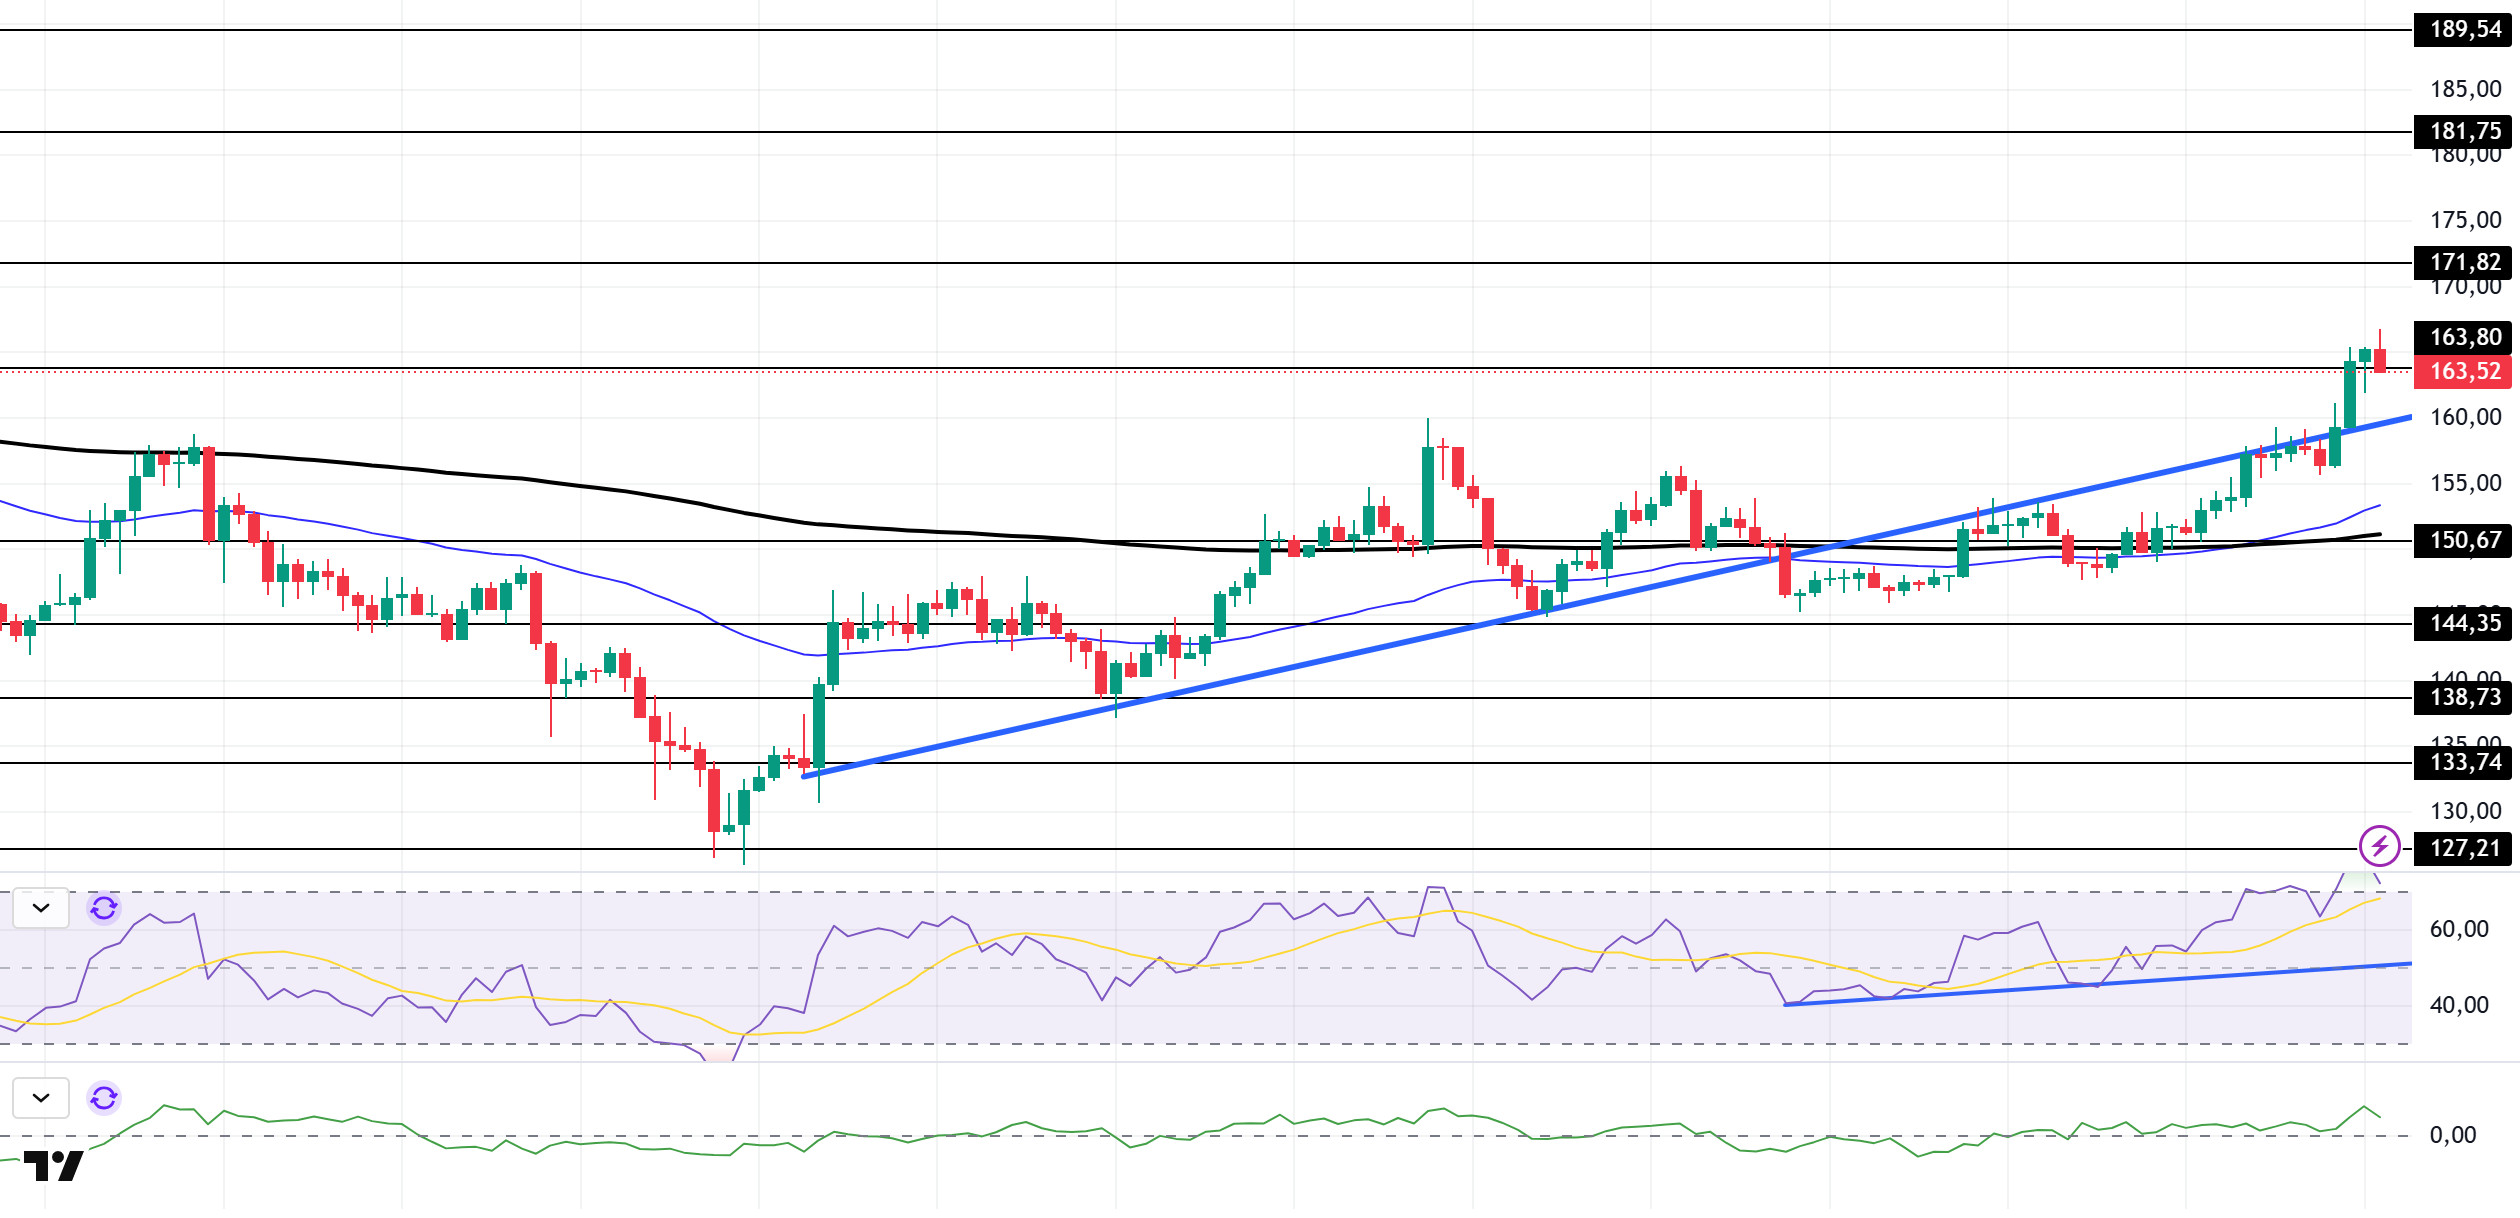
SOL continued its upward trend. The asset broke the upward trend that began on June 23, breaking through the strong resistance level of $163.80, and continued its upward movement. As of now, the price continues to accelerate, and if the acceleration continues, the $171.82 level should be monitored as a resistance level.
On the 4-hour chart, the 50 EMA (Blue Line) remains above the 200 EMA (Black Line). This indicates that the medium-term upward trend may continue. Additionally, the price being above both moving averages suggests that the market is currently in a short-term upward trend. Chaikin Money Flow (CMF-20) has remained in positive territory; however, an increase in money inflows could push CMF to the upper levels of the positive zone. Relative Strength Index (RSI-14) remains in positive territory and is in the overbought zone. This could trigger profit-taking. Additionally, it remains above the upward trend that began on July 4. If there is an upward movement due to macroeconomic data or positive news related to the Solana ecosystem, the $171.82 level emerges as a strong resistance point. If this level is broken upward, the upward movement is expected to continue. In the event of a pullback due to adverse developments or profit-taking, the $150.67 level could be tested. A decline to these support levels could see an increase in buying momentum, potentially presenting a buying opportunity.
Supports 163.80 – 150.67 – 144.35
Resistance levels 171.82 – 181.75 – 189.54
DOGE/USDT
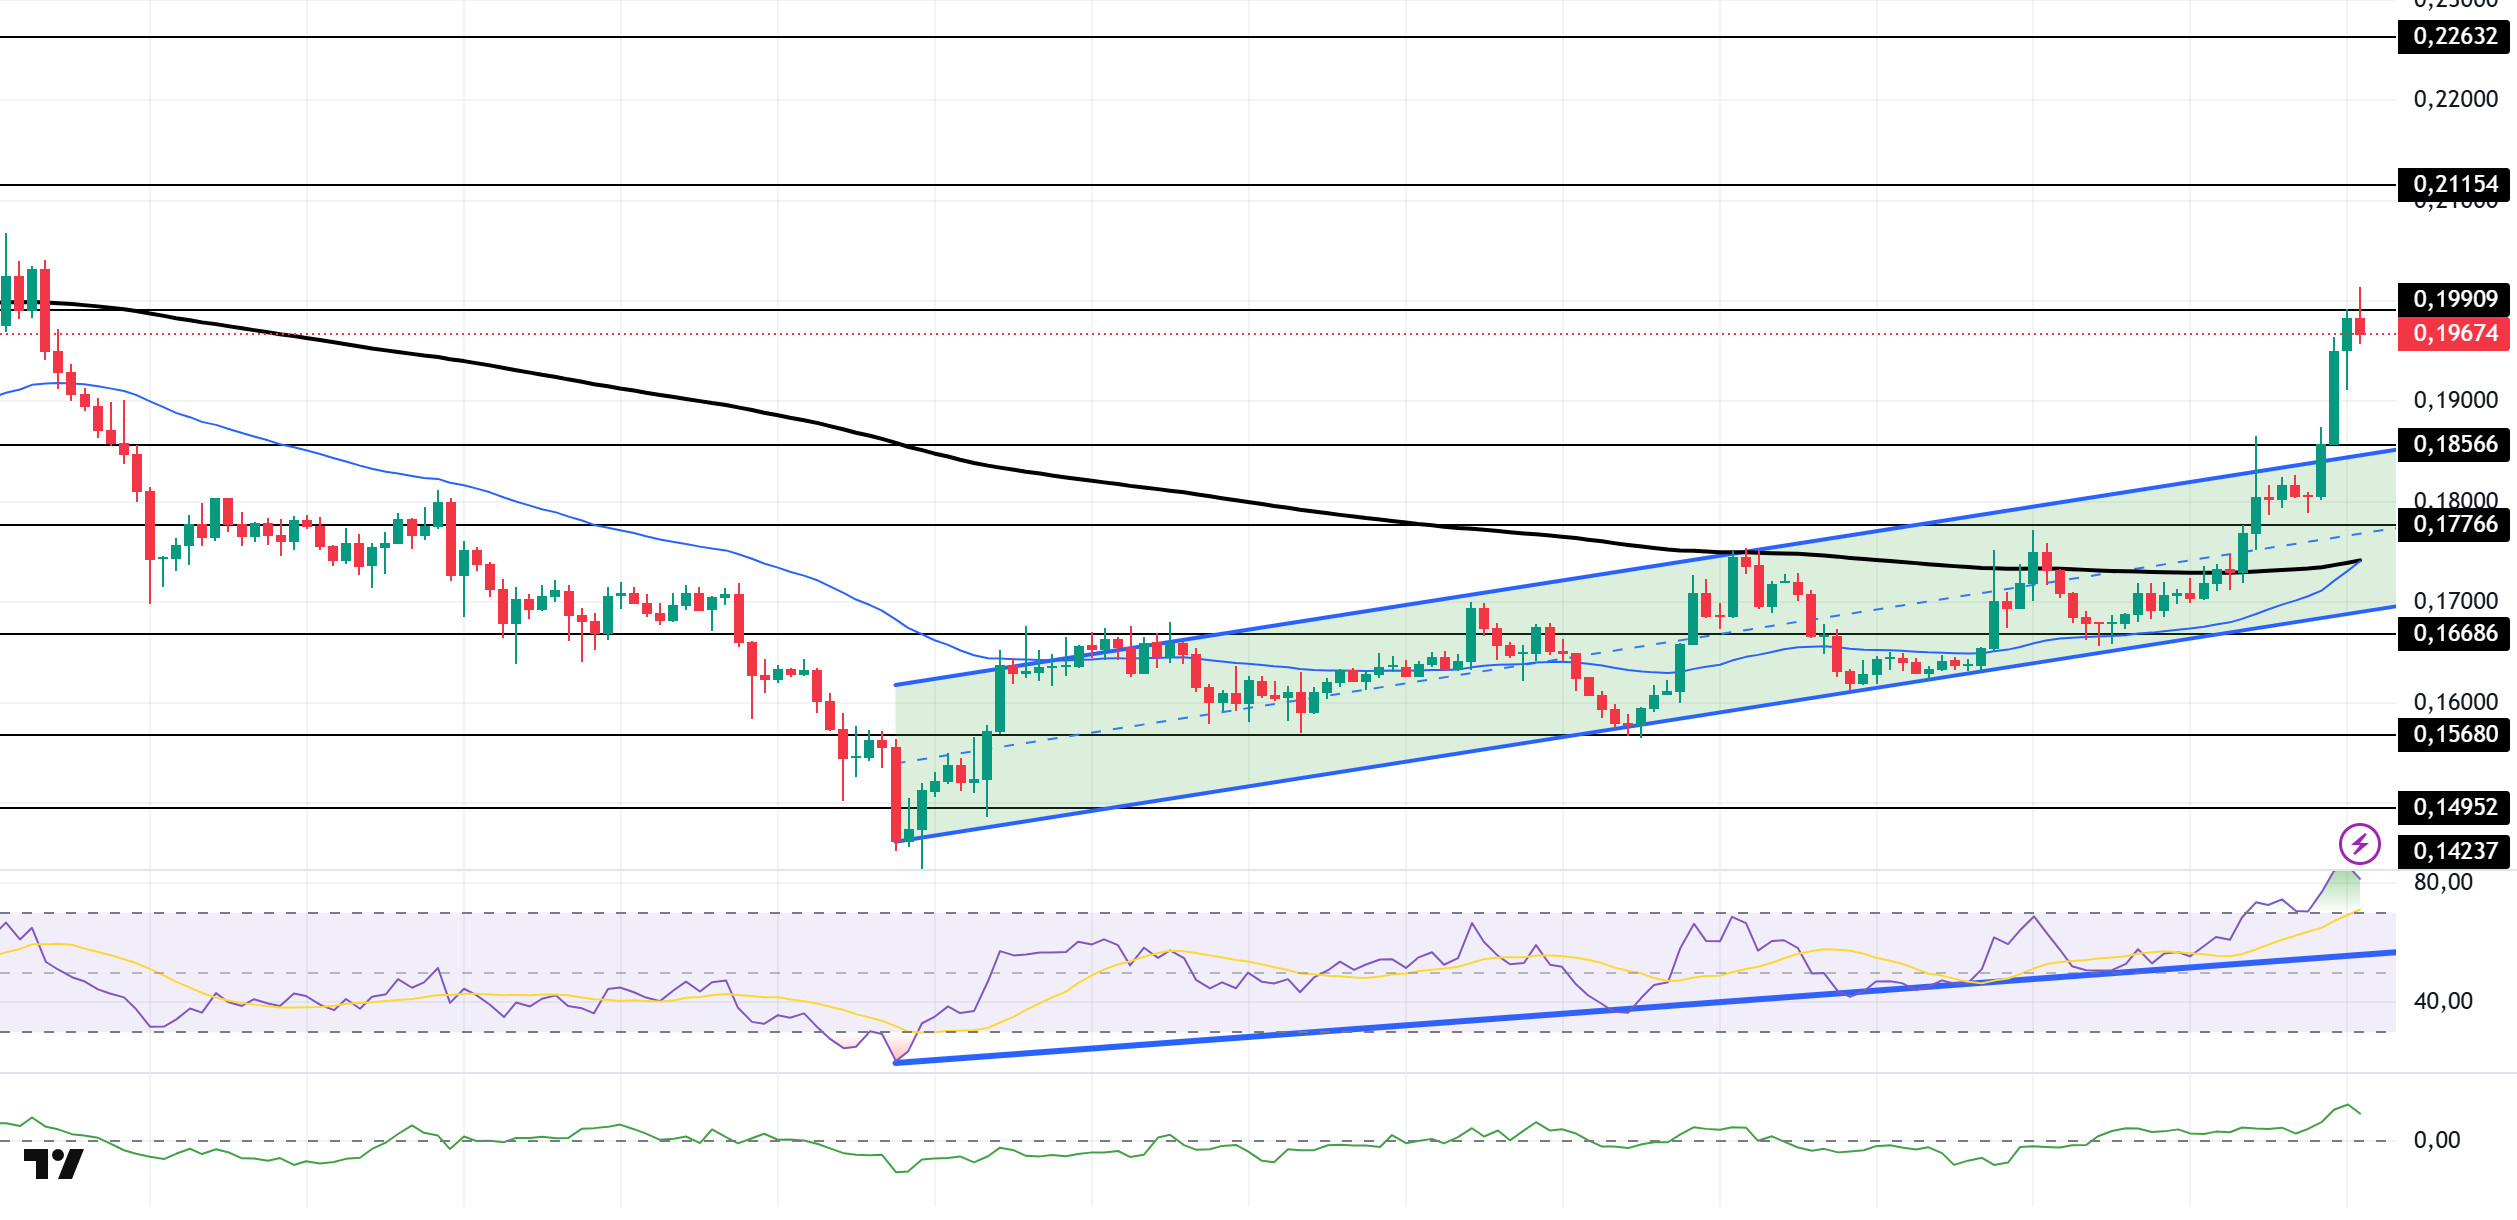
DOGE price continued its upward trend.
The asset managed to stay above the 200 EMA (black line) moving average and broke through the ceiling of the upward trend that began on June 22 with a strong candle, continuing its momentum. If the momentum continues, the $0.21154 level can be monitored.
On the 4-hour chart, the 50 EMA (Blue Line) remains below the 200 EMA (Black Line). This indicates that the asset is in a downtrend in the medium term. The price being above both moving averages signals that the asset is in an uptrend in the short term. Chaikin Money Flow (CMF-20) remains in positive territory. Additionally, negative cash inflows could push the CMF into the negative zone. The Relative Strength Index (RSI-14) is in the overbought zone and continues to remain above the upward trend that began on June 22, supported by that trend. Being in the overbought zone may trigger profit-taking. In the event of upward movements driven by political developments, macroeconomic data, or positive news flow within the DOGE ecosystem, the $0.21154 level emerges as a strong resistance zone. In the opposite scenario or in the event of negative news flow, the 0.18566 dollar level could be triggered. A decline to these levels could increase momentum and potentially initiate a new upward wave.
Supports 0.18566 – 0.17766 – 0.16686
Resistance levels 0.19909 – 0.21154 – 0.22632
Legal Notice
The investment information, comments and recommendations contained herein do not constitute investment advice. Investment advisory services are provided individually by authorized institutions taking into account the risk and return preferences of individuals. The comments and recommendations contained herein are of a general nature. These recommendations may not be suitable for your financial situation and risk and return preferences. Therefore, making an investment decision based solely on the information contained herein may not produce results in line with your expectations.