
BTC/USDT
In the Beige Book report published by the Fed, it was stated that economic activity increased slightly, and the outlook was described as “slightly pessimistic”. Atlanta Fed President Bostic emphasized that inflation may have reached an inflection point and stated that caution should be exercised on interest rate cuts. On the other hand, Trump said that he has no plans to dismiss Fed Chairman Powell, but continued his criticism and announced that he may consider Kevin Hassett for a Fed-related post. Democratic Senator Warren argued that a member of the Trump administration should not be the Fed chair. Trump also signaled a new move on the global trade front by announcing that they will announce uniform tariffs on 150 countries on August 1.
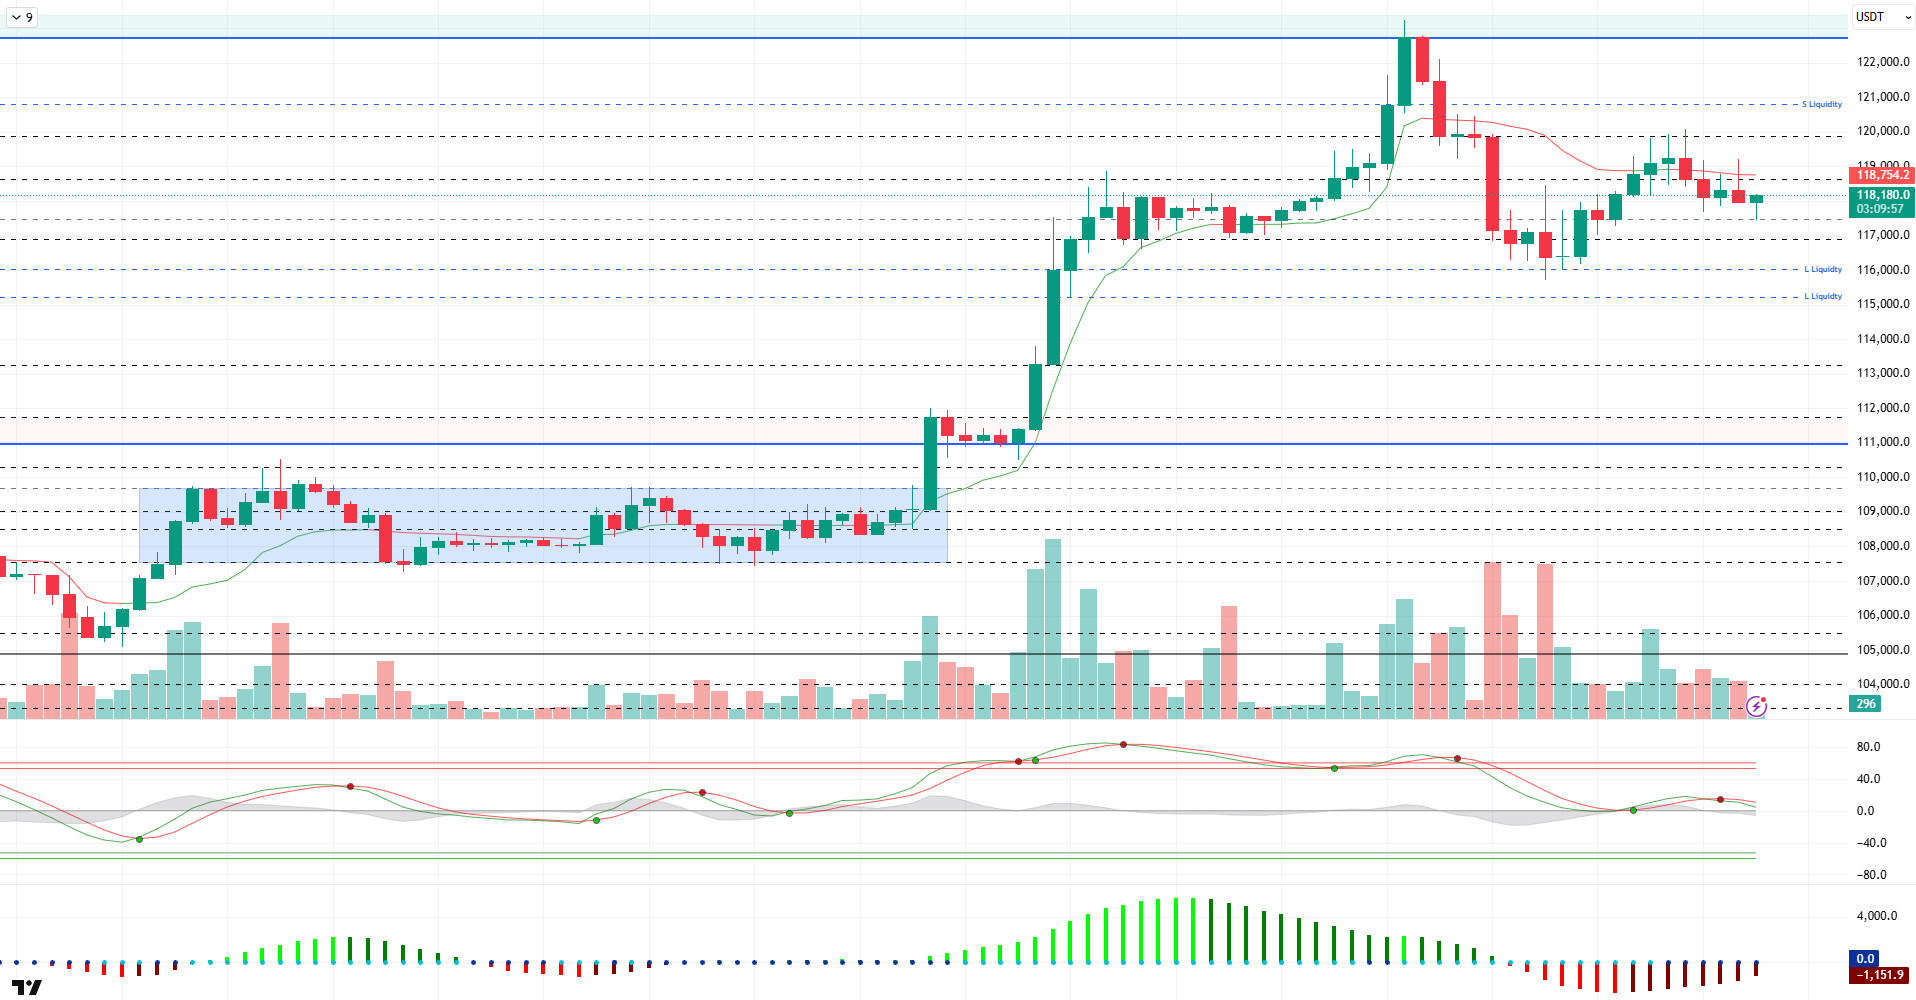
Looking at the technical outlook, the BTC price turned upwards after the bullish correction and tested the 120,000 level. The price then fell again and at the time of writing, it continues to trade at 117,800.
Looking at the technical indicators, the Wave Trend (WT) oscillator is unstable in the channel mid-band with the recent decline, while the histogram on the Squeeze momentum (SM) indicator is trying to regain strength. The Kaufman moving average is just above the price at 118.750.
Analyzing the liquidity data, with the recent rise, buy trades at 118,500 and 120,000 levels were liquidated respectively. The most concentrated liquidity zone was around the 115,000 level, while selling positions were re-accumulated above the 120,000 level.
In sum, the price continues to correct after reaching the new ATH level as fundamental developments continue to contribute positively to pricing. While the technical outlook is unstable in the mid-channel band in the short term, liquidity data reflects that buying positions are dominant. In the continuation of the rise, 120,000 is followed as a minor resistance point, while in a possible selling pressure, we will follow the 117,500 support level.
Supports 117,500 – 116,800 – 116,000
Resistances 118,600 – 120,000 – 121,000
ETH/USDT
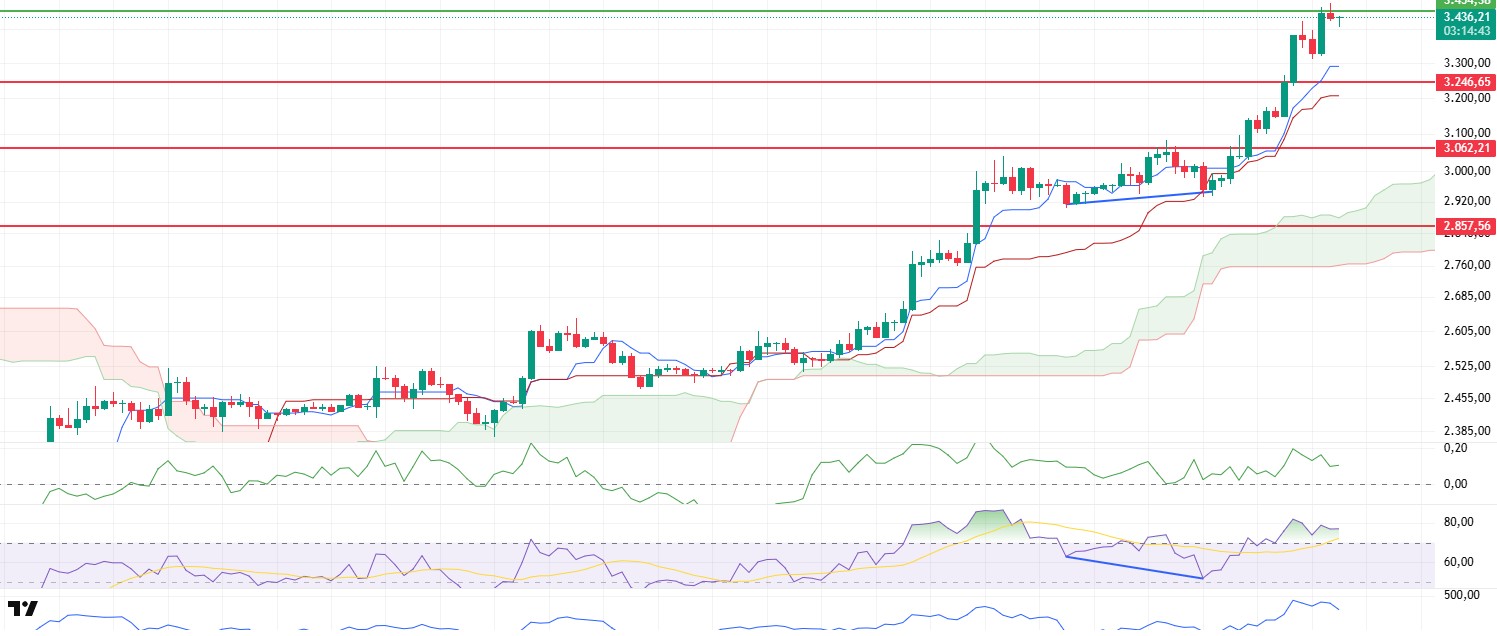
Although the ETH price managed to surpass the critical resistance at $3,454 during the day and rise to the $3,480 band, it retreated with increasing selling pressure in this region and is currently priced at $3,435. This movement shows that the upward demand continues, but the market has not yet achieved a permanent breakout in this region.
When technical indicators and on-chain data are analyzed together, the decline in open interest indicates that there has been a decrease in long positions in futures trading. In line with this picture, the downward trend observed in the Cumulative Volume Delta (CVD) futures indicator also confirms that profit realizations have come to the fore in the market and the buy side has weakened somewhat. On the other hand, the increase in the funding rate is noteworthy. This suggests that long positions are attracting renewed interest in the short term and the market has not completely lost its upside expectations. However, this funding rate increase also reveals that leveraged long positions are gaining weight. Therefore, this fragile structure indicates that if the price approaches resistance levels, it may face selling pressure again.
The RSI indicator continues to move sideways in the overbought zone despite the price rally. While this structure reveals that the indicator has not yet shown any clear weakness despite being in the overbought zone, it should be noted that a prolonged stay in this zone brings the risk of a correction in the short term. On the momentum side, there is a significant easing. This is a technical warning that the price is losing momentum in its upward reactions.
The Chaikin Money Flow (CMF) indicator, which measures liquidity flows, remained in positive territory, while the slope was slightly negative. This outlook suggests that liquidity outflows from the market remain limited and the foundation of the current positive trend has not yet weakened. In particular, this indicator suggests that the current uptrend continues on a healthy footing, but for a new impetus, volume buying needs to be reintroduced.
When the overall picture is evaluated, the profit realization signals in the on-chain data and the loss of momentum in technical indicators suggest that the price may struggle to permanently exceed the $3,454 level. However, the fact that some metrics such as CMF and funding rate still remain positive keeps the possibility of continued upside attacks on the agenda. Therefore, there is a potential for the upward movement to expand, especially if the $3,454 level is tested and broken again in the evening hours. In the opposite scenario, the price is likely to make short-term correction movements due to the weakening in momentum. In this case, the first important support level to be monitored stands out as 3,246 dollars. If it sags below this region, the risk of loss of strength in the uptrend may increase.
Supports 3,246 – 3,062 – 2,857
Resistances 3,455 – 3,739 – 4,084
XRP/USDT
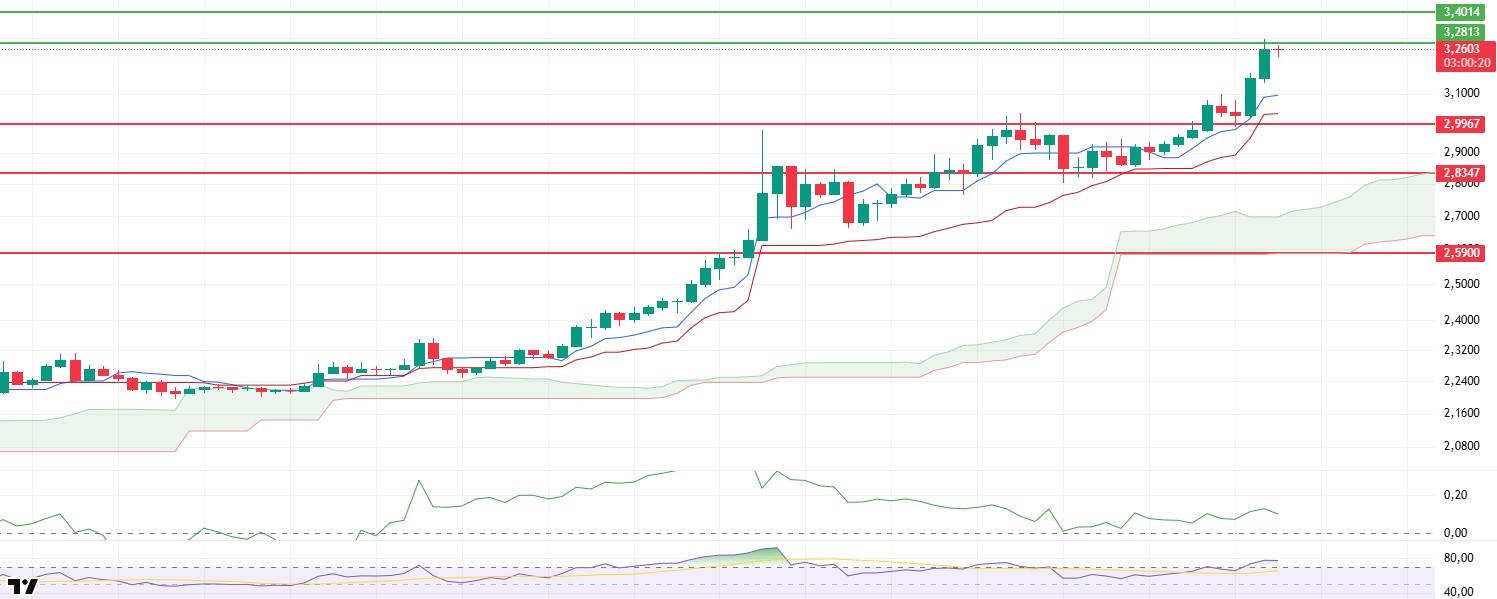
XRP maintained its buying trend during the day and managed to rise to the important resistance zone at the $2.28 level. While this movement indicates that the market’s upward desire continues, technical indicators suggest that caution should be exercised at the levels the price has reached.
First of all, when the Relative Strength Index (RSI) indicator is analyzed, it is seen that it continues to remain in the overbought area, which is considered as an overbought zone, and continues its upward trend in this region. Although this strong stance of the RSI shows that the price is still structurally positive, the fact that it remains in the overbought area increases the risks of a short-term correction. The possibility of volatile movements, especially with sales at such levels, should not be ignored.
The Chaikin Money Flow (CMF) indicator, on the other hand, remains flat in positive territory. This indicates that the liquidity balance in the market is maintained and there is neither aggressive inflows nor significant outflows. This means that market makers are cautious at current levels and the price may stabilize in this region for a while. This behavior of CMF provides a neutral signal in terms of the sustainability of the uptrend, but has the potential to produce clearer signals with the increase in volume in possible breakouts.
Overall, the fact that the price is hovering near the $2.28 resistance and technical indicators continue to support the upside momentum suggests that if this level is breached, the uptrend could expand to $2.40. However, a rejection from the $2.28 level is likely to trigger a new short-term correction, given the RSI’s overbought zone. For this reason, price reactions, especially in the resistance zone, should be closely monitored and careful positioning should be taken against possible scenarios.
Supports 2.9967 – 2.8347 – 2.5900
Resistances 3.2813 – 3.4014 – 3.8615
SOL/USDT
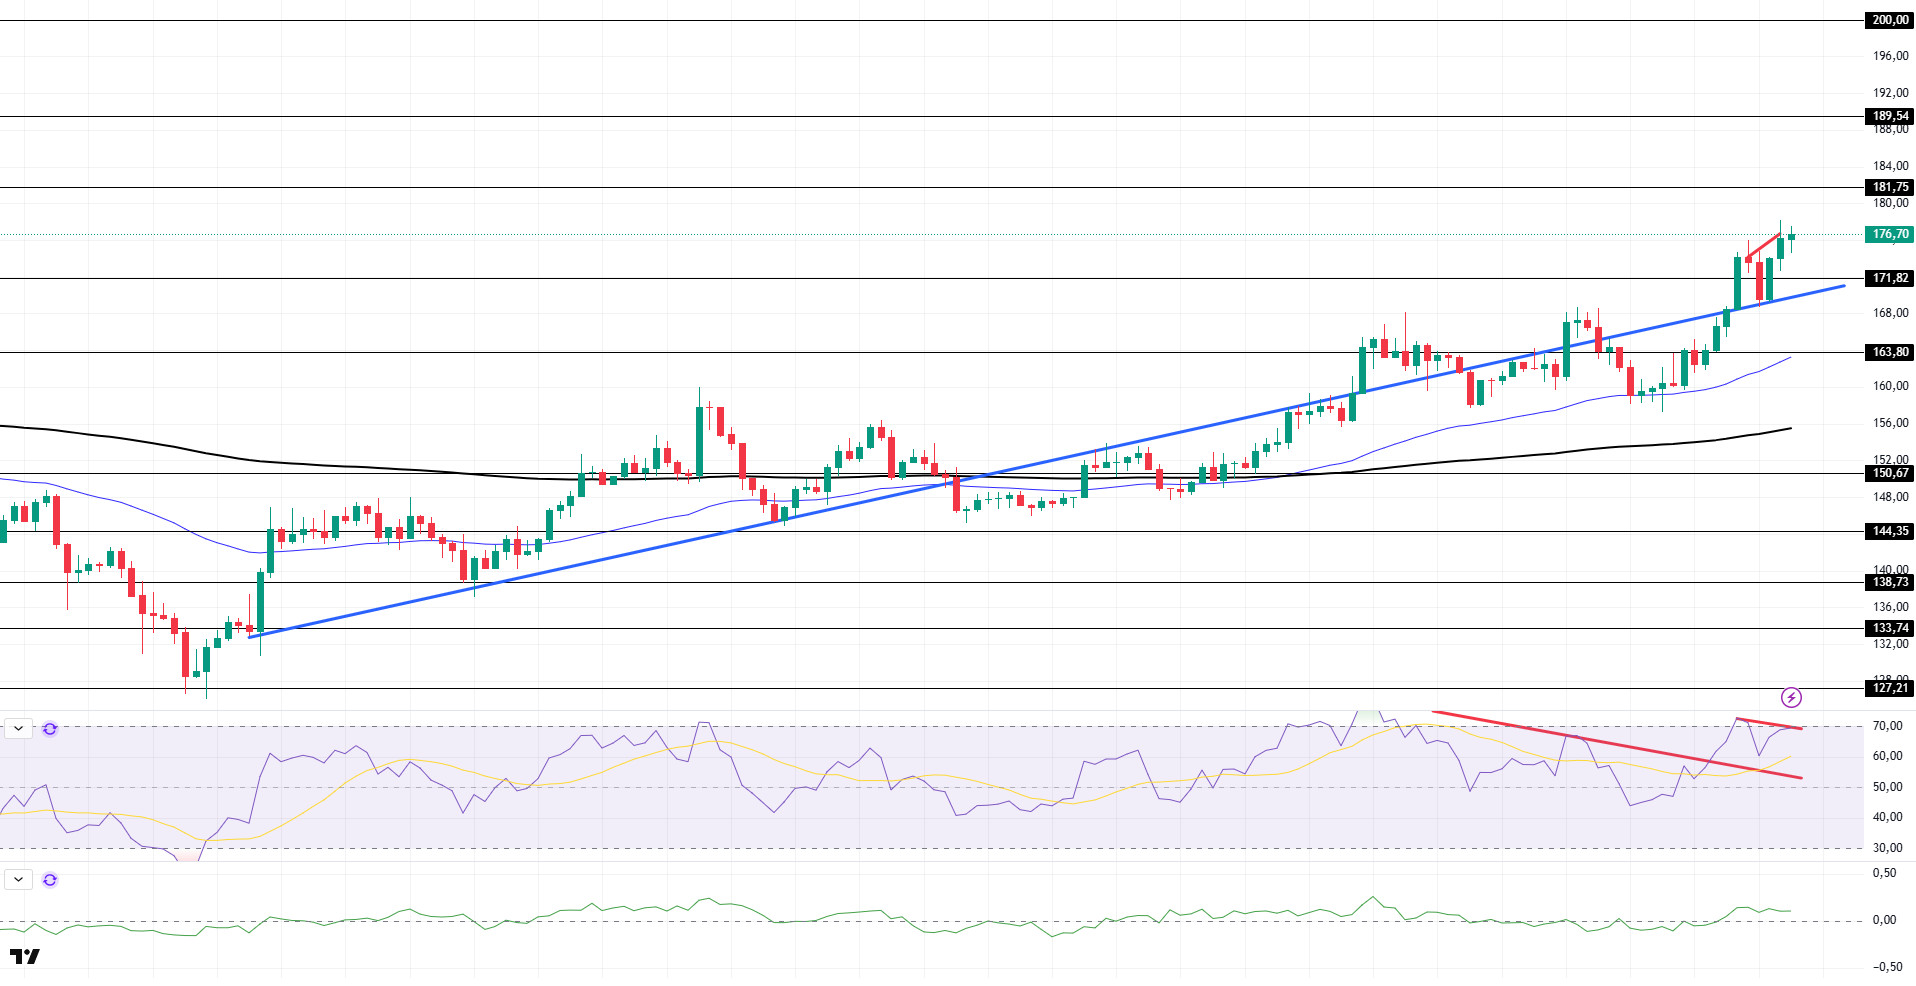
SOL price continued its uptrend during the day. The asset started to be above the uptrend that started on June 23. The price, which broke the upward uptrend that started on June 23, which is a strong resistance place, tested the uptrend as support and gained momentum and started to be above the $171.82 level. If the rises continue, the $181.75 level can be followed. In case of a pullback, if candle closures below the uptrend occur, the 50 EMA (Blue Line) moving average may work with support.
On the 4-hour chart, the 50 EMA (Blue Line) continues to be above the 200 EMA (Black Line). This suggests that the uptrend may continue in the medium term. At the same time, the fact that the price is above both moving averages suggests that the market is currently in a bullish trend in the short term. Chaikin Money Flow (CMF-20) continued to be in positive territory. However, an increase in inflows could push CMF to the upper levels of the positive zone. Relative Strength Index (RSI-14), on the other hand, broke the selling pressure by moving into the positive zone and is at the overbought level. In addition, it continued to hold above the downtrend that started on July 11, but the negative divergence should be monitored. The $181.75 level stands out as a strong resistance point in case of an uptrend on the back of macroeconomic data or positive news on the Solana ecosystem. If this level is broken upwards, the rise can be expected to continue. If there are pullbacks due to contrary developments or profit realizations, the $171.82 level can be tested. In case of a decline to these support levels, the increase in buying momentum may offer a potential bullish opportunity.
Supports 171.82 – 163.80 – 150.67
Resistances 181.75 – 189.54 – 200.00
DOGE/USDT
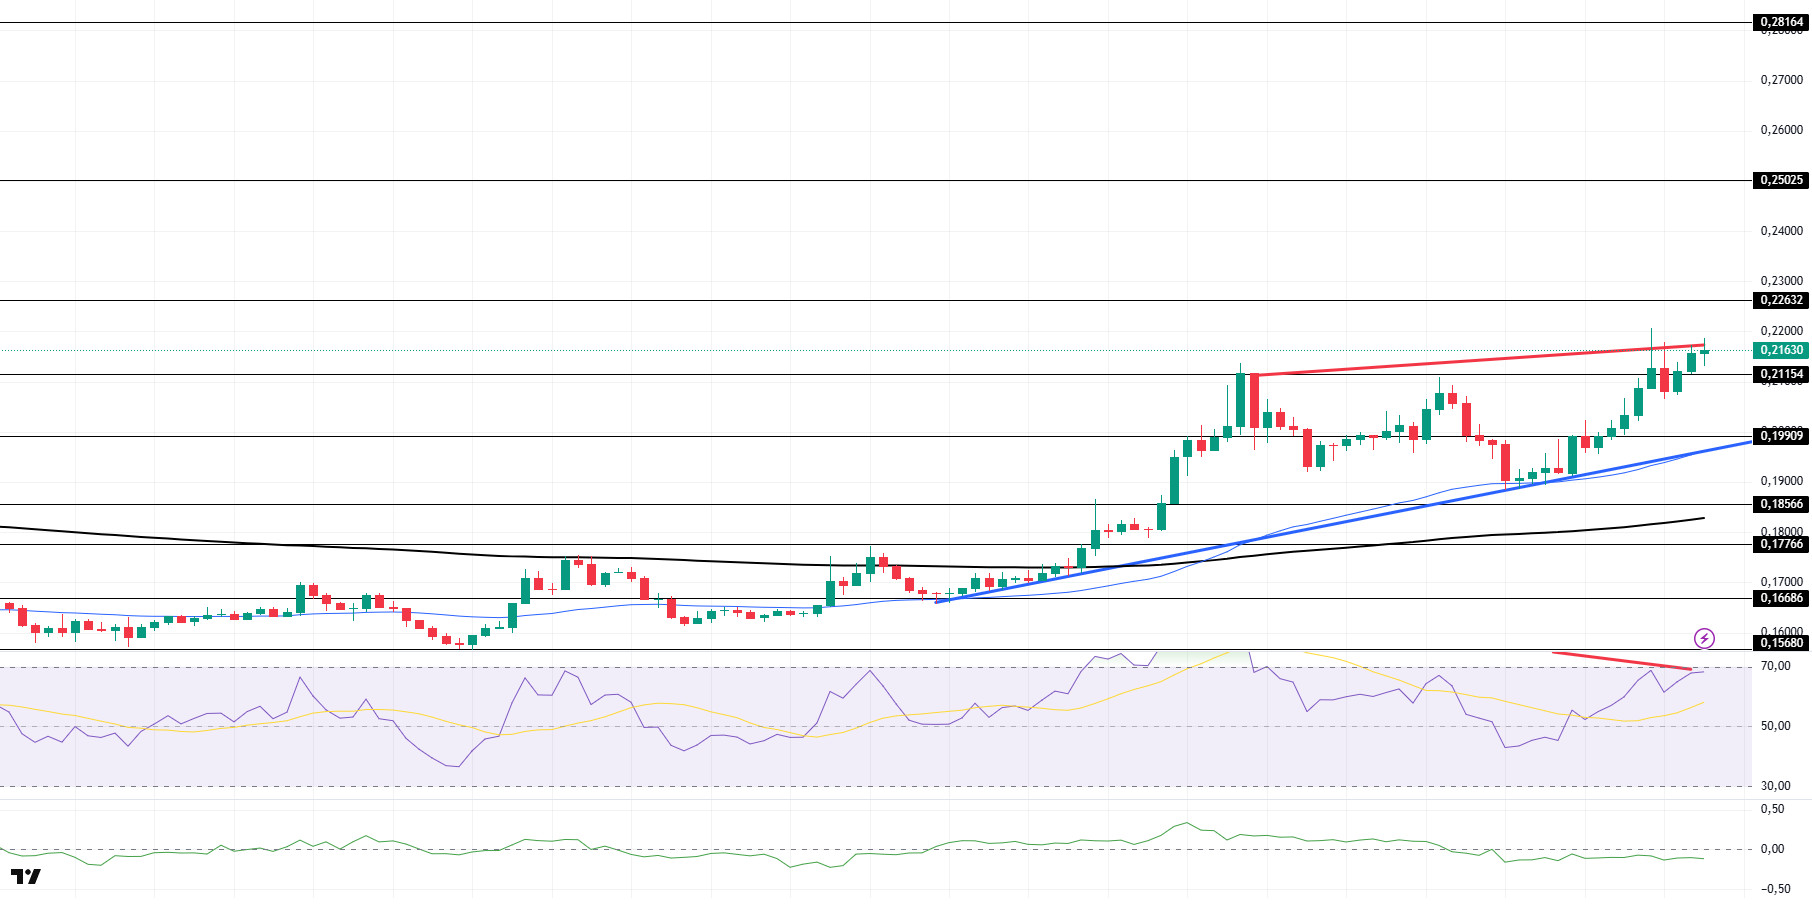
DOGE price continued its uptrend during the day. With the uptrend that started on July 7, it continued to stay above the 200 EMA (Black Line) and 50 EMA moving averages. Breaking the strong resistance level of $0.21154, the asset continued its acceleration. If the upward momentum continues, the $0.22632 level can be followed. In case of a pullback, the $0.19909 level should be followed.
On the 4-hour chart, the 50 EMA (Blue Line) continues to be above the 200 EMA (Black Line). This suggests that the asset is bullish in the medium term. The fact that the price is above both moving averages suggests that the asset is bullish in the short term. Chaikin Money Flow (CMF-20) continues to be in negative territory. In addition, positive inflows may move CMF into positive territory. Relative Strength Index (RSI-14), on the other hand, remained in positive territory and rose to the overbought level. Additionally, there is a regular divergence pattern. This may push the price lower. The $0.22632 level stands out as a strong resistance zone in case of a rally in line with political developments, macroeconomic data or positive news flow in the DOGE ecosystem. In the opposite case or possible negative news flow, the $0.19909 level may be triggered. In case of a decline to these levels, the momentum may increase and a new bullish wave may start.
Supports 0.21154 – 0.19909 – 0.18566
Resistances 0.22632 – 0.25025 – 0.28164
Legal Notice
The investment information, comments and recommendations contained herein do not constitute investment advice. Investment advisory services are provided individually by authorized institutions taking into account the risk and return preferences of individuals. The comments and recommendations contained herein are of a general nature. These recommendations may not be suitable for your financial situation and risk and return preferences. Therefore, making an investment decision based solely on the information contained herein may not produce results in line with your expectations.

