
BTC/USDT
In terms of fundamentals, digital asset investment products saw a record inflow of $4.39 billion, with Bitcoin and Ethereum accounting for the bulk of these inflows. Another development of the day came from Strategy, which buys Bitcoin every Monday. It made a giant Bitcoin purchase of $740 million at a total cost of 118,940. Swedish H100 Group’s plan to raise funds for BTC investments attracted attention. On the other hand, US Treasury Secretary Benson’s statements about the need for interest rate cuts in a low inflation environment pointed to expansionary policies in the markets.
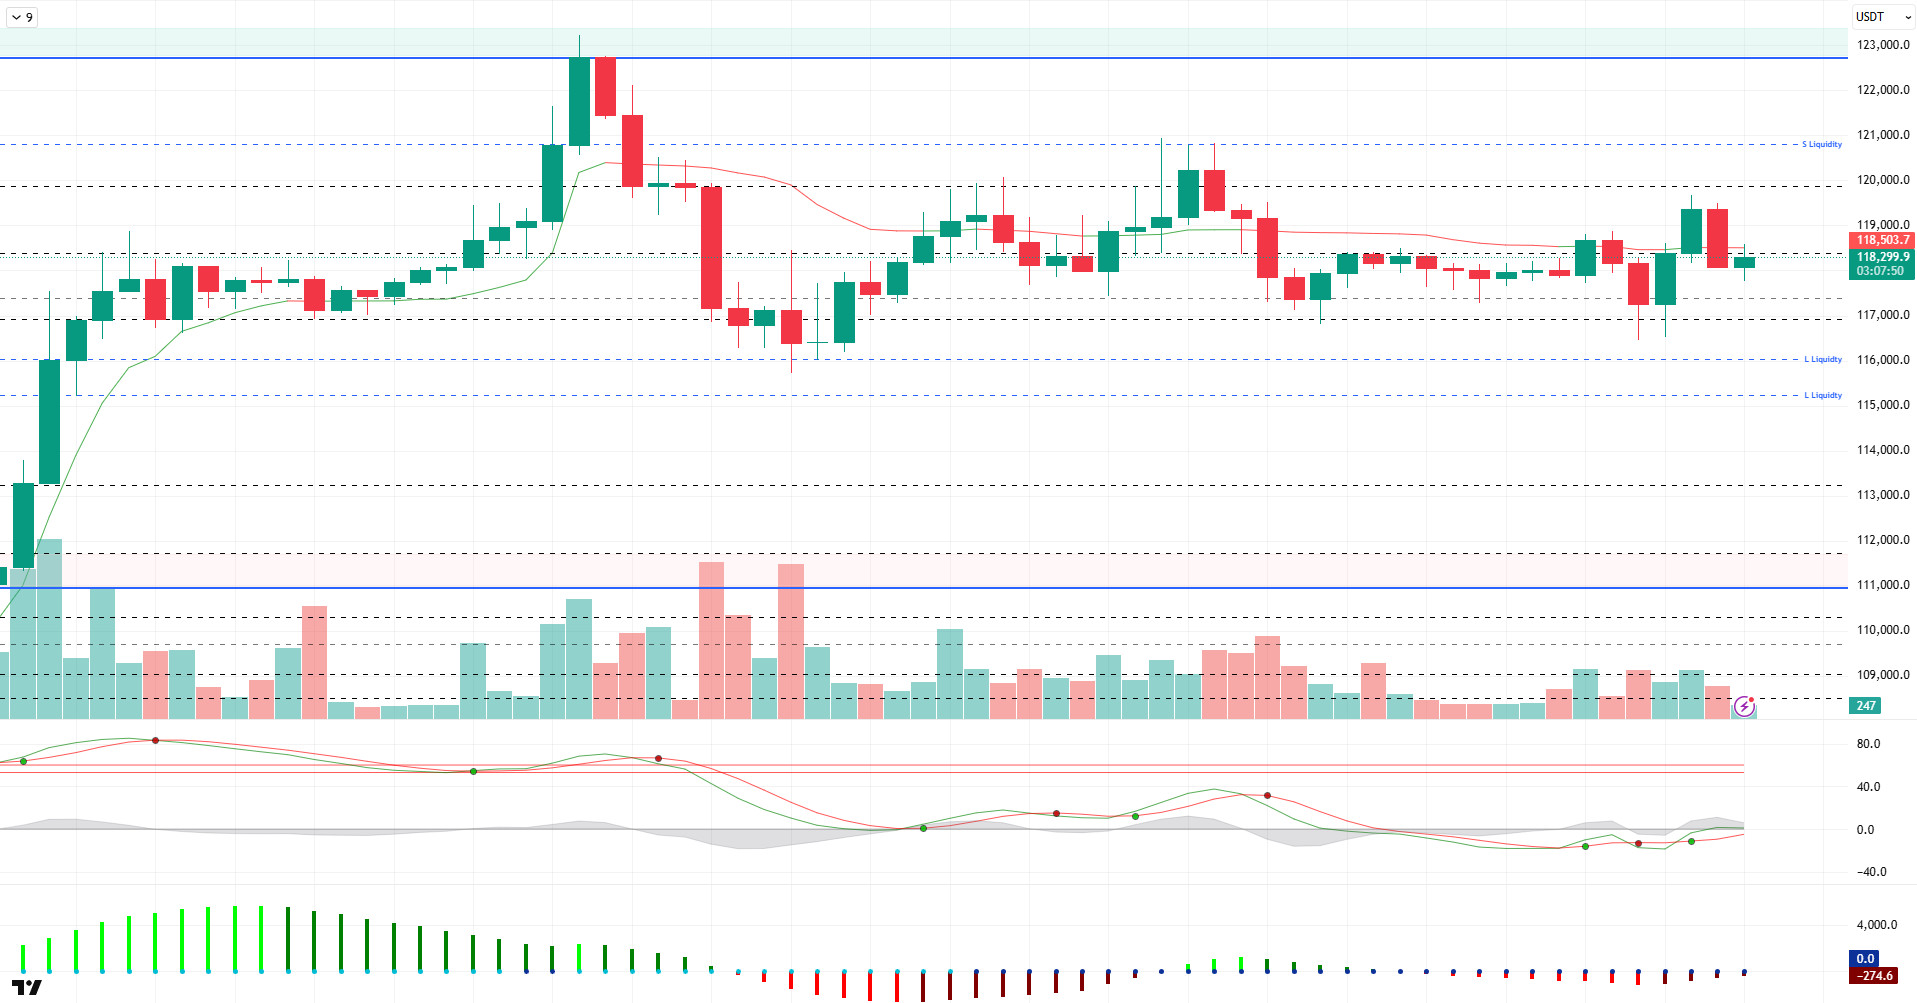
Looking at the technical outlook, BTC price continues to consolidate horizontally near the ATH level. BTC, which has been moving in the 116,000 – 119,000 band for a while, is rebalancing within this range, although it occasionally sags outside these levels. BTC, which has retreated slightly compared to the previous analysis, is trading at 118,300 at the time of writing.
Looking at the technical indicators, the Wave Trend (WT) oscillator continues to display an indecisive picture in the mid-channel band with the recent decline. The histogram on the Squeeze momentum (SM) indicator regained momentum but is still in negative territory. The Kaufman moving average crossed above the price at 118,500.
Liquidity data reveals that the recent decline led to the liquidation of heavy buying positions at 117,000, while another buying tier continues to accumulate at 115,000. The selling tier was liquidated at 119,000. While the sparsity of short-term trades is noteworthy, it is noteworthy that long-term trades are maintained around 121,000 on the sell side.
In summary, the price continues to consolidate near the ATH level as fundamental developments continue to contribute positively to pricing. While the technical outlook exhibits an indecisive structure in the short term, liquidity data continues to keep price movements sideways. While the closures above the 120,000 minor resistance point will be followed in the continuation of the rise, we will follow the 117,500 support level in a possible selling pressure.
Supports 117,500 – 116,800 – 115,300
Resistances 118,600 – 120,000 – 121,000
ETH/USDT
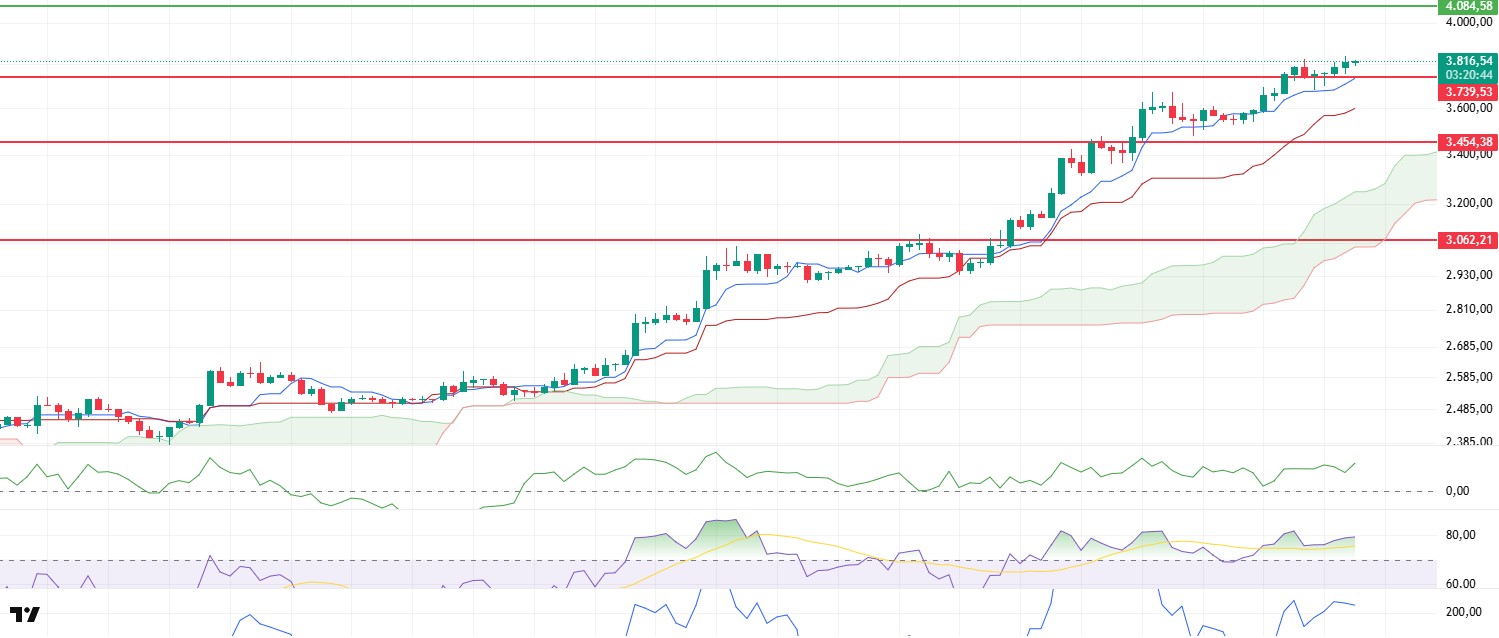
Despite testing the support zone at $3,739 during the day, ETH managed to hold this level and continues to hold above $3,800. The stabilization of the price in this area suggests that buyers are still strong and the market has the ground to support an upside move. Technical indicators remain generally positive, but weaknesses in some metrics suggest caution in short-term moves.
The Chaikin Money Flow (CMF) indicator remains in positive territory, maintaining its bullish momentum. This indicates that liquidity inflows to the market continue and investor interest is still at high levels. This positive structure in CMF stands out as one of the strongest signals supporting the upside potential of the price. However, there is a different picture on the RSI. Although the indicator is still in overbought territory, there is a significant weakening in momentum as the speed of reaction to recent price movements has decreased. This stagnation in the RSI suggests that the market is getting tired and a possible short-term correction may be on the agenda.
When the Ichimoku cloud is analyzed, it is seen that the overall structure is still positive. The fact that the price continues to stay above the cloud confirms that the trend is upward in the medium term. The fact that the Tenkan-sen and Kijun-sen lines move in parallel without moving away from each other reveals that this trend has a healthy and sustainable structure.
Although the overall outlook is positive, the slowdown in some momentum indicators makes it necessary for investors to act cautiously. Closures above the $3,800 level in the evening hours are critical for the continuation of the rise. However, the risk of retesting the support of $3,739, especially in the retreats that may be experienced below this level, should not be ignored. If this region is broken, the possibility of the price entering a short-term correction movement increases. In this context, in order to maintain the uptrend, it is of great importance that both technical structures remain supportive and the price holds above certain support levels.
Supports 3,739 – 3,455 – 3,062
Resistances 4,084 – 4,381 – 4,857
XRP/USDT
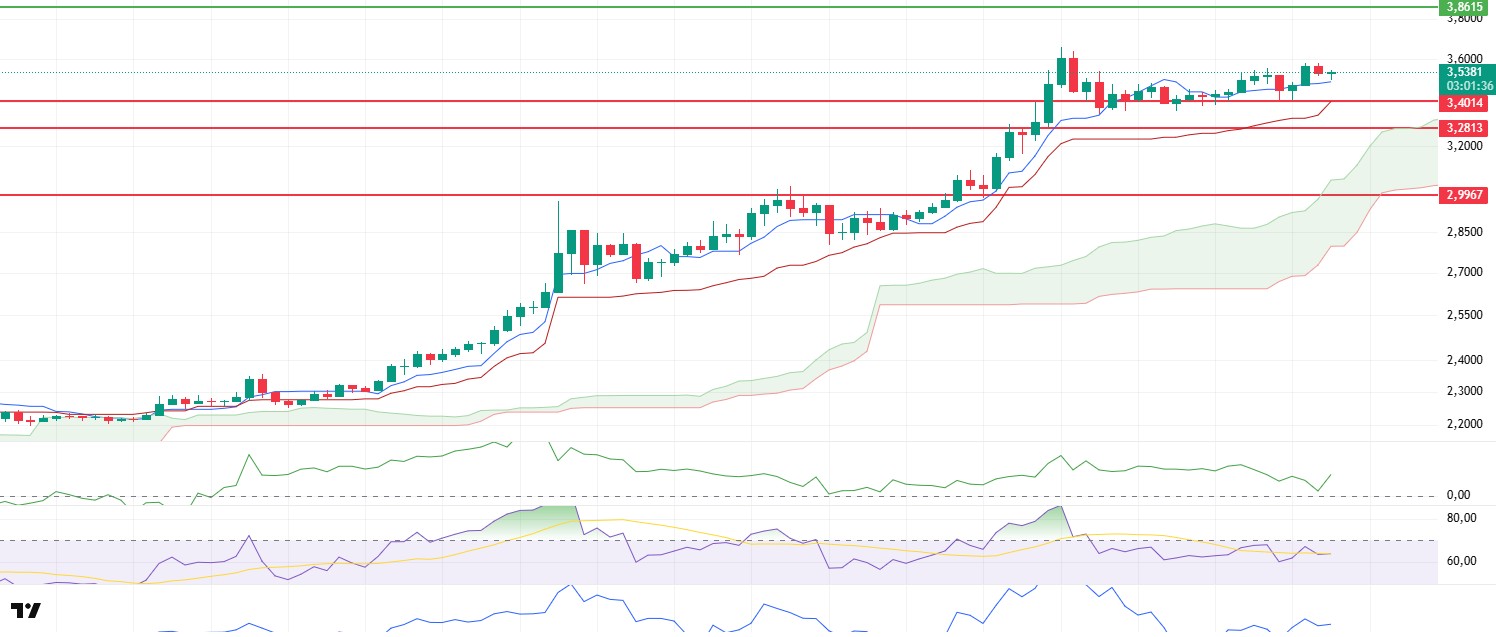
XRP managed to stay above the $3.50 level, exhibiting a generally horizontal price movement during the day. This level is an important support for the short-term price structure. Although volatility remained limited throughout the day, there were noticeable changes in technical indicators, signaling some directional changes in the current outlook.
The most notable development was the sharp rise in the Chaikin Money Flow (CMF) indicator. The indicator quickly moved away from neutral levels and made a strong bounce into positive territory. While this rise reveals that there are meaningful liquidity inflows to the market again, it stands out as an important structural change that could support the upward movement of the price. CMF’s behavior is a strong sign that an upward momentum in short-term price movements may occur.
On the momentum side, a more balanced structure stands out. Relative Strength Index (RSI) and other momentum indicators are generally flat. This horizontal pattern indicates that buying and selling pressures are in balance and the market is going through an indecisive process. However, the RSI is far from the overbought zone, indicating that there is still room for upside movement. This suggests that the technical ground is ready for the uptrend to continue in the short term.
When the Ichimoku cloud is analyzed, it is seen that the price received support from the Tenkan-sen line during the day. This can be considered as a positive signal for the price to continue its upward trend in the short term. The fact that the price continues to stay above the cloud and this interaction with the Tenkan line is another technical element that supports that the current trend is strong.
In summary, XRP’s stay above the $3.50 level, when evaluated together with technical indicators, suggests that the upward movement may continue. While the closures above this level reveal that buyers are still strong, the support of $3.40 stands out as a critical threshold in a possible pullback. Pricing that may occur below this level may bring a correction movement that may last up to the 3.28 dollar band.
Supports 3.4014 – 3.2813 – 2.9967
Resistances 3.8615 – 4.000 – 4.4000
SOL/USDT
DeFi Development bought 141,383 SOLs between July 14 and July 20 at an average purchase price of $133.53, representing approximately $19 million.
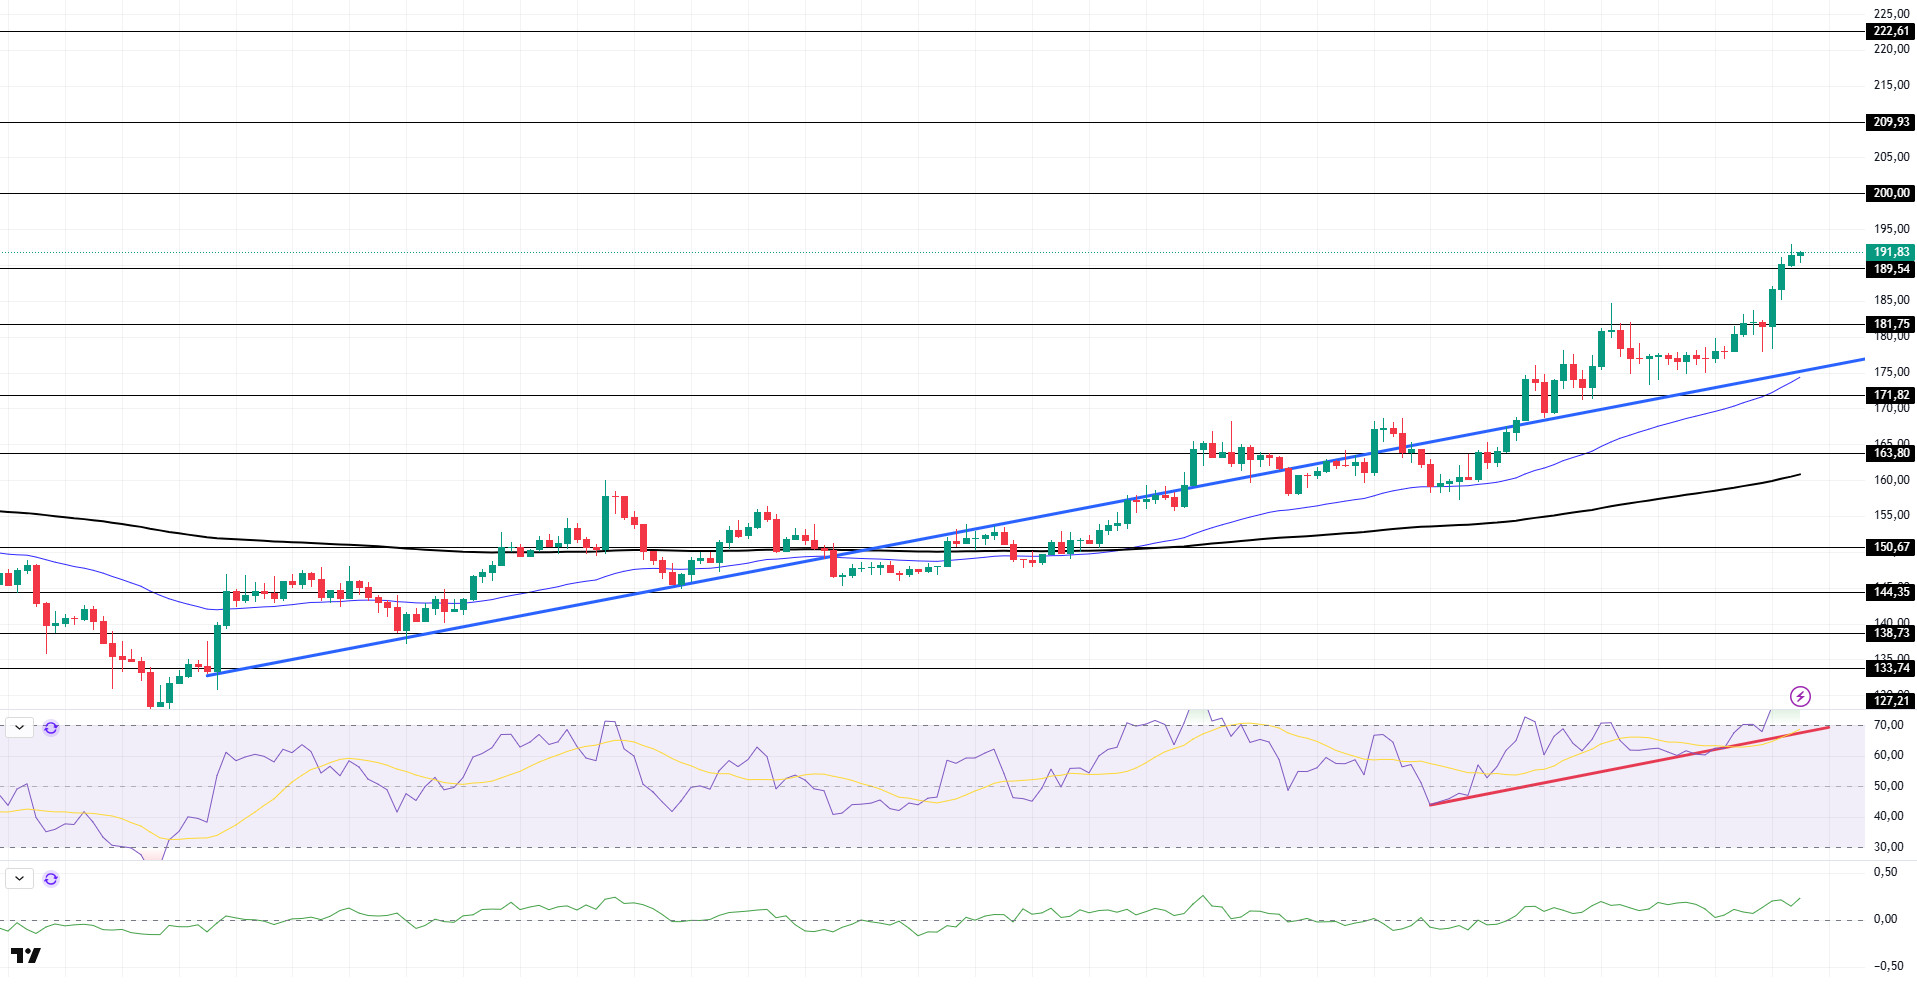
SOL price continued its uptrend during the day. The asset continues to remain above the uptrend that started on June 23. The price accelerated upwards from the uptrend and broke the $189.54 level with support from the $171.82 level. If the rise continues, the $ 200.00 level can be followed. In case of a pullback, the rising trend may work as support.
On the 4-hour chart, the 50 EMA (Blue Line) continues to be above the 200 EMA (Black Line). This suggests that the uptrend may continue in the medium term. At the same time, the fact that the price is above both moving averages suggests that the market is currently in a bullish trend in the short term. Chaikin Money Flow (CMF-20) continued to be in positive territory. However, a decline in inflows could move CMF into negative territory. Relative Strength Index (RSI-14) continues to be in positive territory and is in overbought territory. However, selling pressure has emerged. In addition, it remained above the uptrend that started on July 15. The $200.00 level stands out as a strong resistance point in case of an uptrend on the back of macroeconomic data or positive news on the Solana ecosystem. If this level is broken upwards, the rise can be expected to continue. If there are pullbacks due to contrary developments or profit realizations, the $ 181.75 level can be tested. In case of a decline to these support levels, the increase in buying momentum may offer a potential bullish opportunity.
Supports 189.54 – 181.75 – 171.82
Resistances 200.00 – 209.93 – 222.61
DOGE/USDT
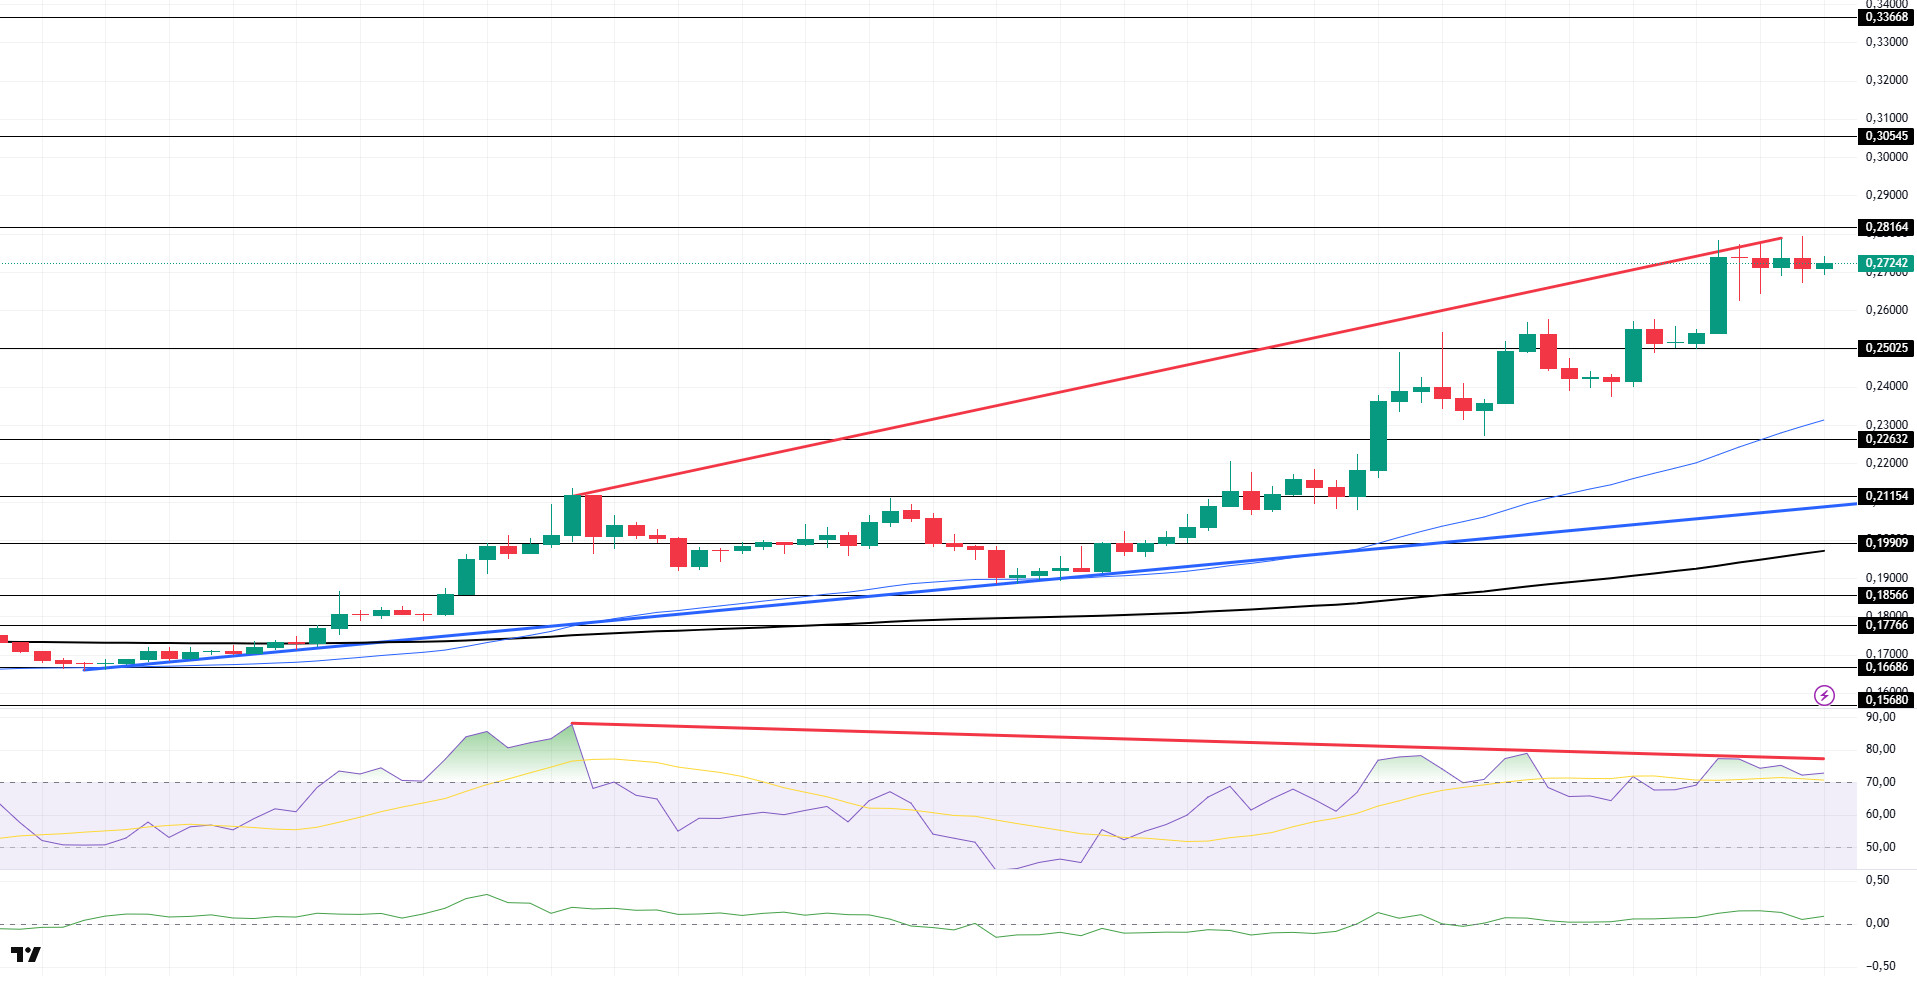
DOGE price continued its uptrend. The asset continued to stay above its 200 EMA (Black Line) and 50 EMA (Blue Line) moving averages in an uptrend that started on July 7. Breaking the strong resistance at $0.25025, the asset is preparing to test the $0.28164 level by maintaining its momentum. If the upward momentum continues, it may retest the $0.30545 level. In case of a retracement, the $ 0.25025 level should be followed.
On the 4-hour chart, the 50 EMA (Blue Line) continues to be above the 200 EMA (Black Line). This suggests that the asset is bullish in the medium term. The fact that the price is above both moving averages suggests that the asset is bullish in the short term. Chaikin Money Flow (CMF-20) continued to be in positive territory. In addition, positive inflows may push CMF to the upper levels of the positive zone. Relative Strength Index (RSI-14) remained in positive territory and rose to the overbought level. However, it remained below the downtrend that started on July 11. In addition, there is a regular divergence pattern. This may cause the price to fall. The $0.30545 level stands out as a strong resistance zone in case of a rally in line with political developments, macroeconomic data or positive news flow in the DOGE ecosystem. In the opposite case or possible negative news flow, the $0.25025 level may be triggered. In case of a decline to these levels, the momentum may increase and a new bullish wave may start.
Supports 0.25025 – 0.22632 – 0.21154
Resistances 0.28164 – 0.30545 – 0.33668
Legal Notice
The investment information, comments and recommendations contained herein do not constitute investment advice. Investment advisory services are provided individually by authorized institutions taking into account the risk and return preferences of individuals. The comments and recommendations contained herein are of a general nature. These recommendations may not be suitable for your financial situation and risk and return preferences. Therefore, making an investment decision based solely on the information contained herein may not produce results in line with your expectations.

