BTC/USDT
Entering the last day of the crypto week, the US House of Representatives approved three critical bills prepared for digital assets. The first two of the CLARITY, GENIUS and Anti-CBDC bills have been sent to the Senate, while the GENIUS Act is expected to be signed into law by Trump. The SEC also announced that it is working on new regulatory exemptions to support tokenization. On the other hand, Trump is preparing a presidential decree that will pave the way for pension funds to invest in crypto assets. On the institutional investment side, Semler Scientific increased its BTC reserve, while spot Bitcoin ETFs saw net inflows for the 11th consecutive day.
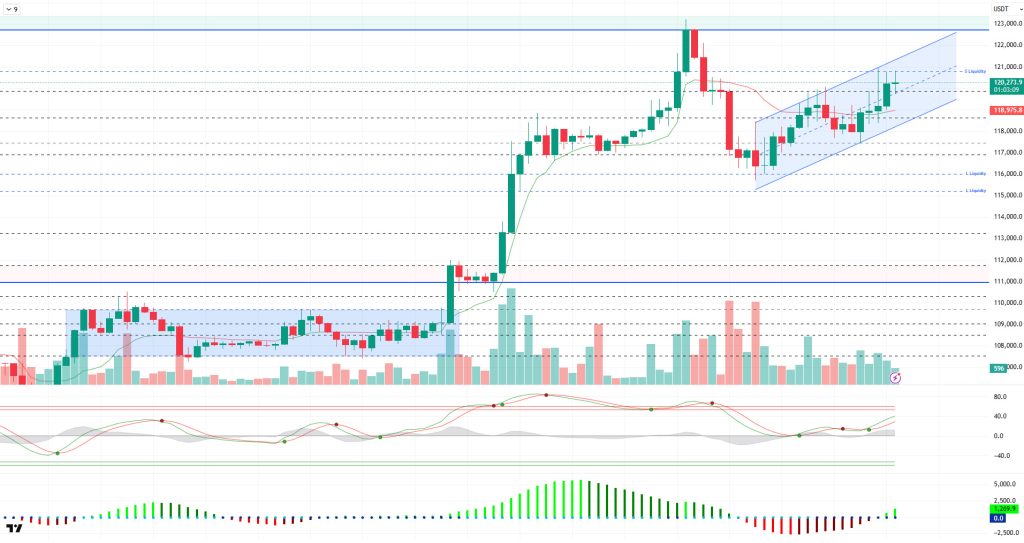
Looking at the technical outlook, BTC price tested the ATH level and then corrected towards the 115,000 level and then caught an uptrend again. BTC, which was trading at 120,000 at the time of writing the analysis, will follow a double top at the ATH level in the continuation of the rise.
Looking at the technical indicators, the Wave Trend (WT) oscillator turned upwards and headed towards the overbought zone after an indecisive appearance in the channel mid-band with the recent decline. The histogram on the Squeeze momentum (SM) indicator regained momentum in positive territory. The Kaufman moving average crossed below the price at 118.995, supporting the upside.
When the liquidity data is analyzed, it is seen that while liquidating the sell trades at the 120,000 level with the recent rise, another selling level was accumulated at 121,500. Buy trades continue to accumulate at the 115,000 level in the wider timeframe.
In summary, the price is once again heading towards the ATH level as fundamental developments continue to contribute positively to pricing. While the technical outlook supports this outlook in the short term, liquidity data reflects that buying positions are dominant. Closures above the 120,000 minor resistance point will be followed in the continuation of the rise, while we will follow the 118,600 support level in a possible selling pressure.
Supports 118,600 – 117,500 – 116,800
Resistances 120,000 – 121,000 – 123,000
ETH/USDT
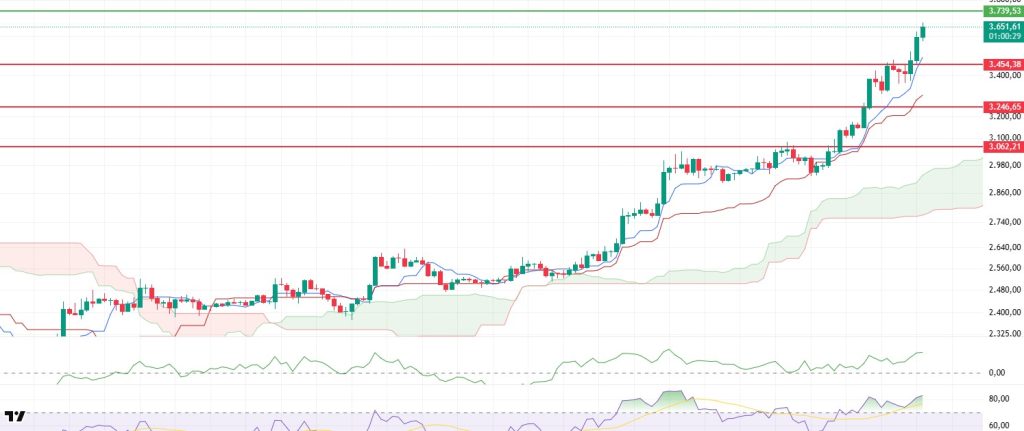
Yesterday, a strong capital inflow of $602 million into spot Ethereum ETFs in the US strengthened the basis for the upward movement in the ETH price. While this inflow was interpreted as a concrete reflection of the interest of institutional investors in ETH, other news flows on the same day also increased the positive pressure on the market. NASDAQ’s application to allow staking transactions under the iShares Ethereum Trust indicates that Ethereum may expand its functional area within investment products. At the same time, the news that US President Donald Trump is working on a regulation that will pave the way for pension funds to invest in crypto assets could be an important milestone in terms of resolving regulatory uncertainty and growing the capital base. The impact of these developments on the price was felt quite clearly. ETH broke through the critical resistance at $3,454, first turning this area into support, and then continued its upward momentum and climbed above $3,650.
Technically, the Cumulative Volume Delta (CVD) indicator reveals that both spot and futures markets have seen steady buying activity and the uptrend is taking place against a backdrop of strong liquidity. The increase in volume, especially on the spot side, indicates that the price is supported by real demand, not just leveraged trades. Another important indicator of the sustainability of the uptrend is the funding rate, which is still hovering at reasonable levels. This suggests that the market has not overheated yet and therefore the upward movement has the potential to continue in technical terms.
The Chaikin Money Flow (CMF) indicator, on the other hand, has risen sharply in the positive territory, supporting the continued high liquidity inflows into ETH and strong investor confidence. This data also gives an important signal that the positive pricing in the market may continue in the short term.
Relative Strength Index (RSI) continues to remain in the overbought zone. Despite this, the lack of momentum loss shows that the buying appetite is strong. However, it should be kept in mind that there may be an increase in volatility at such levels and short-term corrections should be expected. Although the persistence of the RSI in the current region supports the strength of the trend, careful risk management may be essential.
Considering all these technical and on-chain indicators, both macro news flow and market dynamics continue to shape in favor of Ethereum. In the current outlook, it is possible to test the $ 3,739 level during the day. However, it is critical to maintain the $3,454 level in terms of the continuation of the upward movement. A break below this level could disrupt the current positive structure and pave the way for the start of a short-term correction. Overall, both the technical and fundamental outlook on Ethereum remain strong.
Top of Form
Below the Form
Supports 3,455 – 3,246 – 3,062
Resistances 3,739 – 4,084 – 4,365
XRP/USDT
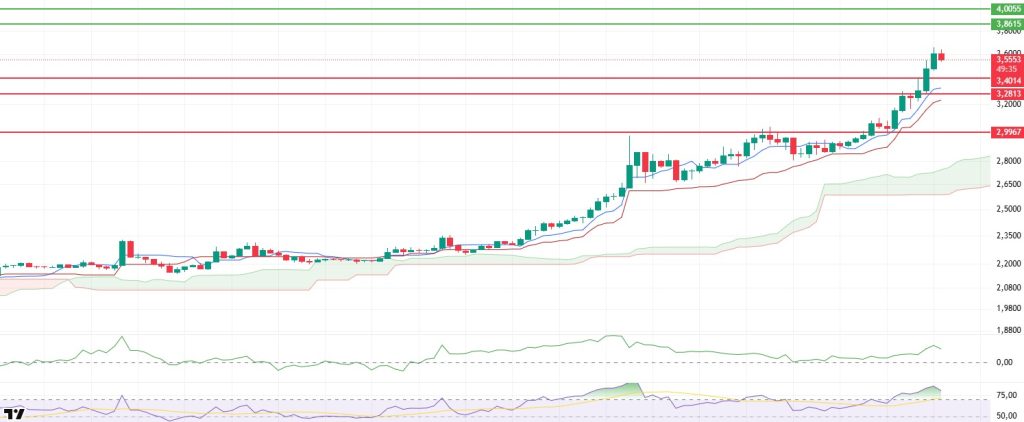
XRP displayed a remarkable performance yesterday with the impact of positive news flow in the cryptocurrency markets, breaking the important resistance zone at the $3.40 level with a strong and voluminous breakout. After this technical breakout, the price accelerated its ascent, climbing as high as $3.66 and recording an all-time high (ATH). The rise in question indicates not only short-term buying interest, but also an increase in the confidence of market participants in a structural sense. Especially the positive developments in the crypto ecosystem and the increase in the general market risk appetite were among the main factors supporting this movement in XRP.
In the evaluation of technical indicators after this sharp rise, it is noteworthy that the Chaikin Money Flow (CMF) indicator retreated slightly from the positive zone. This reflects the impact of profit selling from high levels and indicates that short-term pressures on the price may occur. However, as long as this pullback remains limited, this movement can be considered as part of a healthy uptrend.
Although the Relative Strength Index (RSI) is in the overbought zone, it shows that the upward momentum has weakened and a slight correction trend has begun. While this trend in RSI indicates that a classic technical respite and consolidation process has entered, it also supports the possibility of a horizontal outlook in short-term price movements. At this point, volatility decline and narrow trading ranges can be observed.
The Ichimoku indicator shows that the overall trend remains strong and positive. The fact that the price hovers above both Tenkan and Kijun levels and that these two levels accompany the rise reveals that the short-term structure is moving forward with momentum. The upward expansion of the Kumo cloud indicates that the medium-term trend remains strong and buying pressure continues. This suggests that possible pullbacks may remain limited and the overall direction remains up.
When evaluated in the light of all these data, a horizontal and stabilizing course can be observed in the XRP price in the short term. However, exceeding the $3.86 level in volume could spark the next strong bullish wave and take the price to new highs. On the other hand, the $3.40 level should be followed as an important support. While maintaining this level is critical for the current structure to continue undisturbed, if it falls below this level, the possibility of a short-term correction may increase. In general, the market structure indicates that the positive trend continues and possible pullbacks can be considered as buying opportunities.
Supports 3.4014 – 3.2813 – 2.9967
Resistances 3.8615 – 4.000 – 4.4000
SOL/USDT
DeFi Dev Corp. unveiled the DFDV Treasury Accelerator, which will transform Solana’s decentralized finance ecosystem.
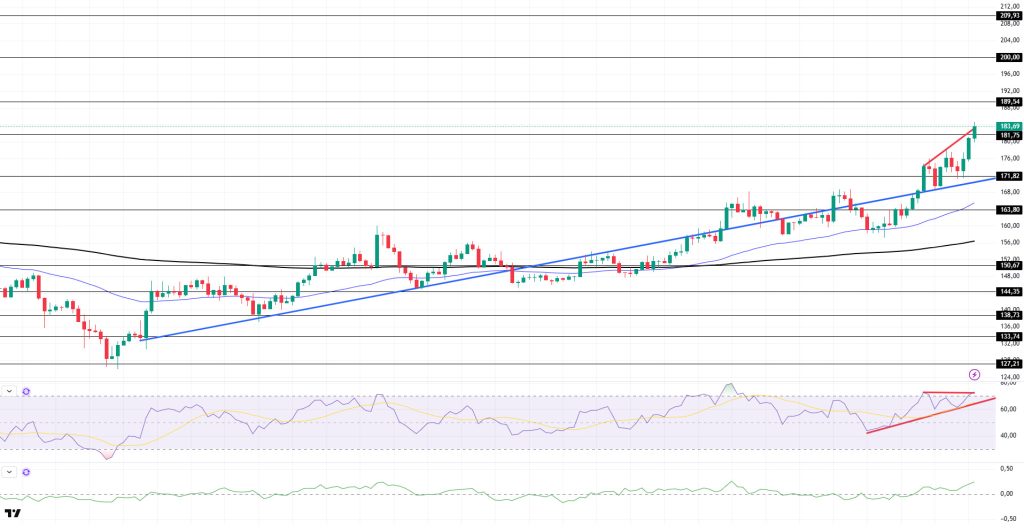
SOL price continued its uptrend. The asset continued to remain above the uptrend that started on June 23rd. The price accelerated upwards from the uptrend that started on June 23rd and started to be above the $171.82 level. The asset, which is currently testing the $ 181.75 level as resistance, can be followed by the $ 189.54 level if it breaks here. In case of a pullback, the rising trend may work with support.
On the 4-hour chart, the 50 EMA (Blue Line) continues to be above the 200 EMA (Black Line). This suggests that the uptrend may continue in the medium term. At the same time, the fact that the price is above both moving averages suggests that the market is currently in a bullish trend in the short term. Chaikin Money Flow (CMF-20) continued to be in positive territory. However, a decline in inflows could move CMF into negative territory. Relative Strength Index (RSI-14) remained in positive territory. In addition, it remained above the uptrend that started on July 15, but the negative divergence should be monitored. The $181.75 level stands out as a strong resistance point in case of an uptrend on the back of macroeconomic data or positive news on the Solana ecosystem. If this level is broken upwards, the rise can be expected to continue. If there are pullbacks due to contrary developments or profit realizations, the $ 171.82 level can be tested. In case of a decline to these support levels, the increase in buying momentum may offer a potential bullish opportunity.
Supports 171.82 – 163.80 – 150.67
Resistances 181.75 – 189.54 – 200.00
DOGE/USDT
Bit Origin announces $500 million Dogecoin treasury venture.
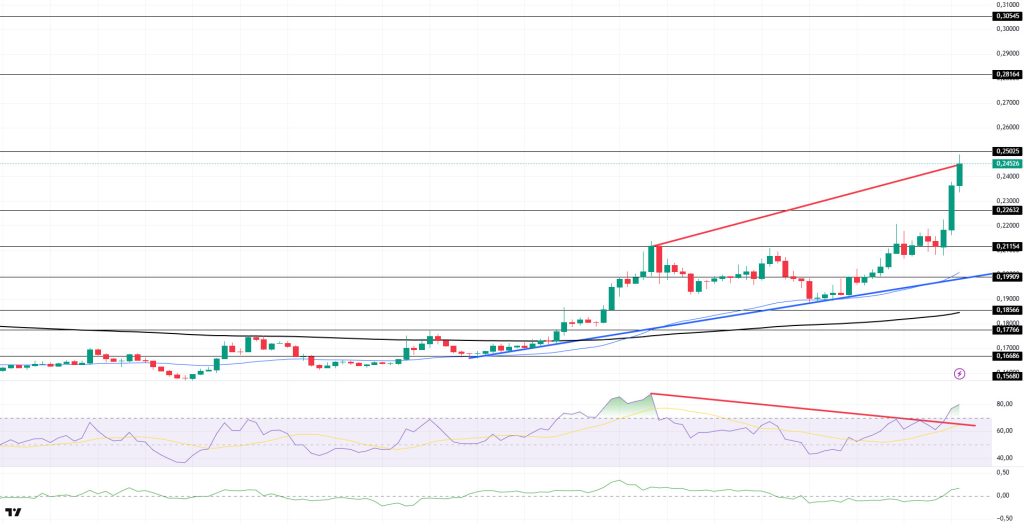
DOGE price continued its uptrend. With the uptrend that started on July 7, it continued to stay above the 200 EMA (Black Line) and 50 EMA (Blue Line) moving averages. The asset, which also broke the strong resistance level of $ 0.21154, tested this level as support and experienced acceleration and continued its momentum by breaking the strong resistance level of $ 0.22632. If the upward acceleration continues, the level of 0.25025 dollars can be followed. In case of a pullback, the $0.22632 level should be followed.
On the 4-hour chart, the 50 EMA (Blue Line) continues to be above the 200 EMA (Black Line). This shows us that the asset has an upward trend in the medium term. The fact that the price is above both moving averages suggests that the asset is bullish in the short term. Chaikin Money Flow (CMF-20) crossed into positive territory. In addition, positive inflows may push CMF to the upper levels of the positive zone. Relative Strength Index (RSI-14), on the other hand, remained in positive territory, breaking the downtrend that started on July 11 and rising to the overbought level. In addition, there is a regular divergence pattern. This may push the price lower. The $0.25025 level stands out as a strong resistance zone in case of a possible rise in line with political developments, macroeconomic data or positive news flow in the DOGE ecosystem. In the opposite case or possible negative news flow, the $0.21154 level may be triggered. In case of a decline to these levels, the momentum may increase and a new bullish wave may start.
Supports 0.22632 – 0.21154 – 0.19909
Resistances 0.25025 – 0.28164 – 0.30545
Legal Notice
The investment information, comments and recommendations contained herein do not constitute investment advice. Investment advisory services are provided individually by authorized institutions taking into account the risk and return preferences of individuals. The comments and recommendations contained herein are of a general nature. These recommendations may not be suitable for your financial situation and risk and return preferences. Therefore, making an investment decision based solely on the information contained herein may not produce results in line with your expectations.

