
BTC/USDT
US President Donald Trump strengthened economic ties in Asia by signing trade agreements with Japan and the Philippines. Japan has committed to imposing a 15% tariff on US imports and making a $550 billion investment, while the Philippines has pledged to eliminate tariffs on US goods. Talks with China are scheduled to take place in Stockholm on July 29. Trump stated that interest rates should be lowered by 3 points or more to reach 1%. Fed Chairman Powell made no comments on monetary policy in his latest speech. Treasury Secretary Bessant stated that there was no situation requiring Powell’s resignation. Expectations that Japanese Prime Minister Shigeru Ishiba will resign by the end of August have stirred the stock markets.
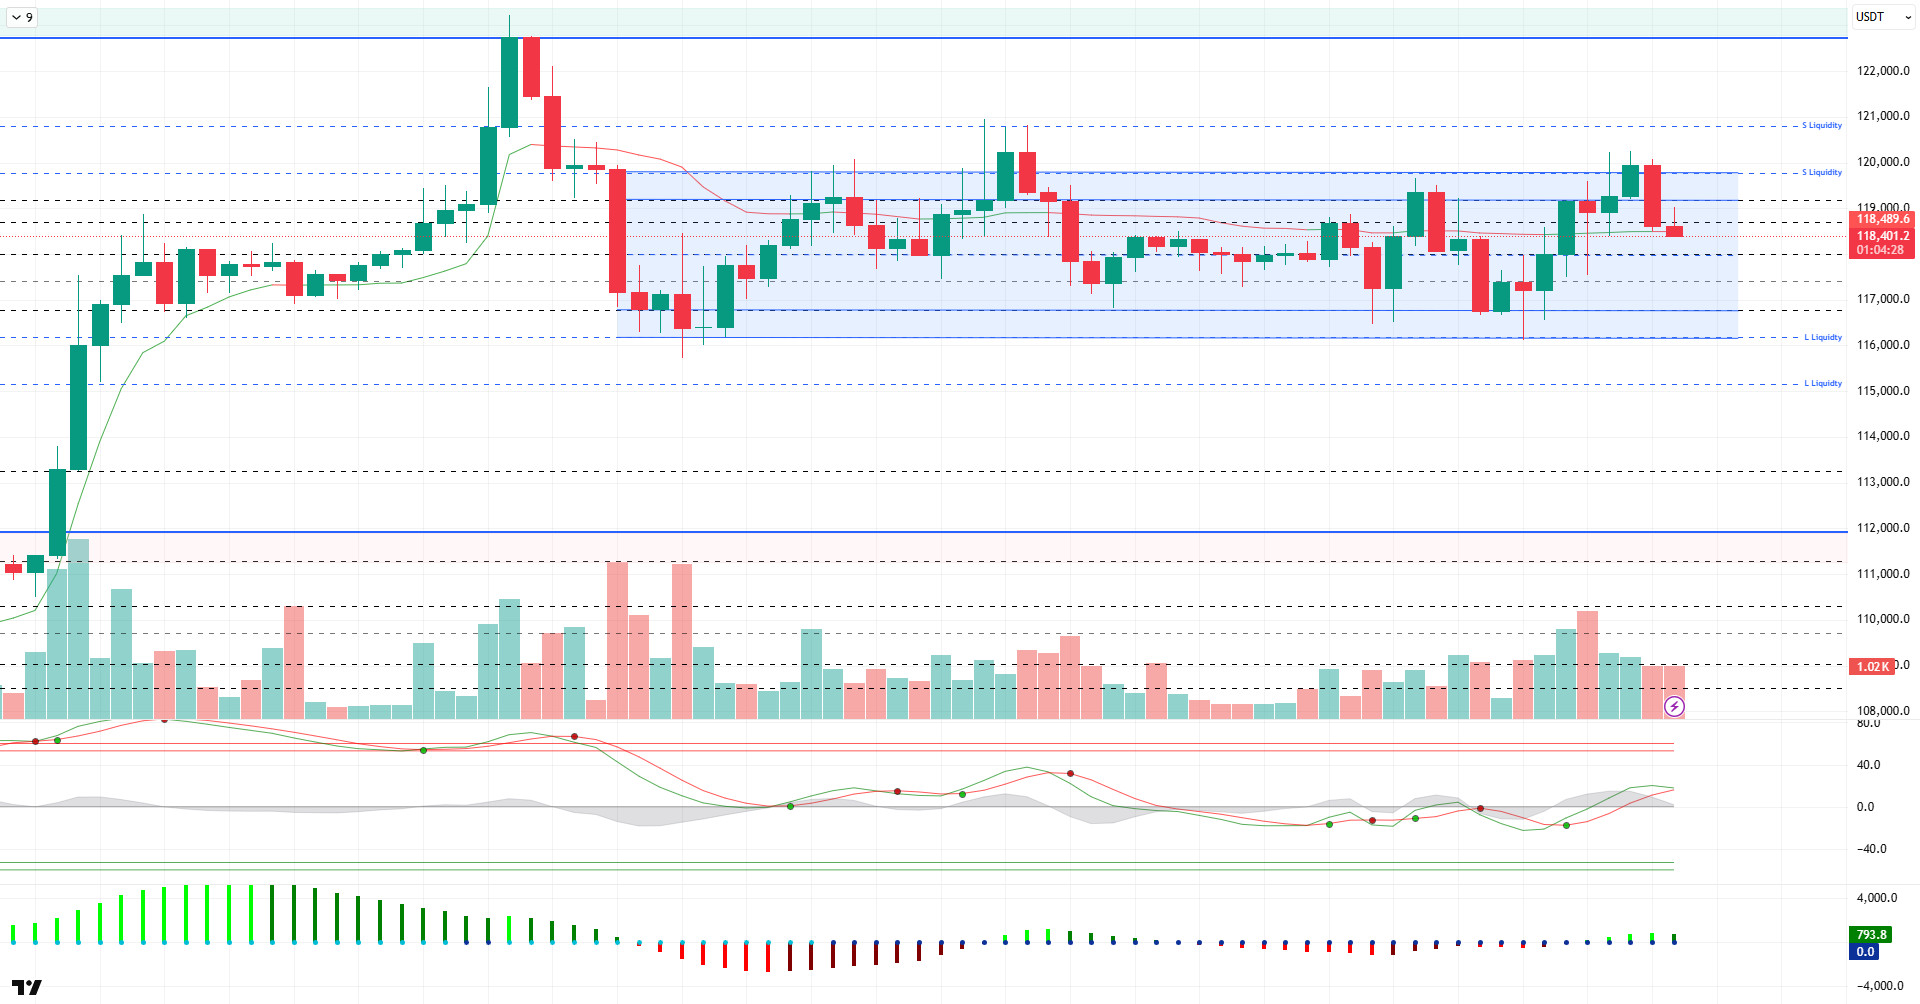
Looking at the technical picture, the BTC price continues to consolidate horizontally near its ATH level. BTC, which has been moving in the 116,000 – 119,000 band for some time, occasionally dips below these levels but then rebalances within this range. Yesterday, BTC tested the 120,000 level but was rejected once again from this area and retreated to the 118,400 level.
Looking at technical indicators, the Wave Trend (WT) oscillator continues to move within the middle band of the channel following the recent decline, but appears to be weakening. The histogram of the Squeeze Momentum (SM) indicator has regained momentum and moved into positive territory. The Kaufman moving average is just above the price at 118,400.
When liquidity data is examined, with the recent decline, the liquidation of positions with a strong buying trend at the 116,000 level has taken place, while another buying level continues to accumulate at the 115,000 level. On the selling side, short-term transactions are sparse, while long-term positions continue to accumulate in the 119,000–123,000 range. In this context, liquidation occurred in the 119,000–120,000 range with the recent rise.
In summary, with fundamental developments continuing to contribute positively to pricing, the price remains consolidated near its ATH level. The technical outlook indicates a sideways movement in the short term, accompanied by indecision, while liquidity data is limiting price movements. In the event of an upward trend, closes above the 120,000 minor resistance level will be monitored, and a breakout could bring new ATH levels into focus. In the event of potential selling pressure, closes below the 118,600-support level could drive the price toward the 115,000 level.
Supports 118,600 – 117,500 – 116,800
Resistance 120,000 – 121,000 – 123,300
 ETH/USDT
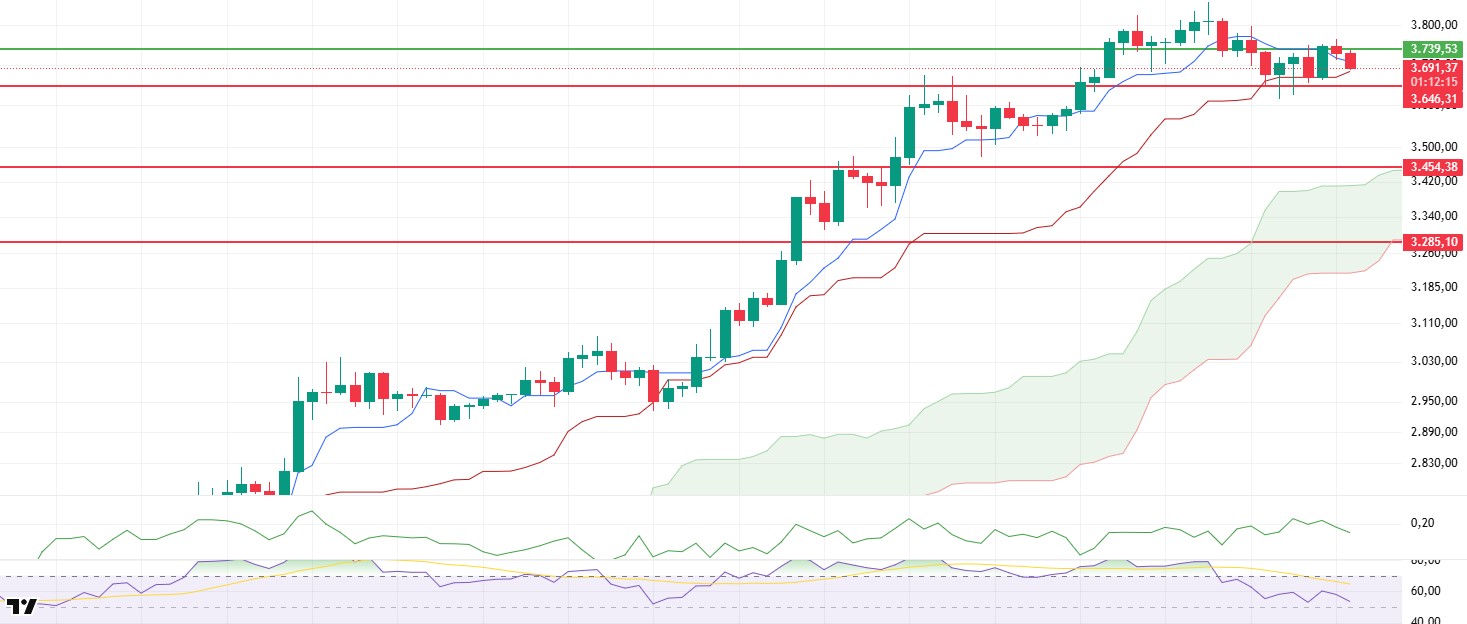
World Liberty Financial, which is linked to Trump, purchased more than 3,400 ETH worth a total of $13 million according to on-chain data, which was one of the notable developments in the market. Following this purchase, the ETH price gained upward momentum yesterday evening, surpassing the 3,739 dollar mark and briefly reaching the 3,760 dollar range. However, this rise was not sustained, and with increasing selling pressure during the night, the price dropped back below the 3,700 dollar level. Such sudden shifts in direction indicate that the market remains in an uncertain state and that short-term risks still persist.
Technical indicators support this fragile structure. When examining the Ichimoku indicator, it is notable that the price has lost the Tenkan level and is converging toward the Kijun support. This outlook could potentially strengthen negative scenarios, particularly in the short term. If the Kijun level is broken downward, the likelihood of accelerated declines and the price moving toward deeper support areas increases.
A similar pattern is observed in the Chaikin Money Flow (CMF) indicator. Although a slight decline is observed in the indicator, its continued presence in the positive zone suggests that new money is still entering the market, albeit at a limited pace. However, the lack of strength in these inflows indicates that the market is still far from a robust upward structure and that short-term downside risks remain on the table.
On the other hand, the Relative Strength Index (RSI) indicator also continues its downward trend, revealing a clear loss of momentum. This weakening in the RSI level indicates that buyers are losing strength and that the necessary driving force for the price to move upward remains weak. In particular, an RSI falling below the 50 threshold level can be interpreted as another signal that short-term pressure on the market may increase.
When all these technical factors are taken into account, downward pressure on the ETH price during the day and a retreat to the $3.646 level appear to be a likely scenario. However, if this correction remains limited and the price manages to re-establish itself above the 3,739 dollar band, it could break the negative outlook and pave the way for a new upward wave. Therefore, the 3,739 dollar level should be closely monitored as a critical threshold for the short-term outlook.
Top of Form
Below the Form
Supports 3,646 – 3,455 – 3,285
Resistances 3,739 – 4,084 – 4,381
XRP/USDT
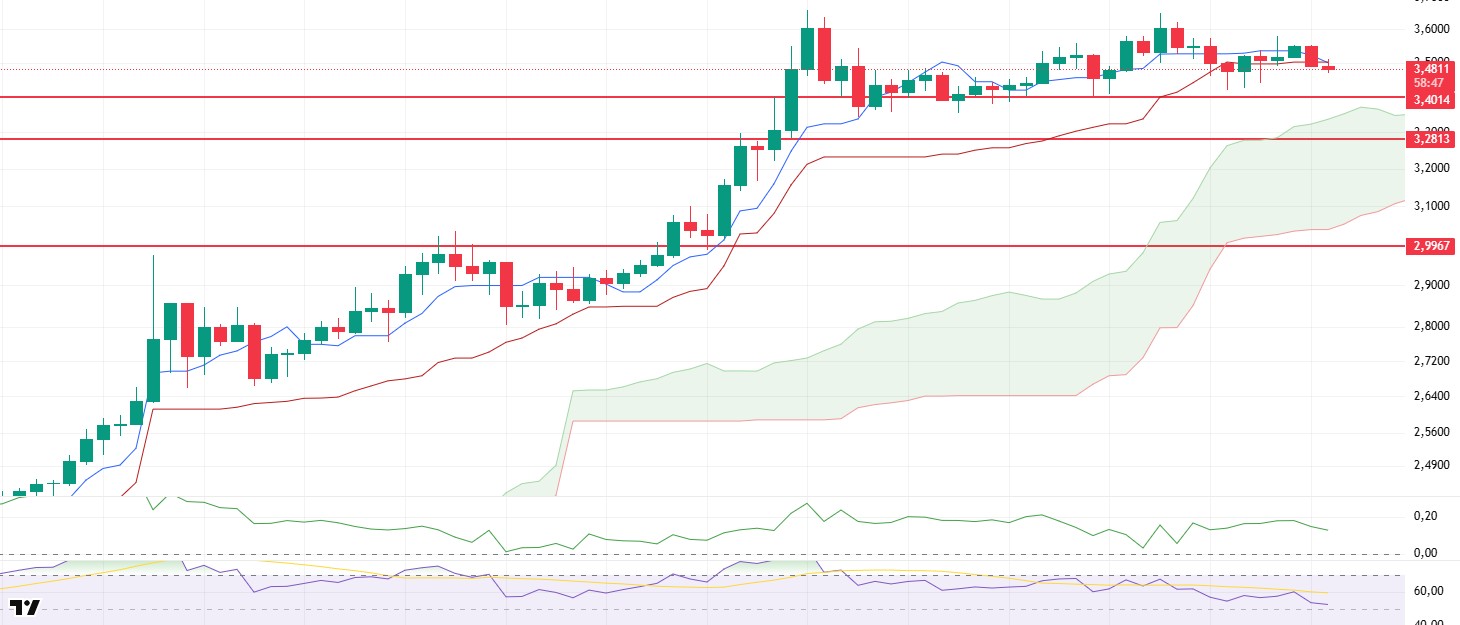
XRP rose to $3.58 yesterday evening, gaining significant momentum. Although this rise triggered short-term positive expectations, it was not sustainable, and the price fell back below $3.50 in the morning amid increased selling pressure. This pullback indicates that profit-taking is effective in the market and that investors are acting cautiously.
Technical indicators support this fragile structure. When examining the Ichimoku indicator, the downward crossover of the Tenkan level below the Kijun level amplifies the impact of the short-term negative structure. This crossover typically signals a weakening of market momentum and the dominance of the selling side. However, the price remaining above the Kumo cloud indicates that the structure has not completely broken down and that the medium-term positive outlook remains valid.
The Chaikin Money Flow (CMF) indicator also confirms this weak structure. Although the CMF remains in positive territory, it is trending downward. This indicates that, despite limited liquidity inflows persisting across the market, new inflows are insufficient to generate momentum. This outlook carries the risk that prices could test lower support levels if selling pressure intensifies.
There is also a similar weakness on the momentum side. The Relative Strength Index (RSI) indicator continues its downward movement and is retreating towards the 50 reference level. The RSI approaching this level indicates that buying power is decreasing and correction movements may come into play. If the RSI drops below the 50 level, this could more clearly signal a downward trend in prices in the short term.
When all these technical data are evaluated together, it can be predicted that downward movement in the XRP price may increase during the day and the price may decline to the $3.40 level. Purchases from this support level will be critical in terms of reversing the price direction upward. Otherwise, the decline may deepen and lower levels may be tested. On the other hand, if the price manages to break above the 3.55 dollar intermediate resistance level and maintain its position above this area, the negative scenario could become invalid, and a new upward movement could begin.
Supports 3.4014 – 3.2813 – 2.9967
Resistances 3.8615 – 4.000 – 4.4000
SOL/USDT
21Shares filed an amended S-1 form for its Dogecoin ETF. Solana SSK ETF surpassed $100 million.
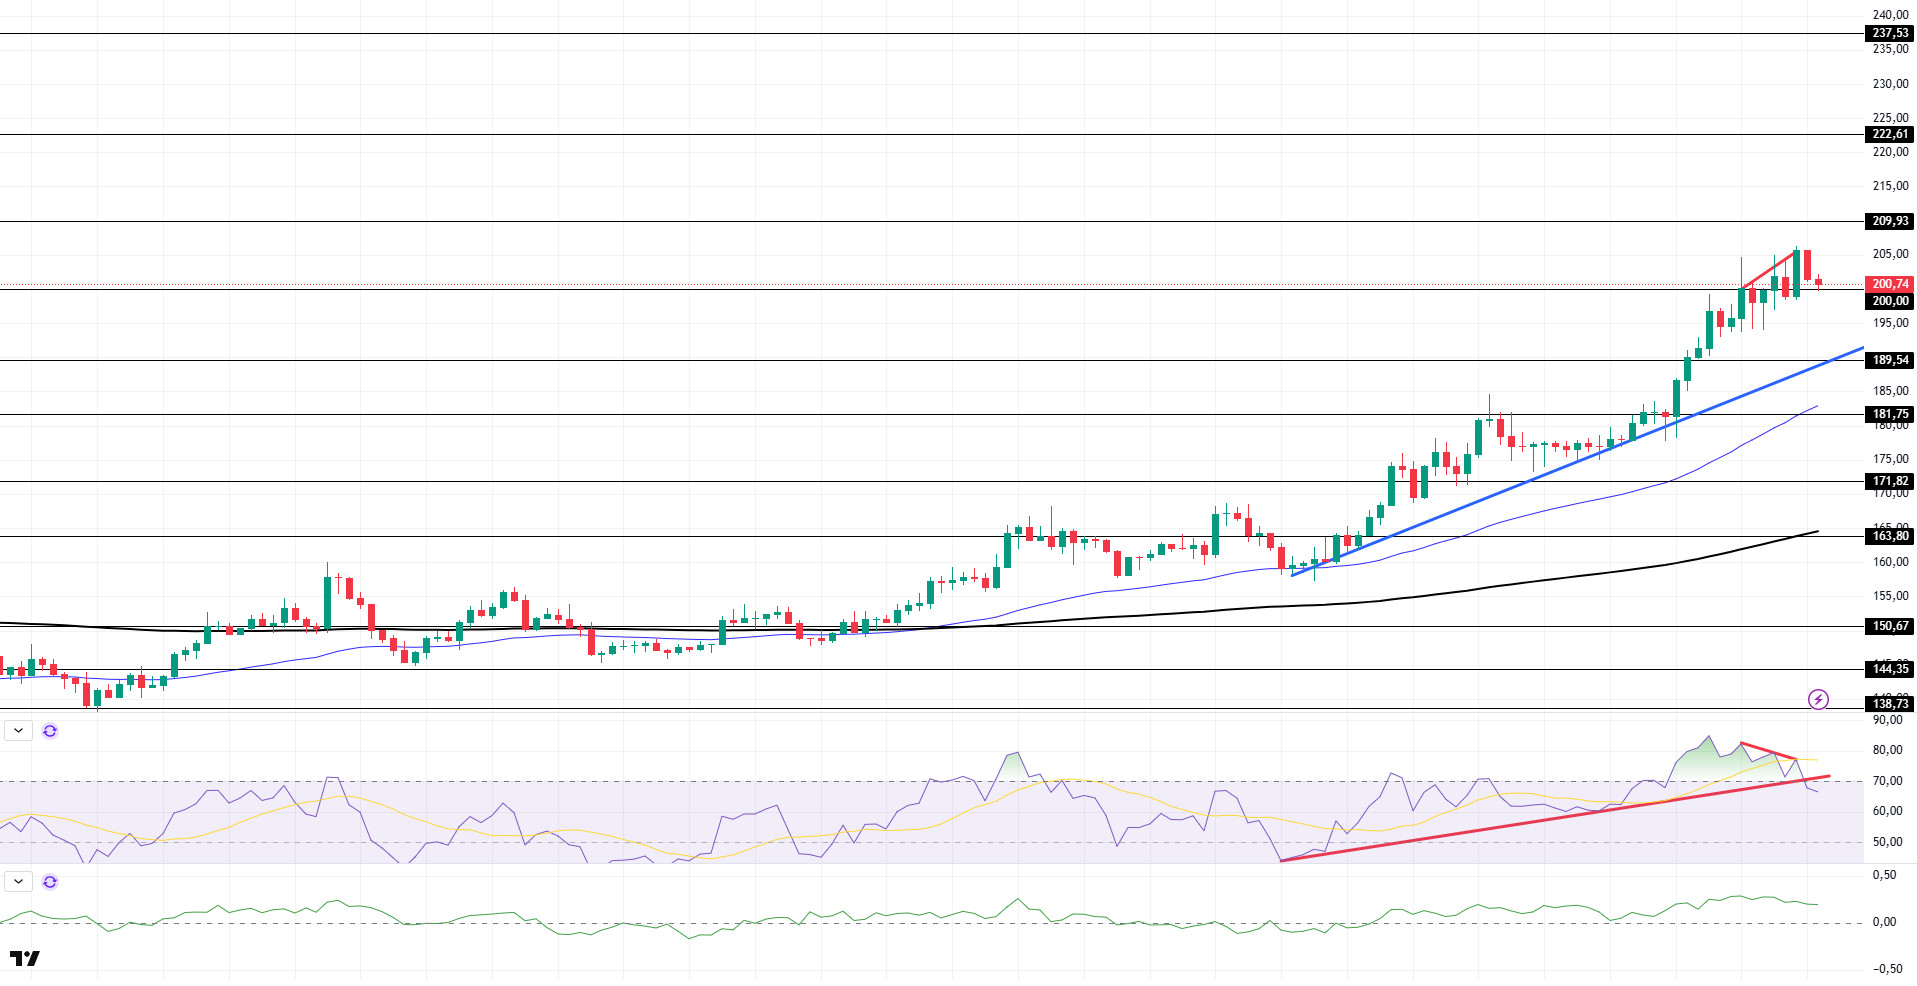
SOL price continued its upward trend. The asset continues to remain above the upward trend that began on July 15. The price, which gained upward momentum from the upward trend, broke through the 200.00 dollar level with support from the 171.82 dollar level and has begun to move sideways as of now. If the upward trend continues, it could test the 209.93 dollar level. Otherwise, the upward trend could be tested as support.
On the 4-hour chart, the 50 EMA (blue line) remains above the 200 EMA (black line). This indicates that the medium-term uptrend may continue. At the same time, the fact that the price is above both moving averages shows that the market is currently trending upward in the short term. On the other hand, a large difference between the two moving averages could trigger a decline or a sideways trend. Chaikin Money Flow (CMF-20) remained in positive territory. However, a decrease in money inflows could push the CMF into the negative zone. The Relative Strength Index (RSI-14) continues to remain in the positive zone, showing a decline from the overbought zone. At the same time, selling pressure has formed. Additionally, a negative divergence has formed, which could lead to a decline. Additionally, the upward trend that began on July 15 has been broken downward. If there is an upward movement due to macroeconomic data or positive news related to the Solana ecosystem, the $209.93 level stands out as a strong resistance point. If this level is broken upward, the upward movement is expected to continue. In the event of a pullback due to adverse developments or profit-taking, the 189.54 dollar level could be tested. A decline to these support levels could see an increase in buying momentum, potentially presenting an opportunity for an upward move.
Supports 200.00 – 189.54 – 181.75
Resistance levels 209.93 – 222.61 – 237.53
DOGE/USDT
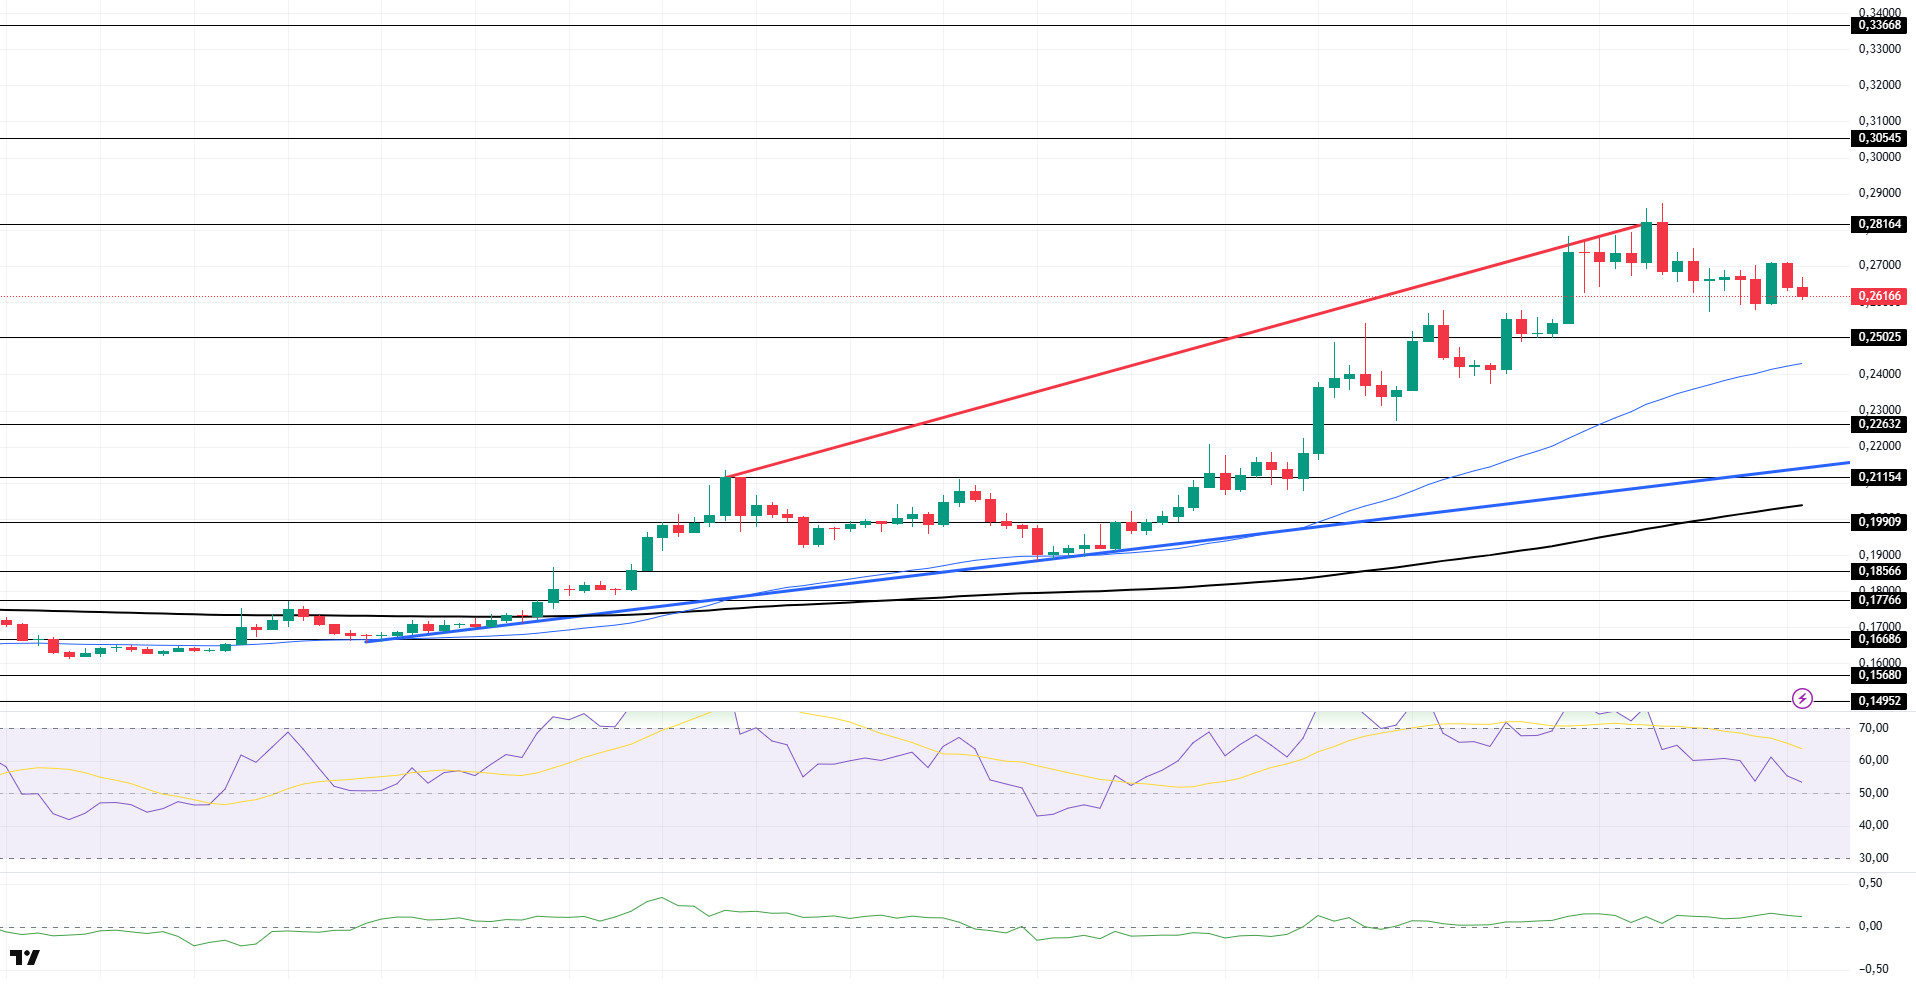
DOGE price remained flat. The asset continued to stay above the 200 EMA (Black Line) and 50 EMA (Blue Line) moving averages with the upward trend that began on July 7. Breaking through the strong resistance level of $0.25025, the asset tested the $0.28164 level but failed to sustain its momentum, leading to a pullback from this point. If the pullback continues, the $0.25025 level should be monitored. If upward momentum resumes, the asset could test the 0.30545 dollar level.
On the 4-hour chart, the 50 EMA (Blue Line) remains above the 200 EMA (Black Line). This indicates that the asset is in an upward trend in the medium term. The price being above both moving averages indicates that the asset is in an upward trend in the short term. A large difference between the two moving averages may cause the price to decline or move sideways. Chaikin Money Flow (CMF-20) remained in positive territory. Additionally, negative cash inflows could push the CMF into the negative zone. The Relative Strength Index (RSI-14) has retreated to the middle of the positive zone. In addition, a regular divergence formation is present. This may cause the price to fall further. In the event of an uptrend driven by political developments, macroeconomic data, or positive news flow in the DOGE ecosystem, the $0.30545 level stands out as a strong resistance zone. In the opposite scenario or in the event of negative news flow, the 0.25025 dollar level could be triggered. A decline to these levels could increase momentum and potentially trigger a new upward wave.
Support 0.25025 – 0.22632 – 0.21154
Resistance levels 0.28164 – 0.30545 – 0.33668
Legal Notice
The investment information, comments and recommendations contained herein do not constitute investment advice. Investment advisory services are provided individually by authorized institutions taking into account the risk and return preferences of individuals. The comments and recommendations contained herein are of a general nature. These recommendations may not be suitable for your financial situation and risk and return preferences. Therefore, making an investment decision based solely on the information contained herein may not produce results in line with your expectations.