
Weekly Bitcoin Onchain Report
Active Addresses
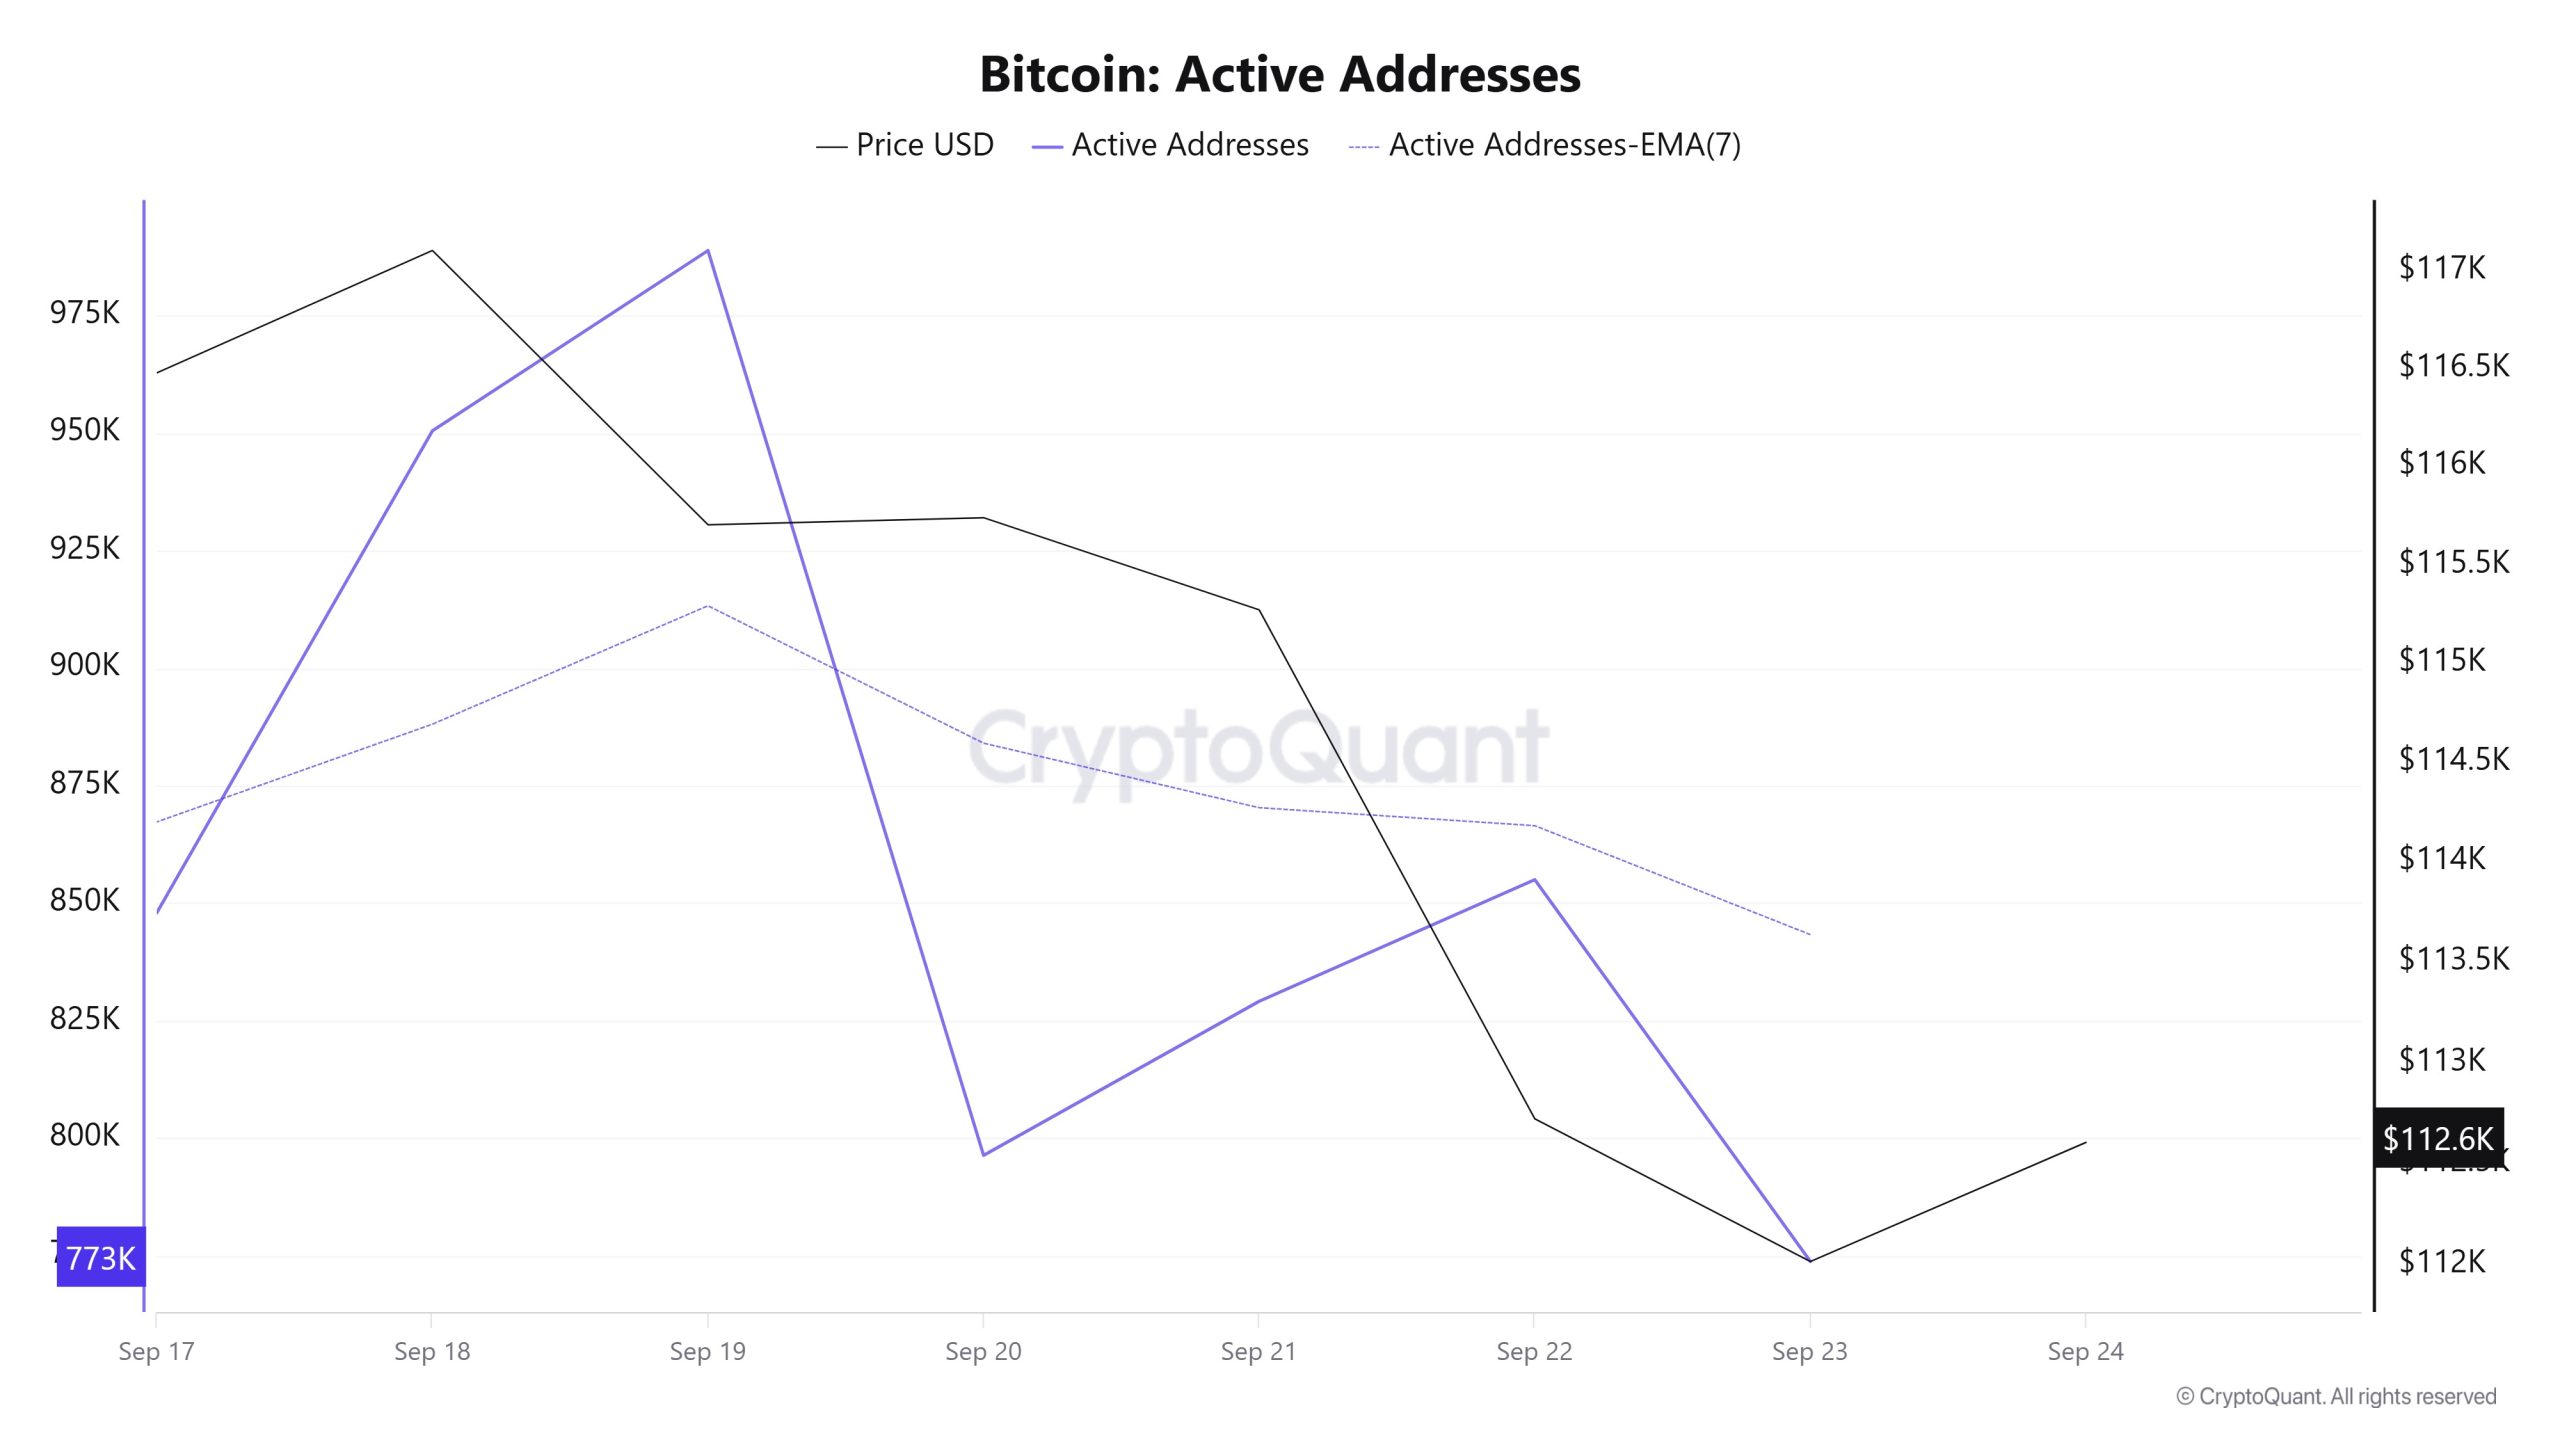
Between September 17 and September 24, 988,929 active addresses entered the Bitcoin network. During this period, the Bitcoin price rose as high as $117,000. The decline in the number of active addresses, especially on September 20, moved the price in the band towards $112,000. From a technical perspective, it is noteworthy that the 7-day simple moving average (SMA) is moving down. This technical signal indicates a sell-off on the market.
Active Sending Addresses
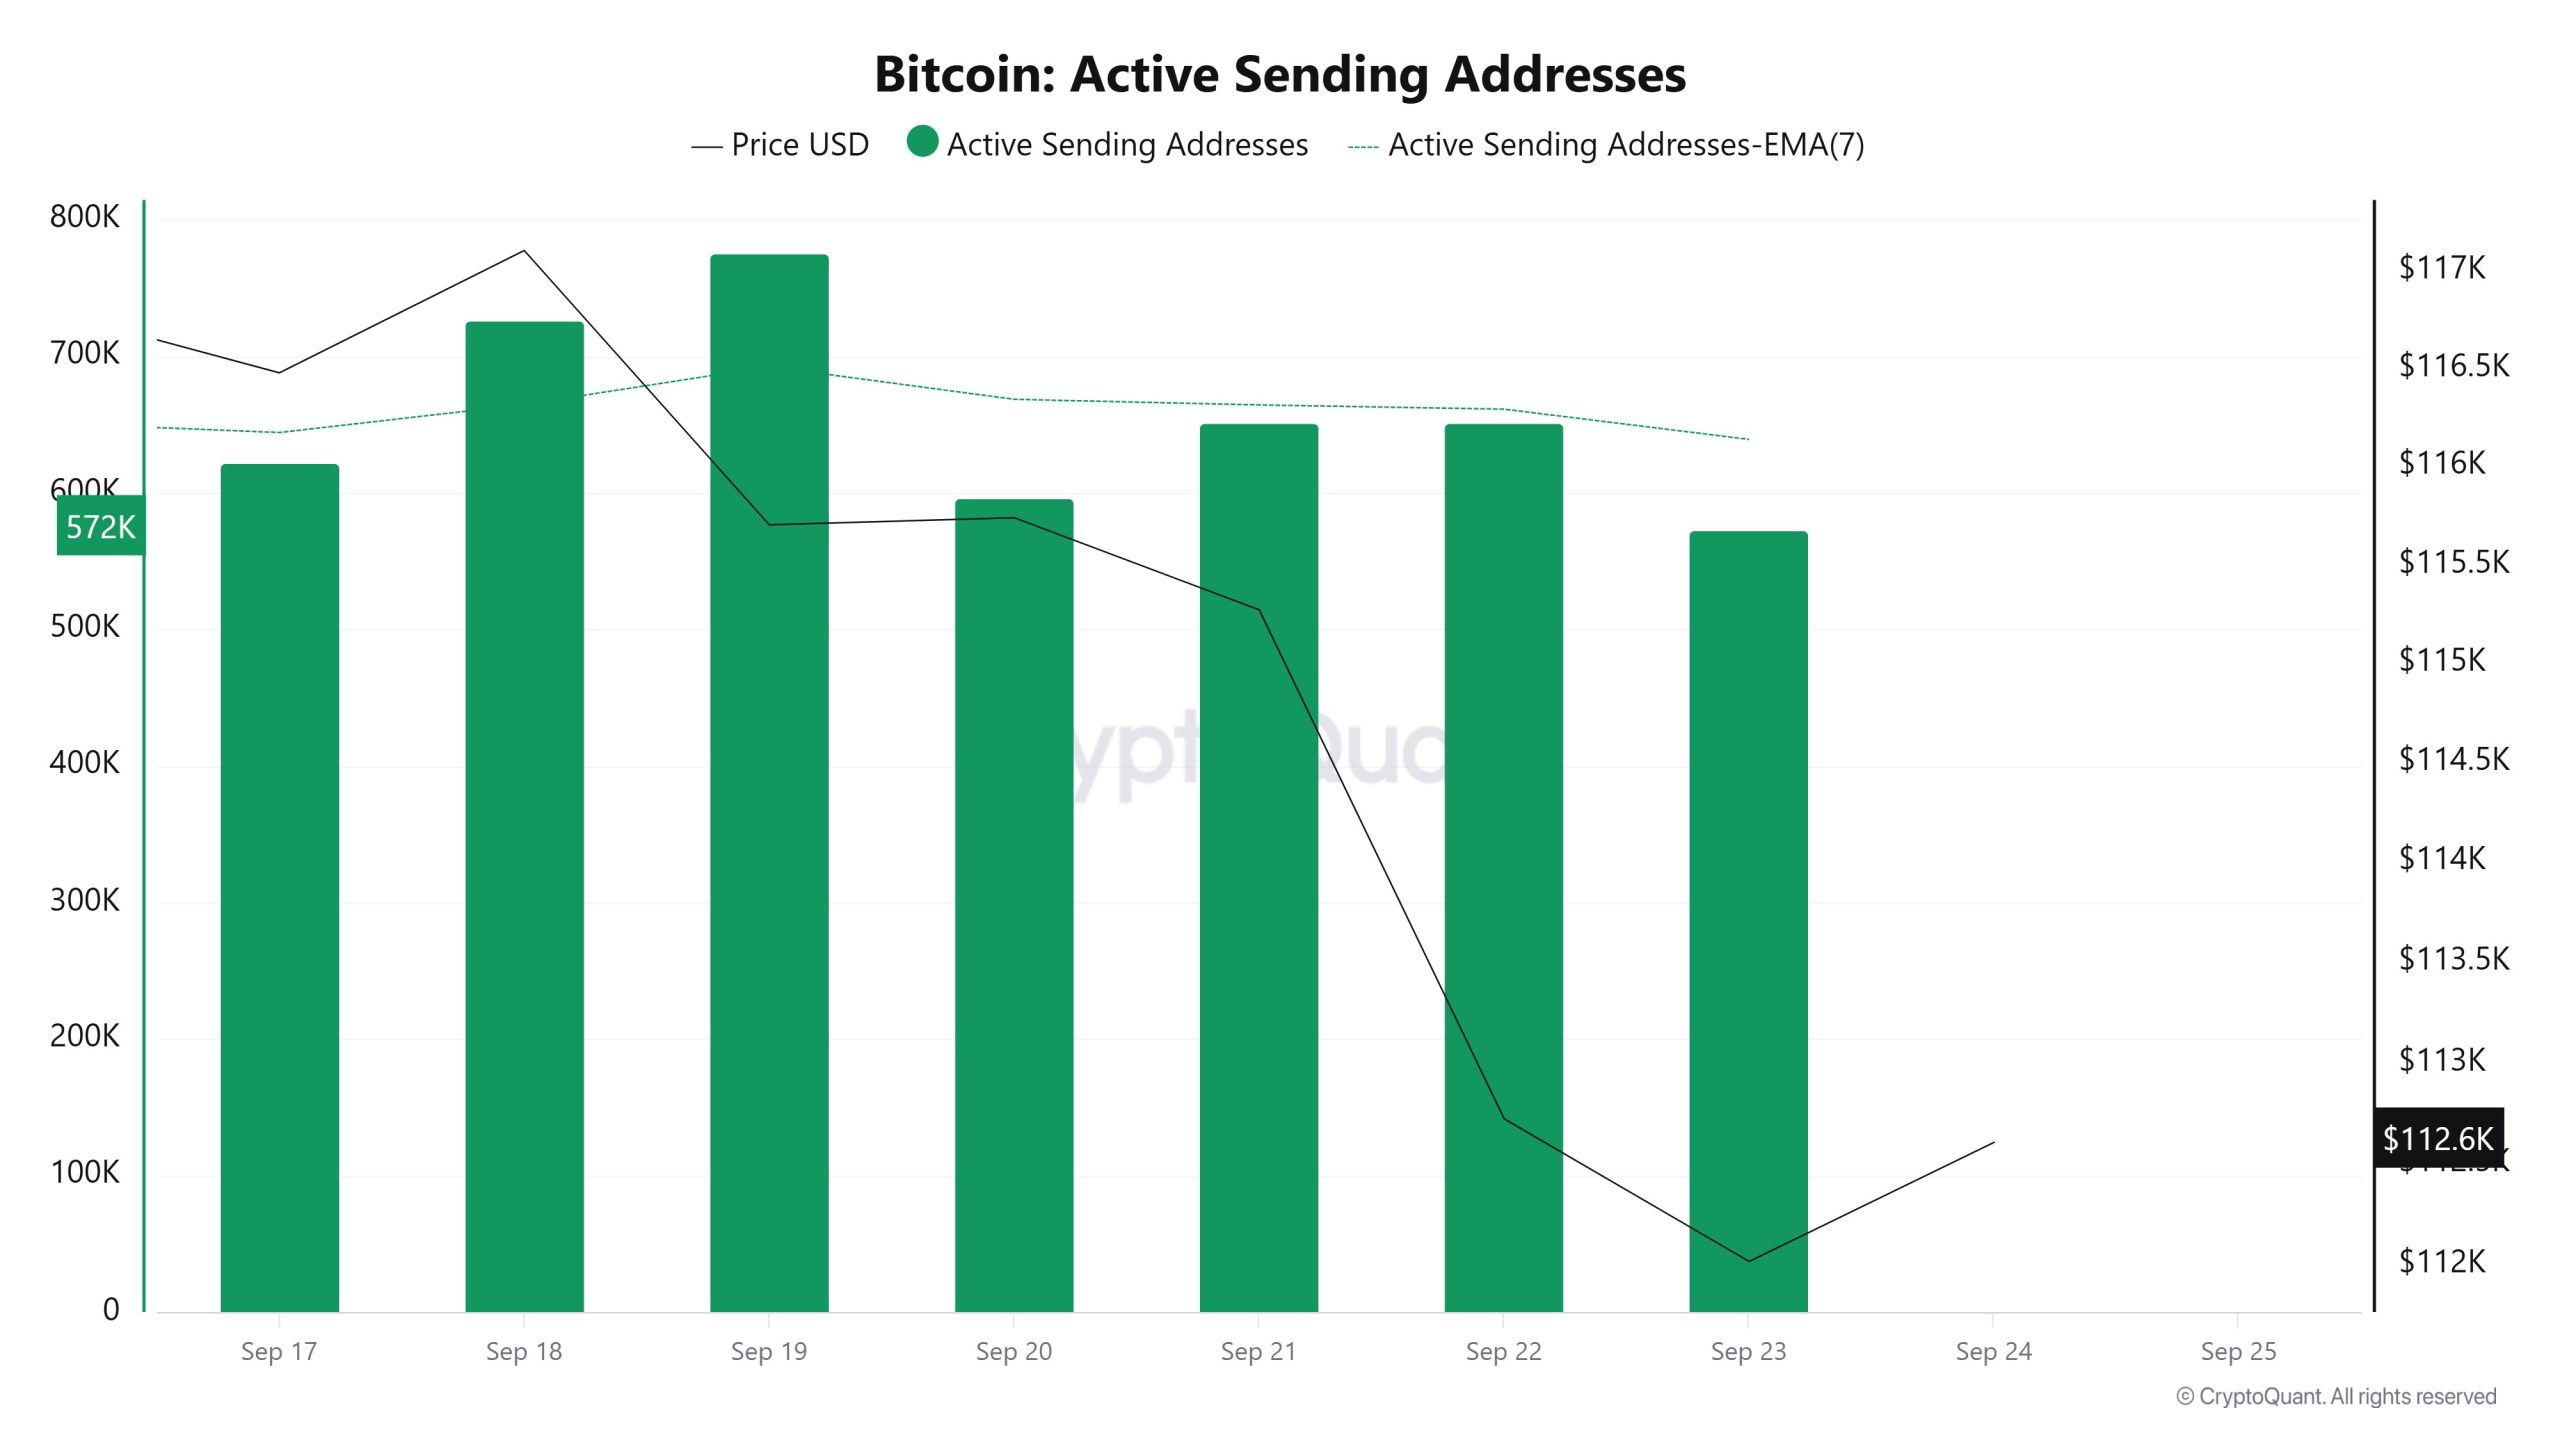
Between September 17 and September 24, the “Active Sending Addresses” metric showed an upward trend. On the day of the price high, this metric hovered at 726,090, indicating that user activity on the Bitcoin network has moved in tandem with the price. This data shows that the $117,000 level is supported on a bearish basis, not only in terms of price, but also in terms of on-chain address activity . Overall, the Active Sending Addresses metric followed a downward trend during this period.
Active Receiving Addresses
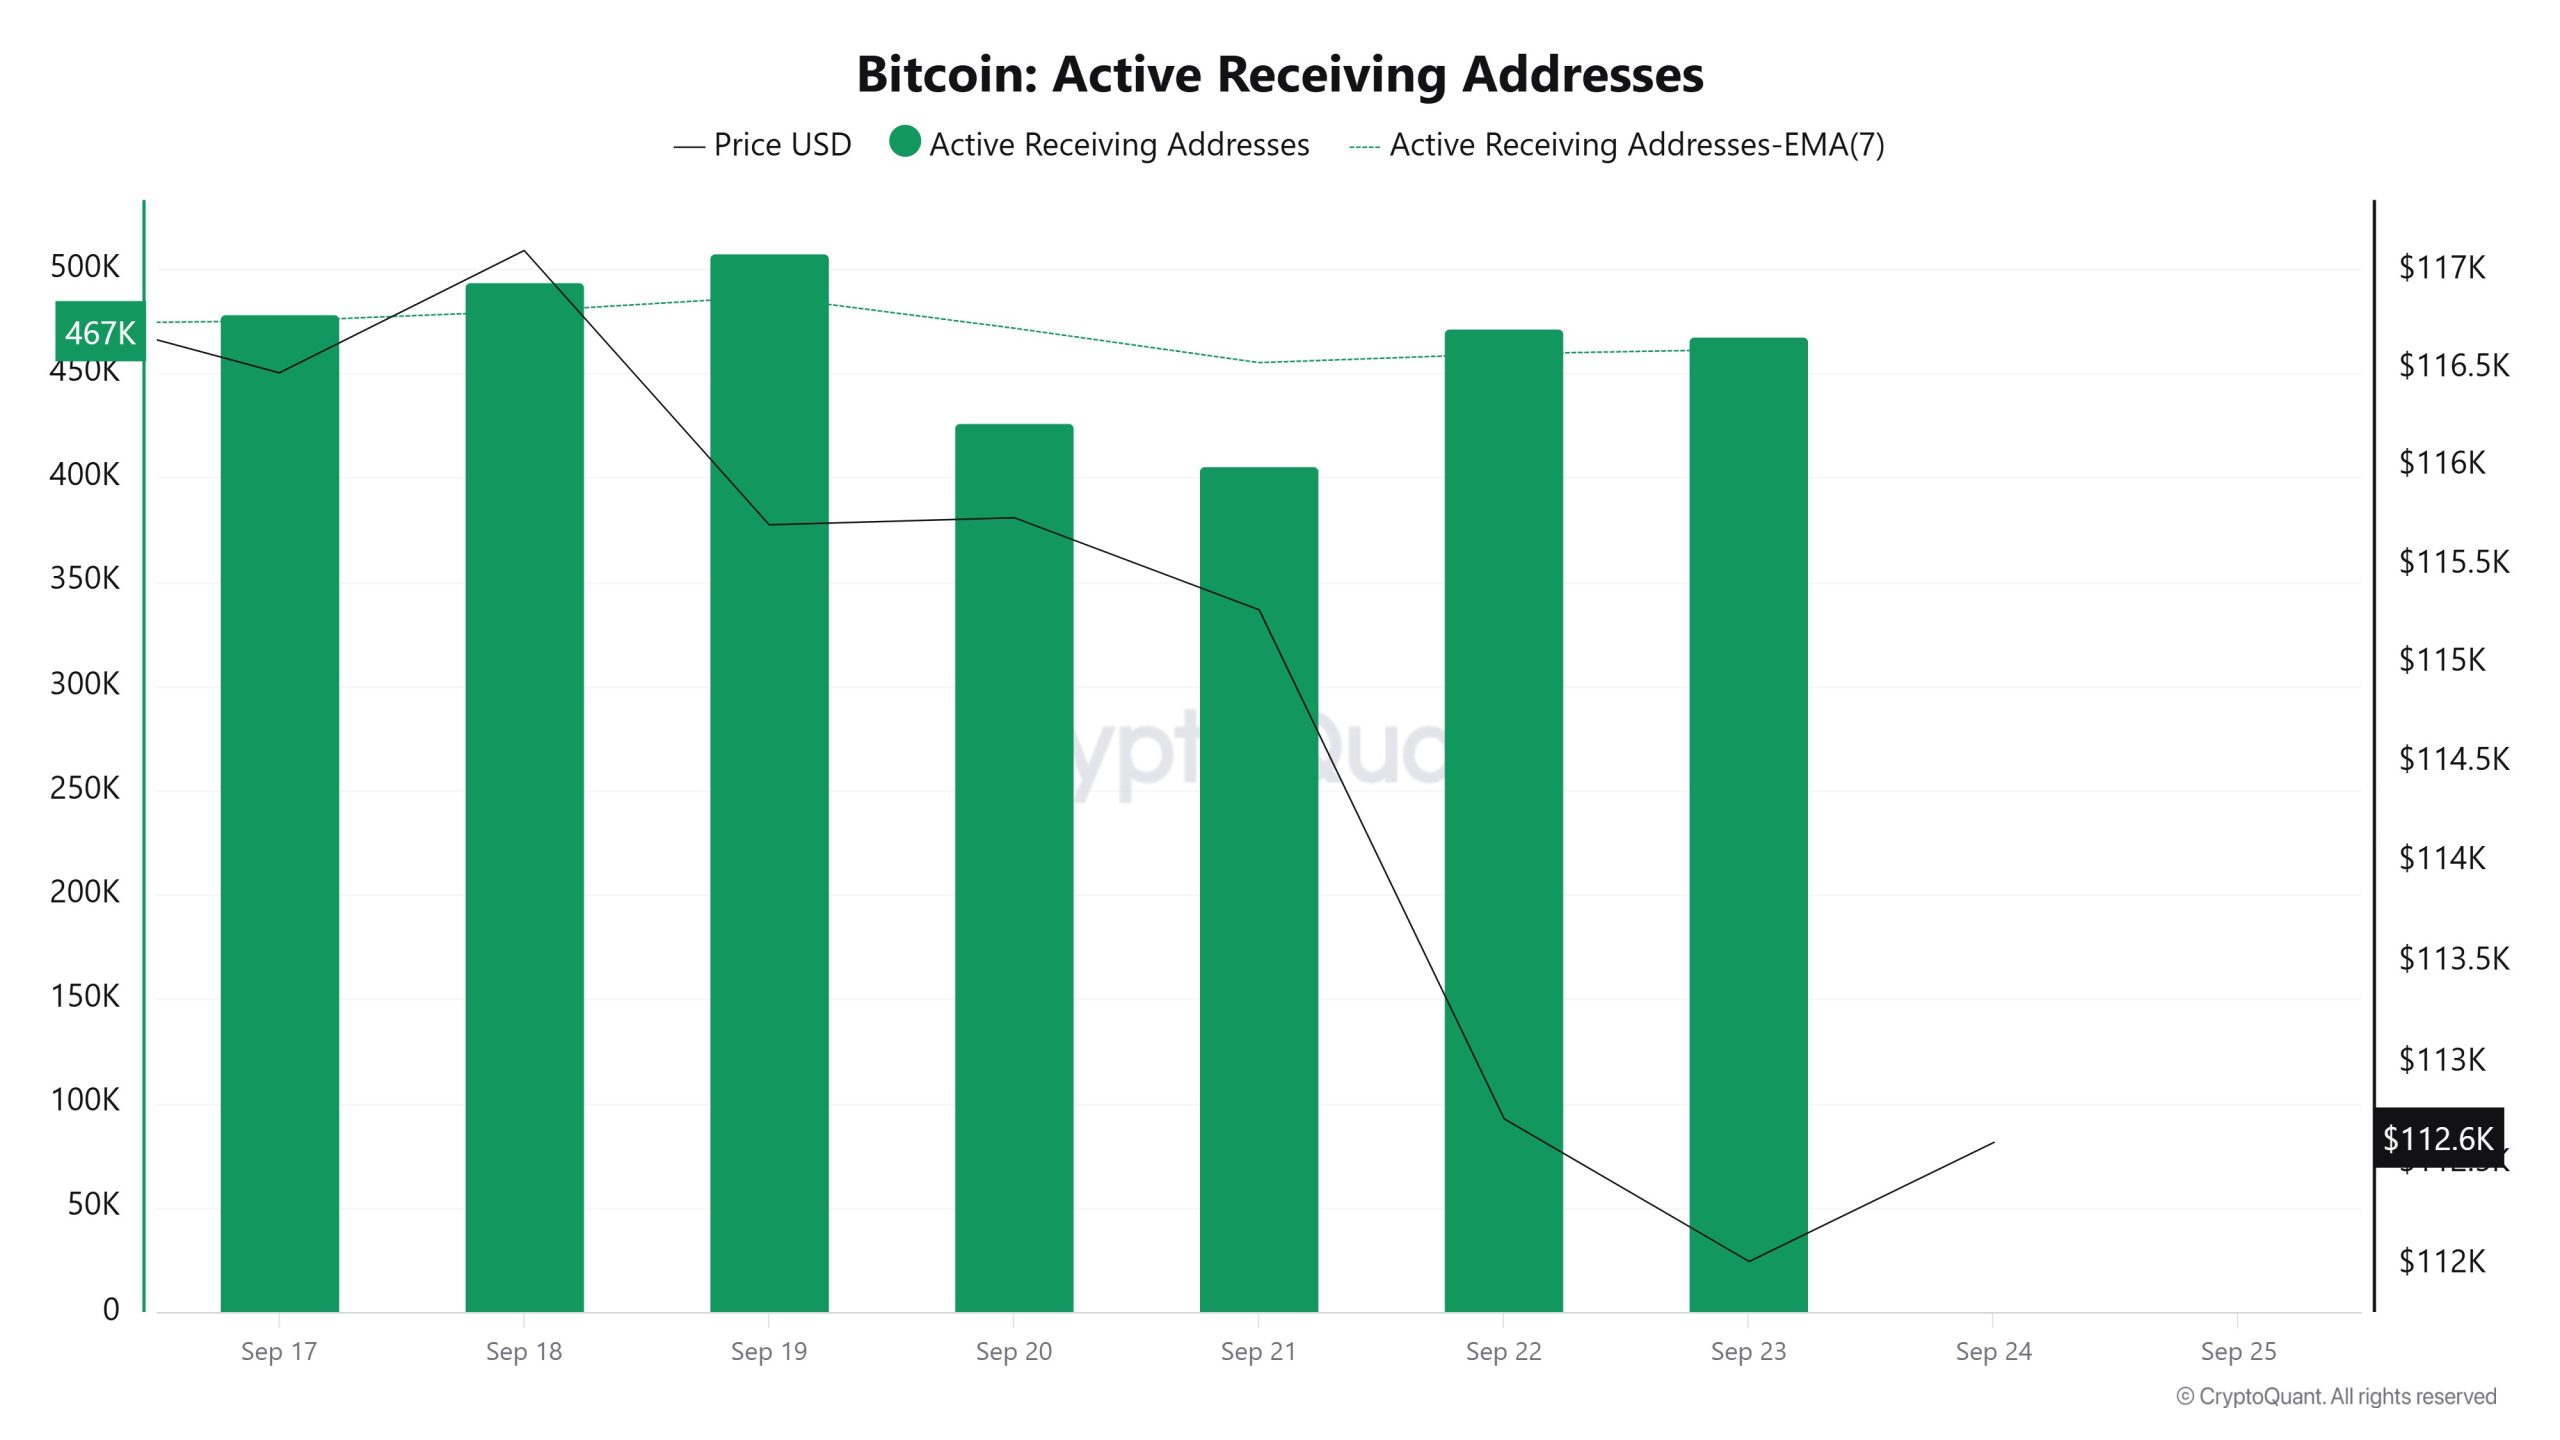
Between September 17th and September 24th, there was a regular rise in active buying addresses with the Black Line (price line). On the day the price reached its high, active buying addresses rose as high as 493,570, indicating that buyers were buying Bitcoin at $115,000.
Derivatives
Open Interest
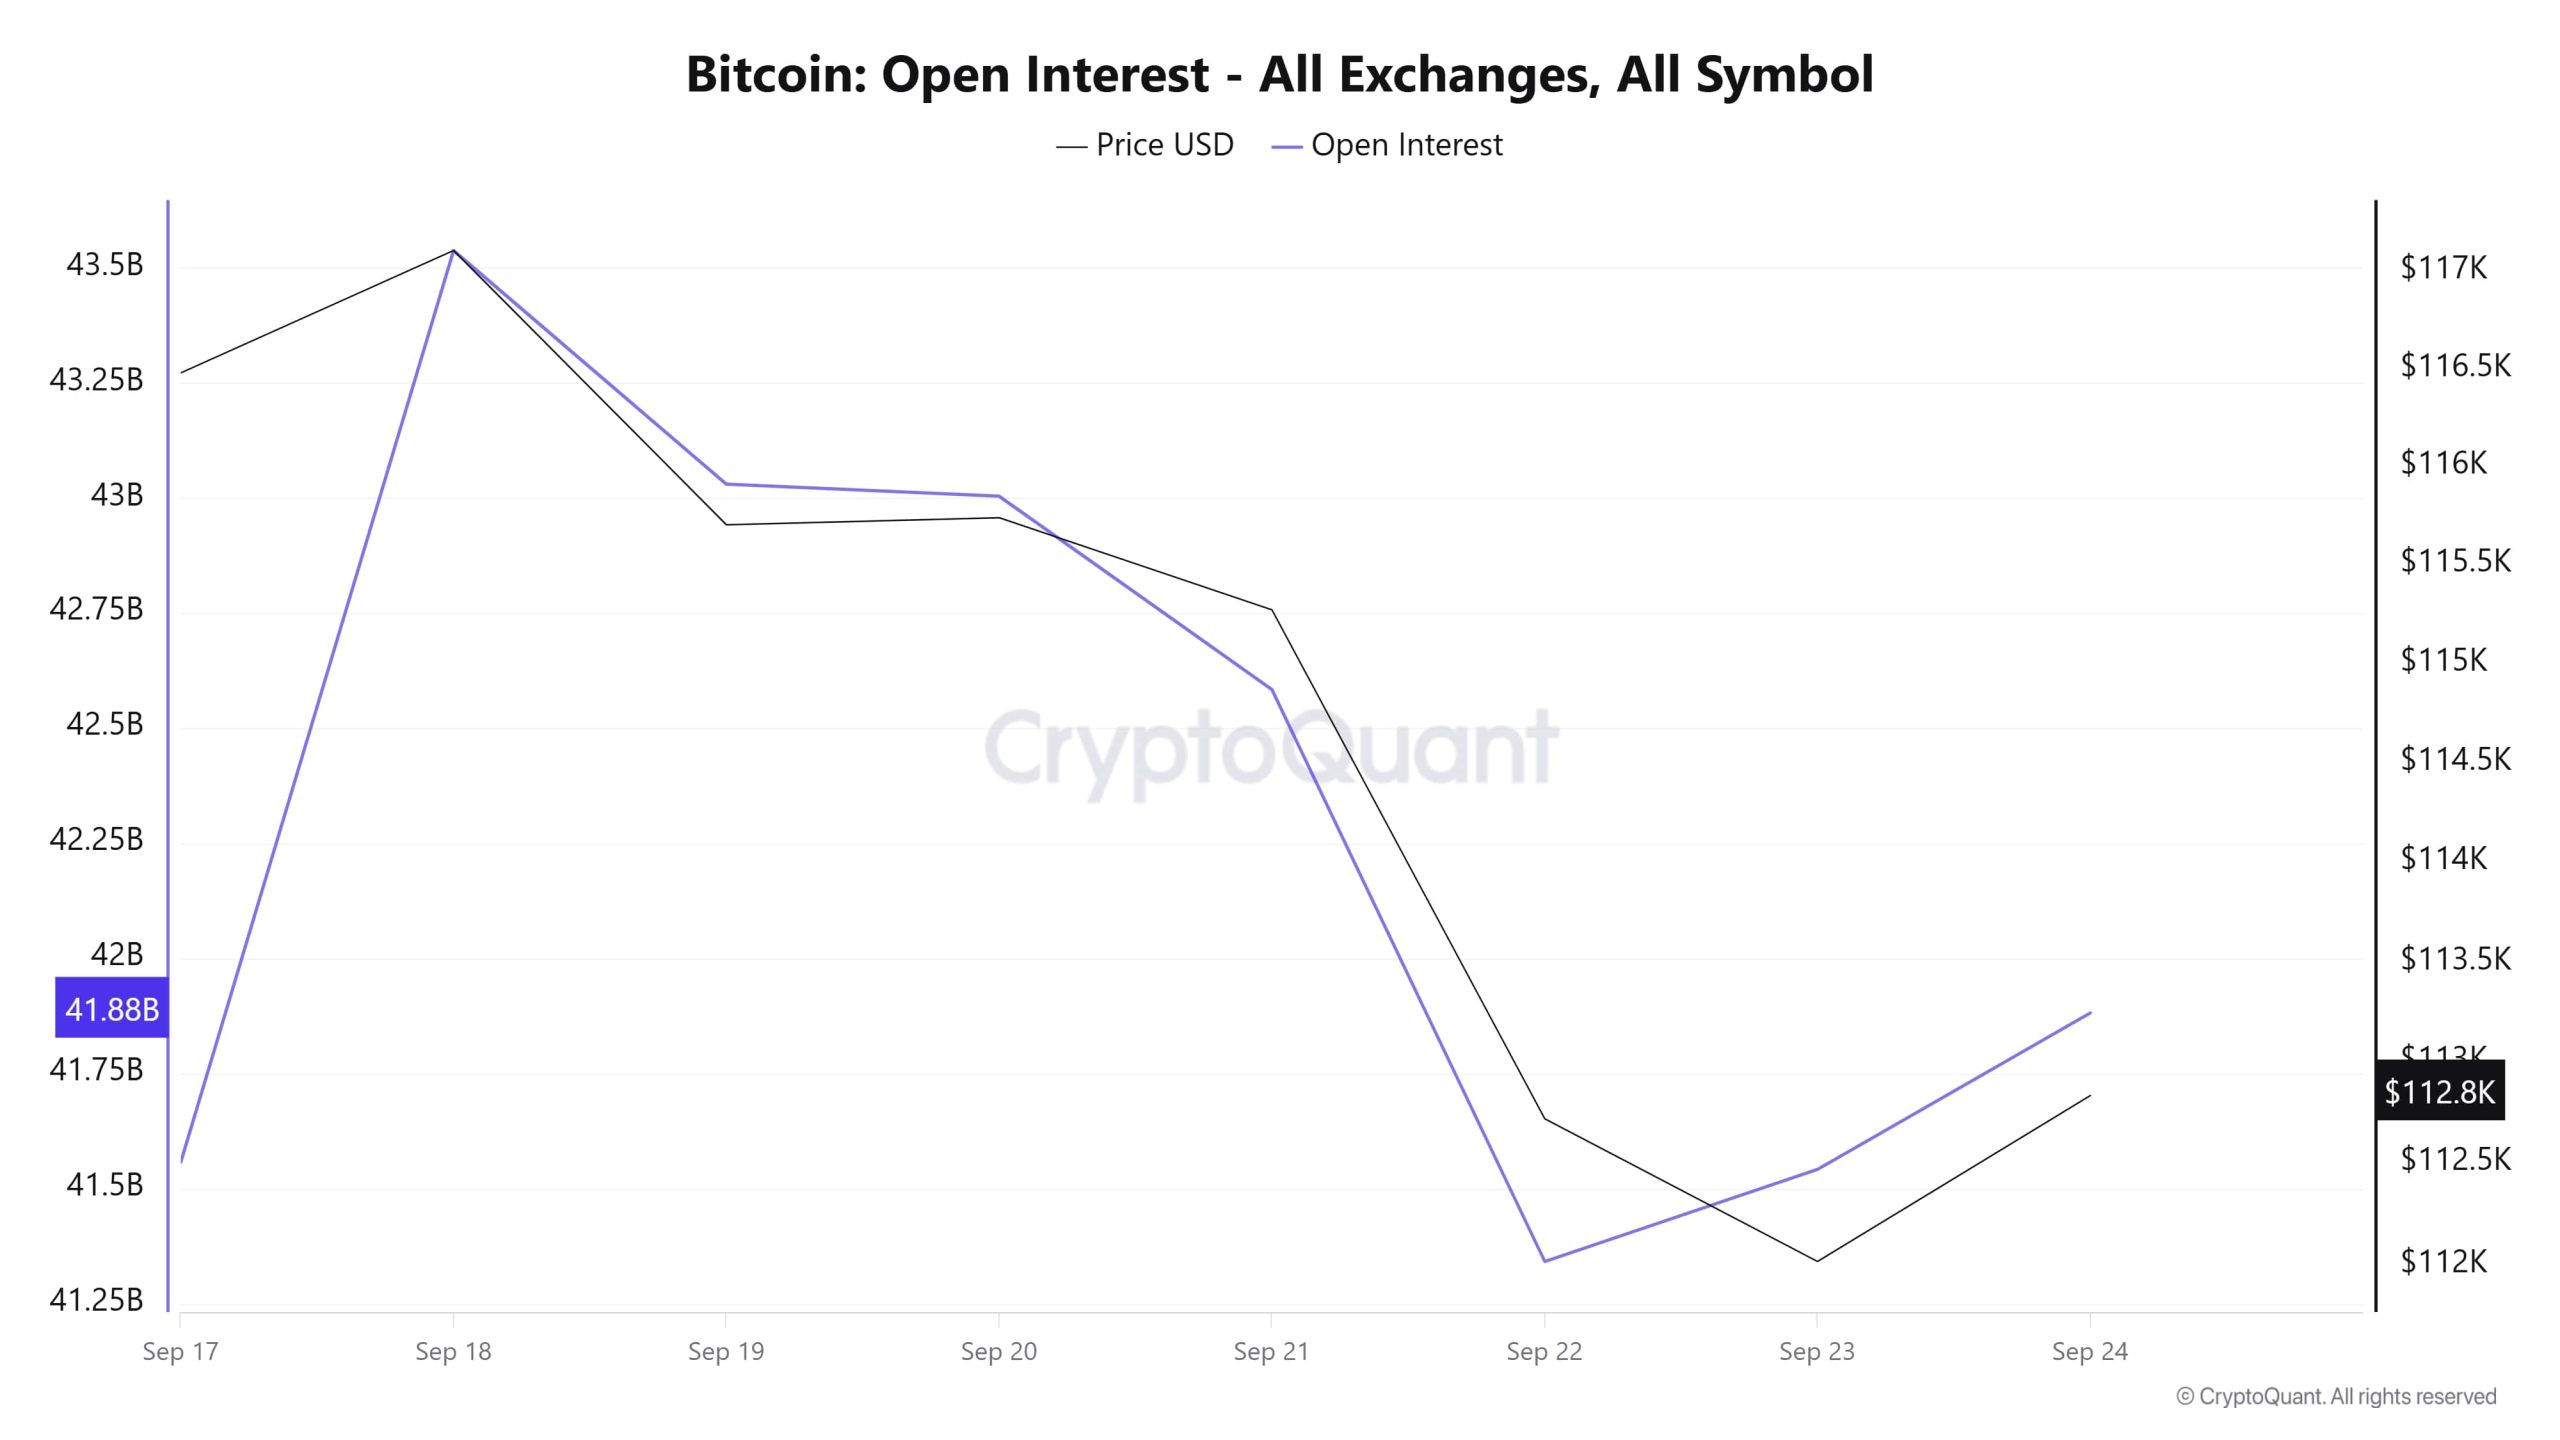
On September 17, open interest is around $41.5 billion and the price hovers above $116,000. On September 18, both rise and reach a peak, with open interest nearing $43.5 billion and the price at $117,000. However, after this point, both price and open interest enter a rapid downtrend. Between September 21 and 22, this decline becomes more pronounced, with the price falling to around $112,000 and open interest down to $41.25 billion. September 23 and 24 saw a slight rebound, with open interest approaching $41.9 billion and price stabilizing at $112,800. In general, the chart shows that price and open interest move in parallel, and the correlation is stronger, especially during periods of sharp declines.
Funding Rate
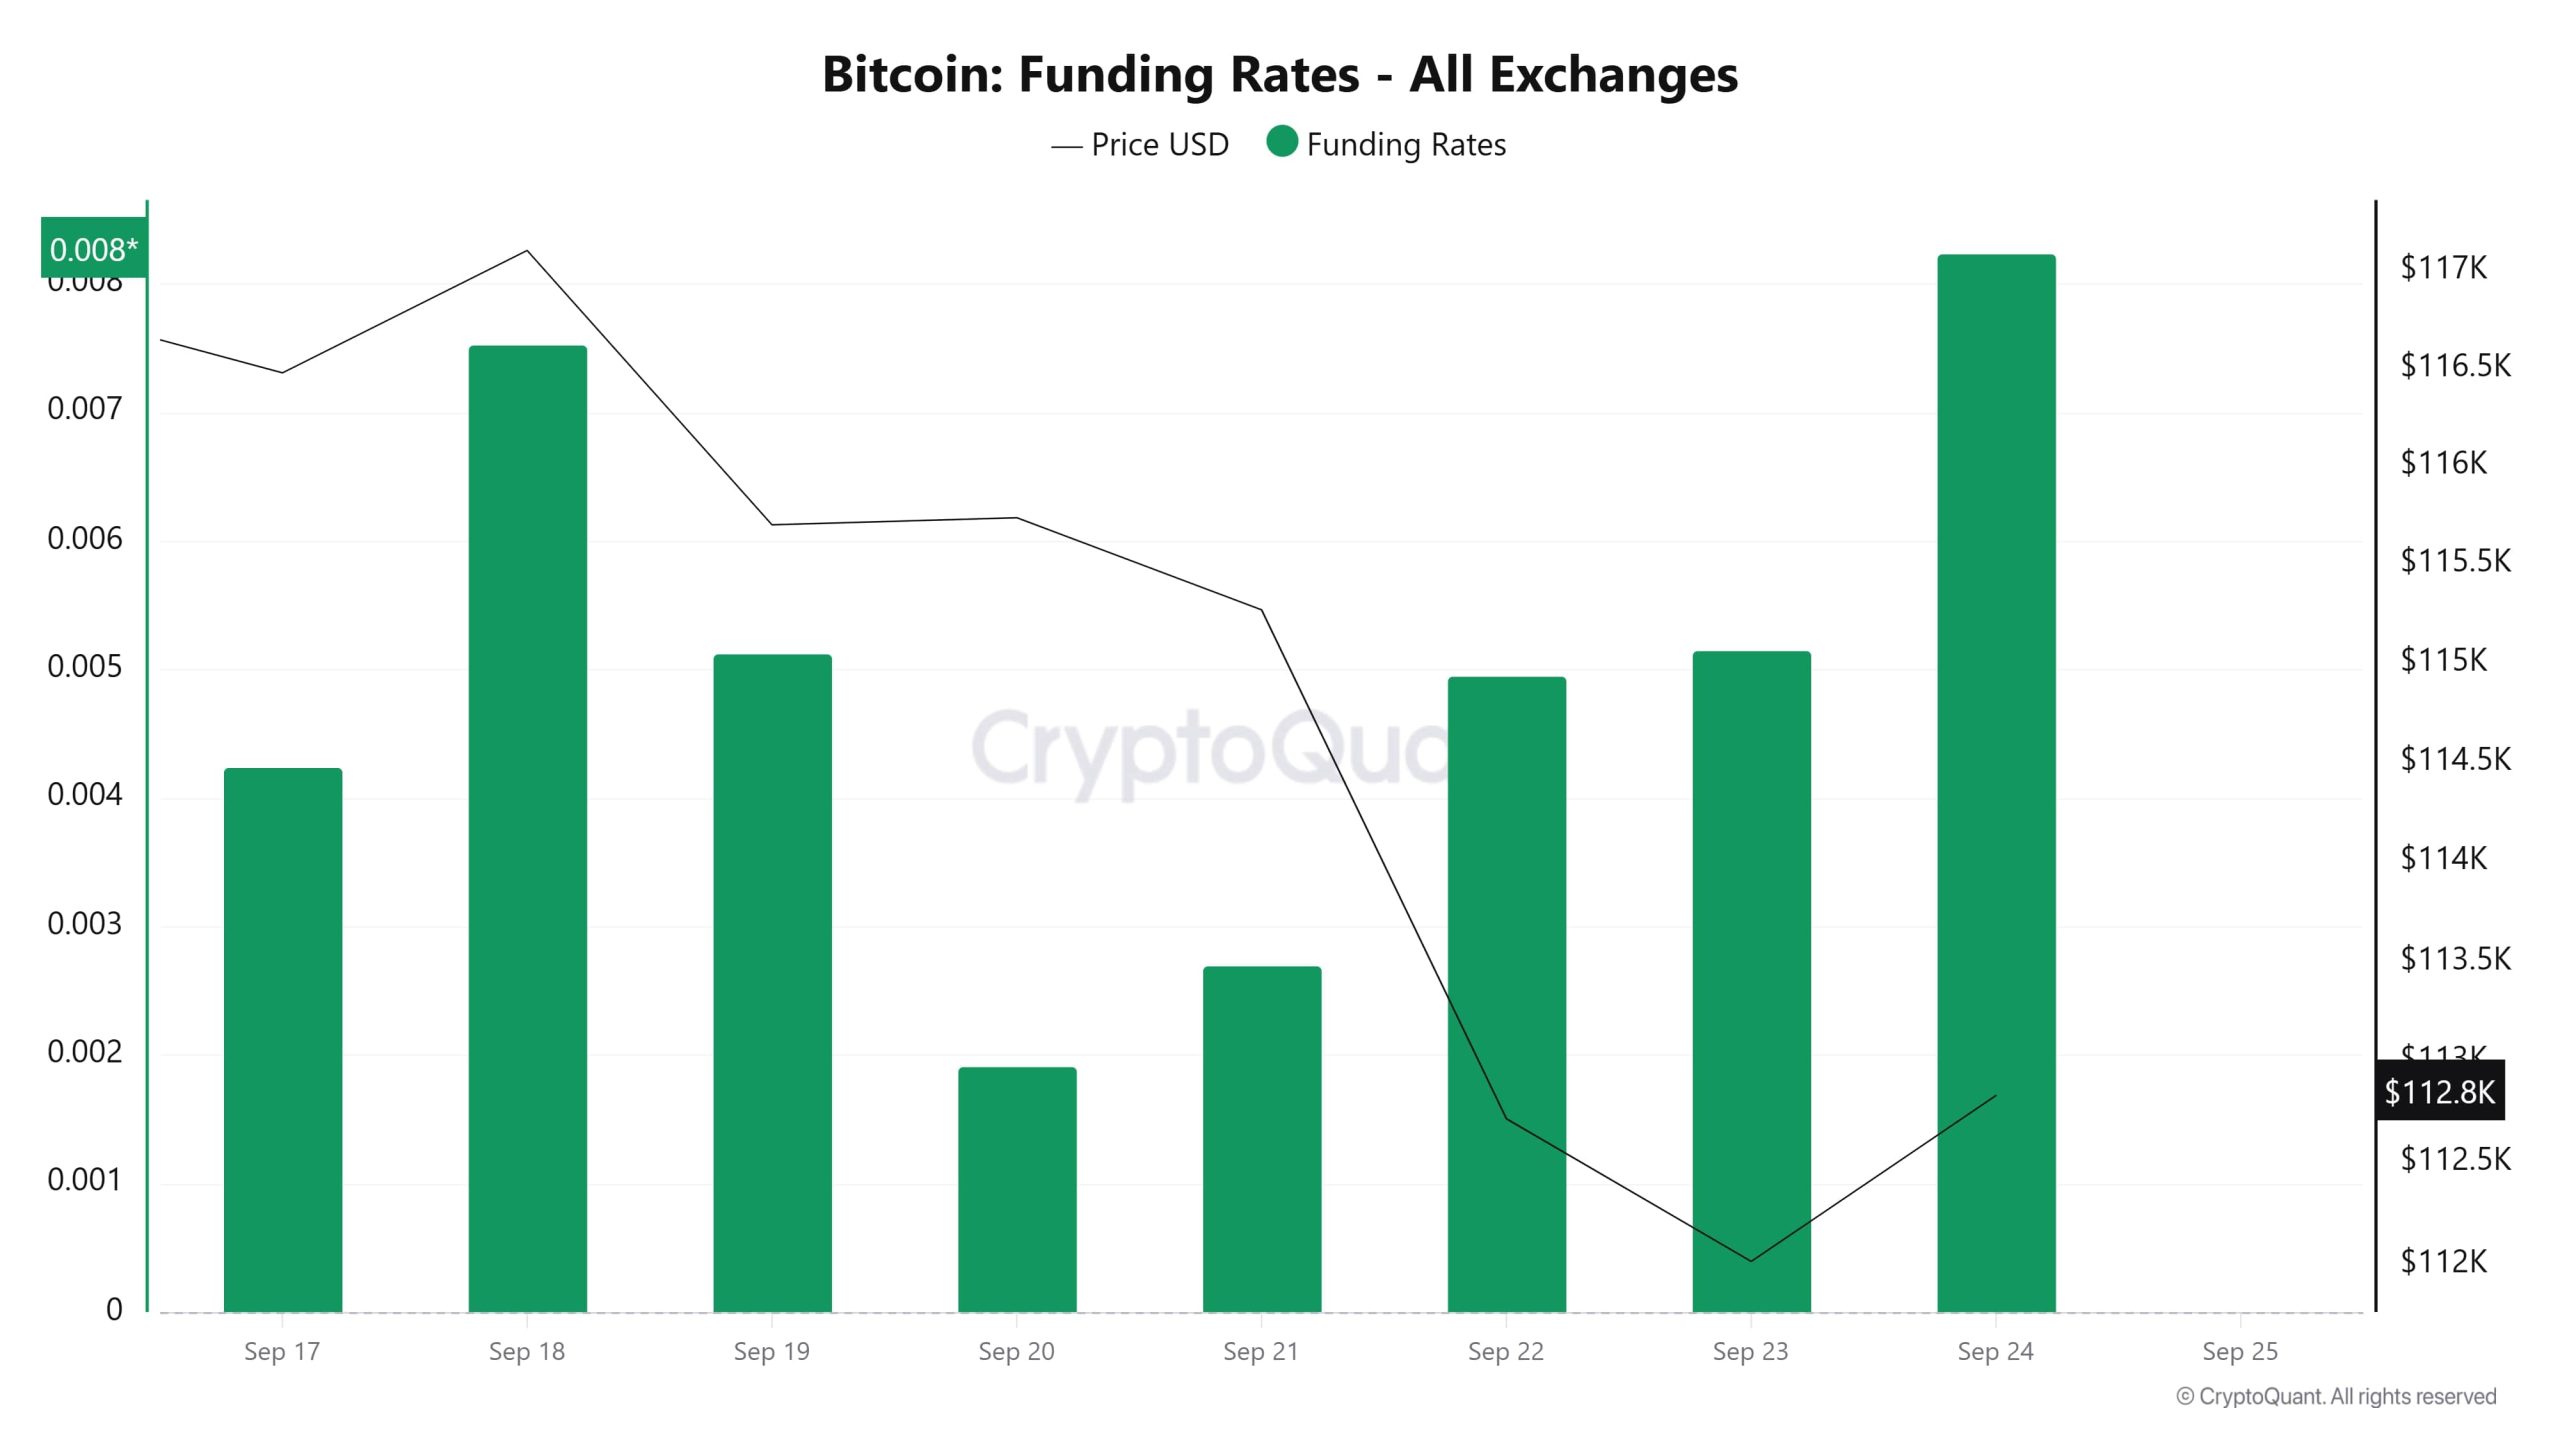
On September 17 and 18, funding rates remained high; the price remained above 116,000 during this period. From September 19 onwards, funding rates started to decline and the price started to decline in parallel. On September 22-23, the price fell as low as $112,000 while funding rates were near their lows, indicating that long positions were weakening. On September 24th, funding ratios rose significantly, while the price recovered towards the $112,800 level. The overall picture suggests that funding rates directly reflect market sentiment and fluctuate in line with price movements.
Long & Short Liquidations
With the BTC price falling from $117,800 to $111,000 last week, mainly long positions were liquidated. 503 million dollars of long and 122 million dollars of short trades were liquidated.
| Date | Long Amount (Million $) | Short Amount (Million $) |
|---|---|---|
| September 17 | 59.66 | 22.06 |
| September 18 | 7.05 | 66.17 |
| September 19 | 77.82 | 0.98 |
| September 20 | 1.54 | 2.08 |
| September 21 | 12.68 | 1.63 |
| September 22 | 312.28 | 23.39 |
| September 23 | 32.09 | 6.13 |
| Total | 503.12 | 122.44 |
Supply Distribution
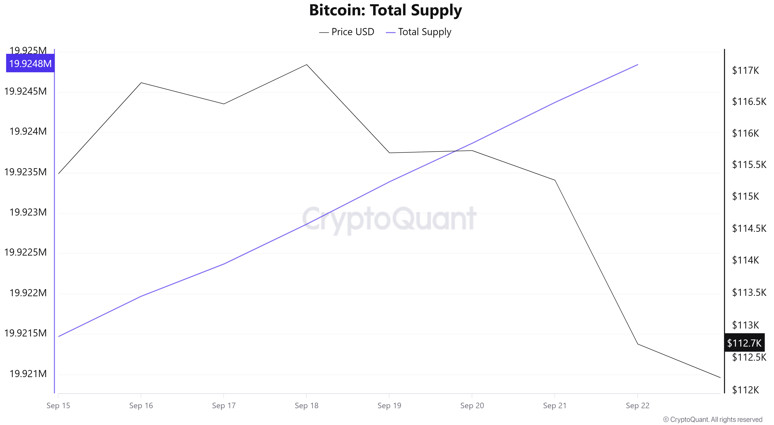
Total Supply: 19,924,839 units, up about 0.0169% from last week.
New Supply: The amount of BTC produced this week was 3,372.
Velocity: Velocity, which was 12.16 last week, was 12.11 as of September 22.
| Wallet Category | 15.09.2025 | 22.09.2025 | Change (%) |
|---|---|---|---|
| < 1 BTC | 8.4677% | 8.4531% | -0.172% |
| 1 – 10 BTC | 11.3856% | 11.3922% | 0.058% |
| 10 – 100 BTC | 24.5960% | 24.5533% | -0.174% |
| 100 – 1k BTC | 29.8515% | 29.9313% | 0.267% |
| 1k – 10k BTC | 17.8859% | 17.7431% | -0.798% |
| 10k+ BTC | 7.8132% | 7.9259% | 1.442% |
According to the latest weekly data, Bitcoin wallet distribution presented a mixed picture. The share of wallets holding <1 BTC decreased from 8.4677% to 8.4531%, a decrease of about 0.17%. The 1-10 BTC range increased slightly from 11.3856% to 11.3922%, up about 0.06%. In the 10-100 BTC group, the share decreased from 24.5960% to 24.5533%, a decrease of about 0.17%. In the 100-1,000 BTC range, it increased from 29.8515% to 29.9313%, an increase of about 0.27%. The 1,000-10,000 BTC band decreased from 17.8859% to 17.7431%, a decrease of about 0.80%. The share of 10,000+ BTC wallets representing the largest investors increased from 7.8132% to 7.9259%, representing an increase of about 1.44%.
Exchange Supply Ratio
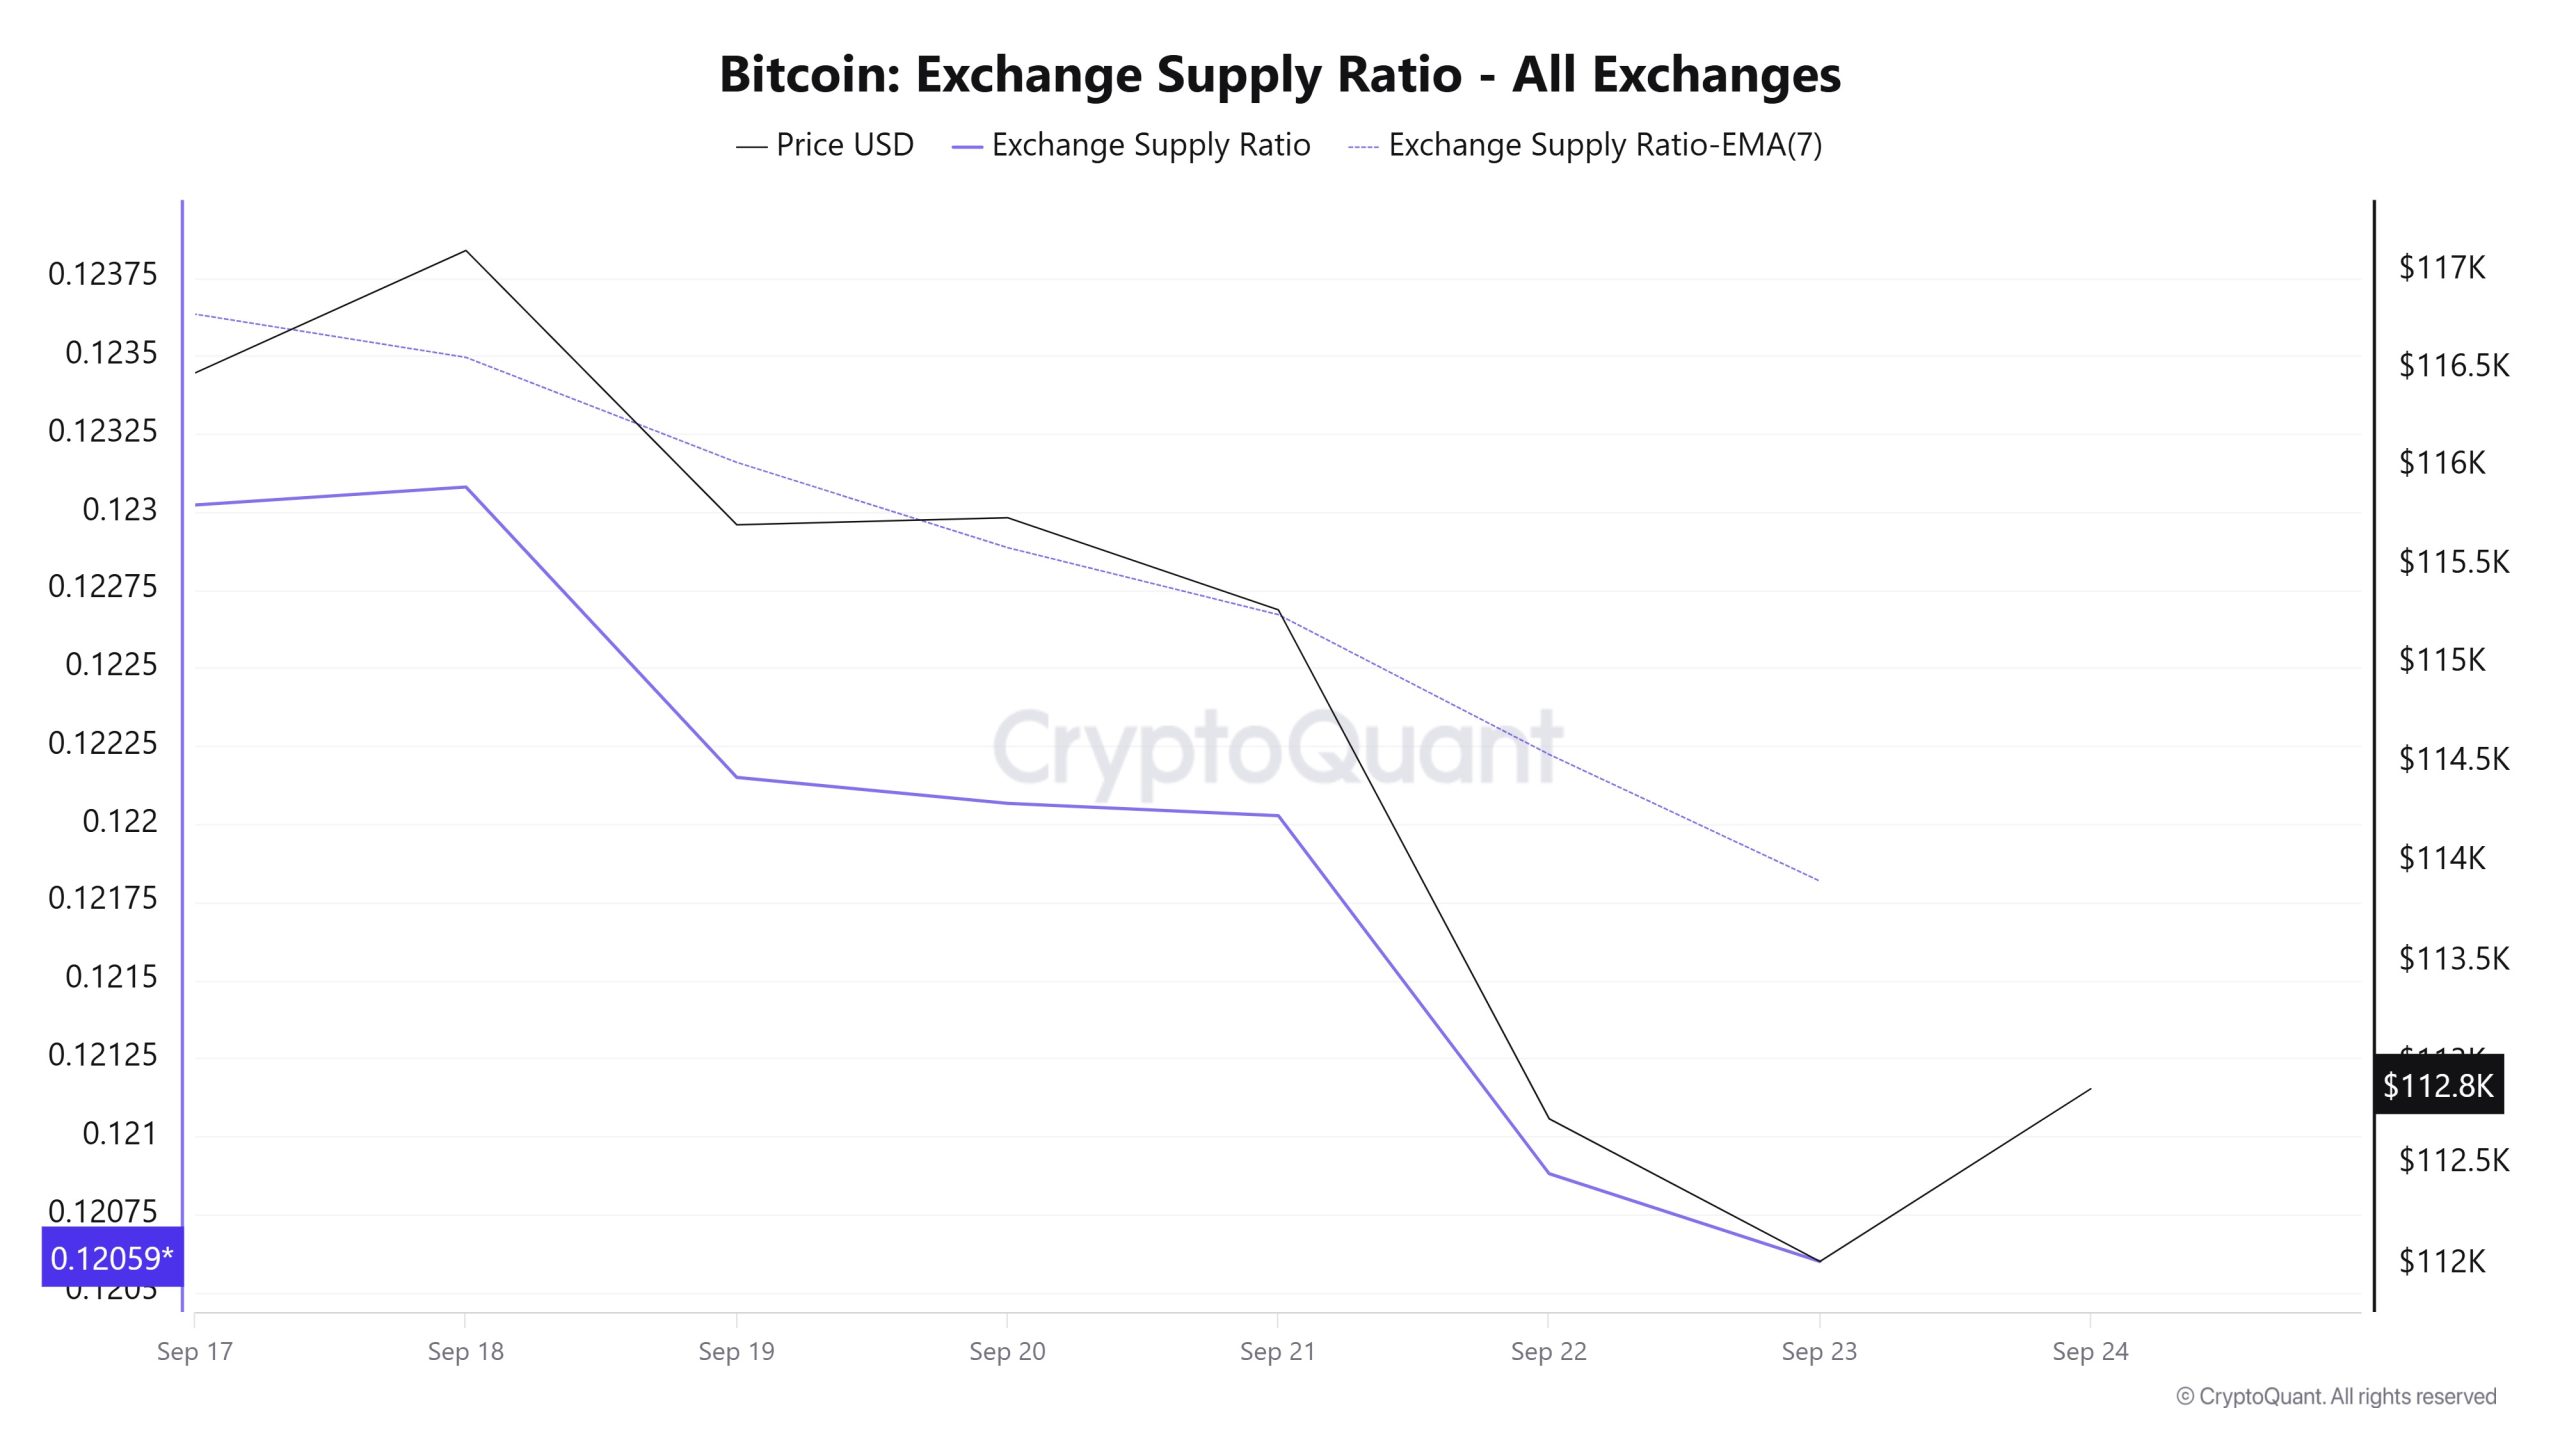
Data from the Bitcoin Exchange Supply Ratio table, which shows how much of Bitcoins are held on exchanges compared to the total supply of Bitcoins, showed high rates this week. This week’s data reveals that the general trend is for a positive correlation between the price of Bitcoin and the rate of supply entering exchanges, dominated by a positive correlation in these two variables. It shows that most Bitcoins continue to be held in wallets and are available for buying in the market.
Between September 17 and September 24, the Bitcoin Exchange Supply Ratio decreased from 0.12302204 to 0.12059854. During this period, the Bitcoin price dropped from $117,000 to $112,000. Especially this week, the two variables moved in the same direction, indicating that despite the price decline, the amount of Bitcoin supplied to exchanges has increased, possibly indicating that long-term investors continue to hold their assets. The Bitcoin price is generally neutral.
Exchange Reserve
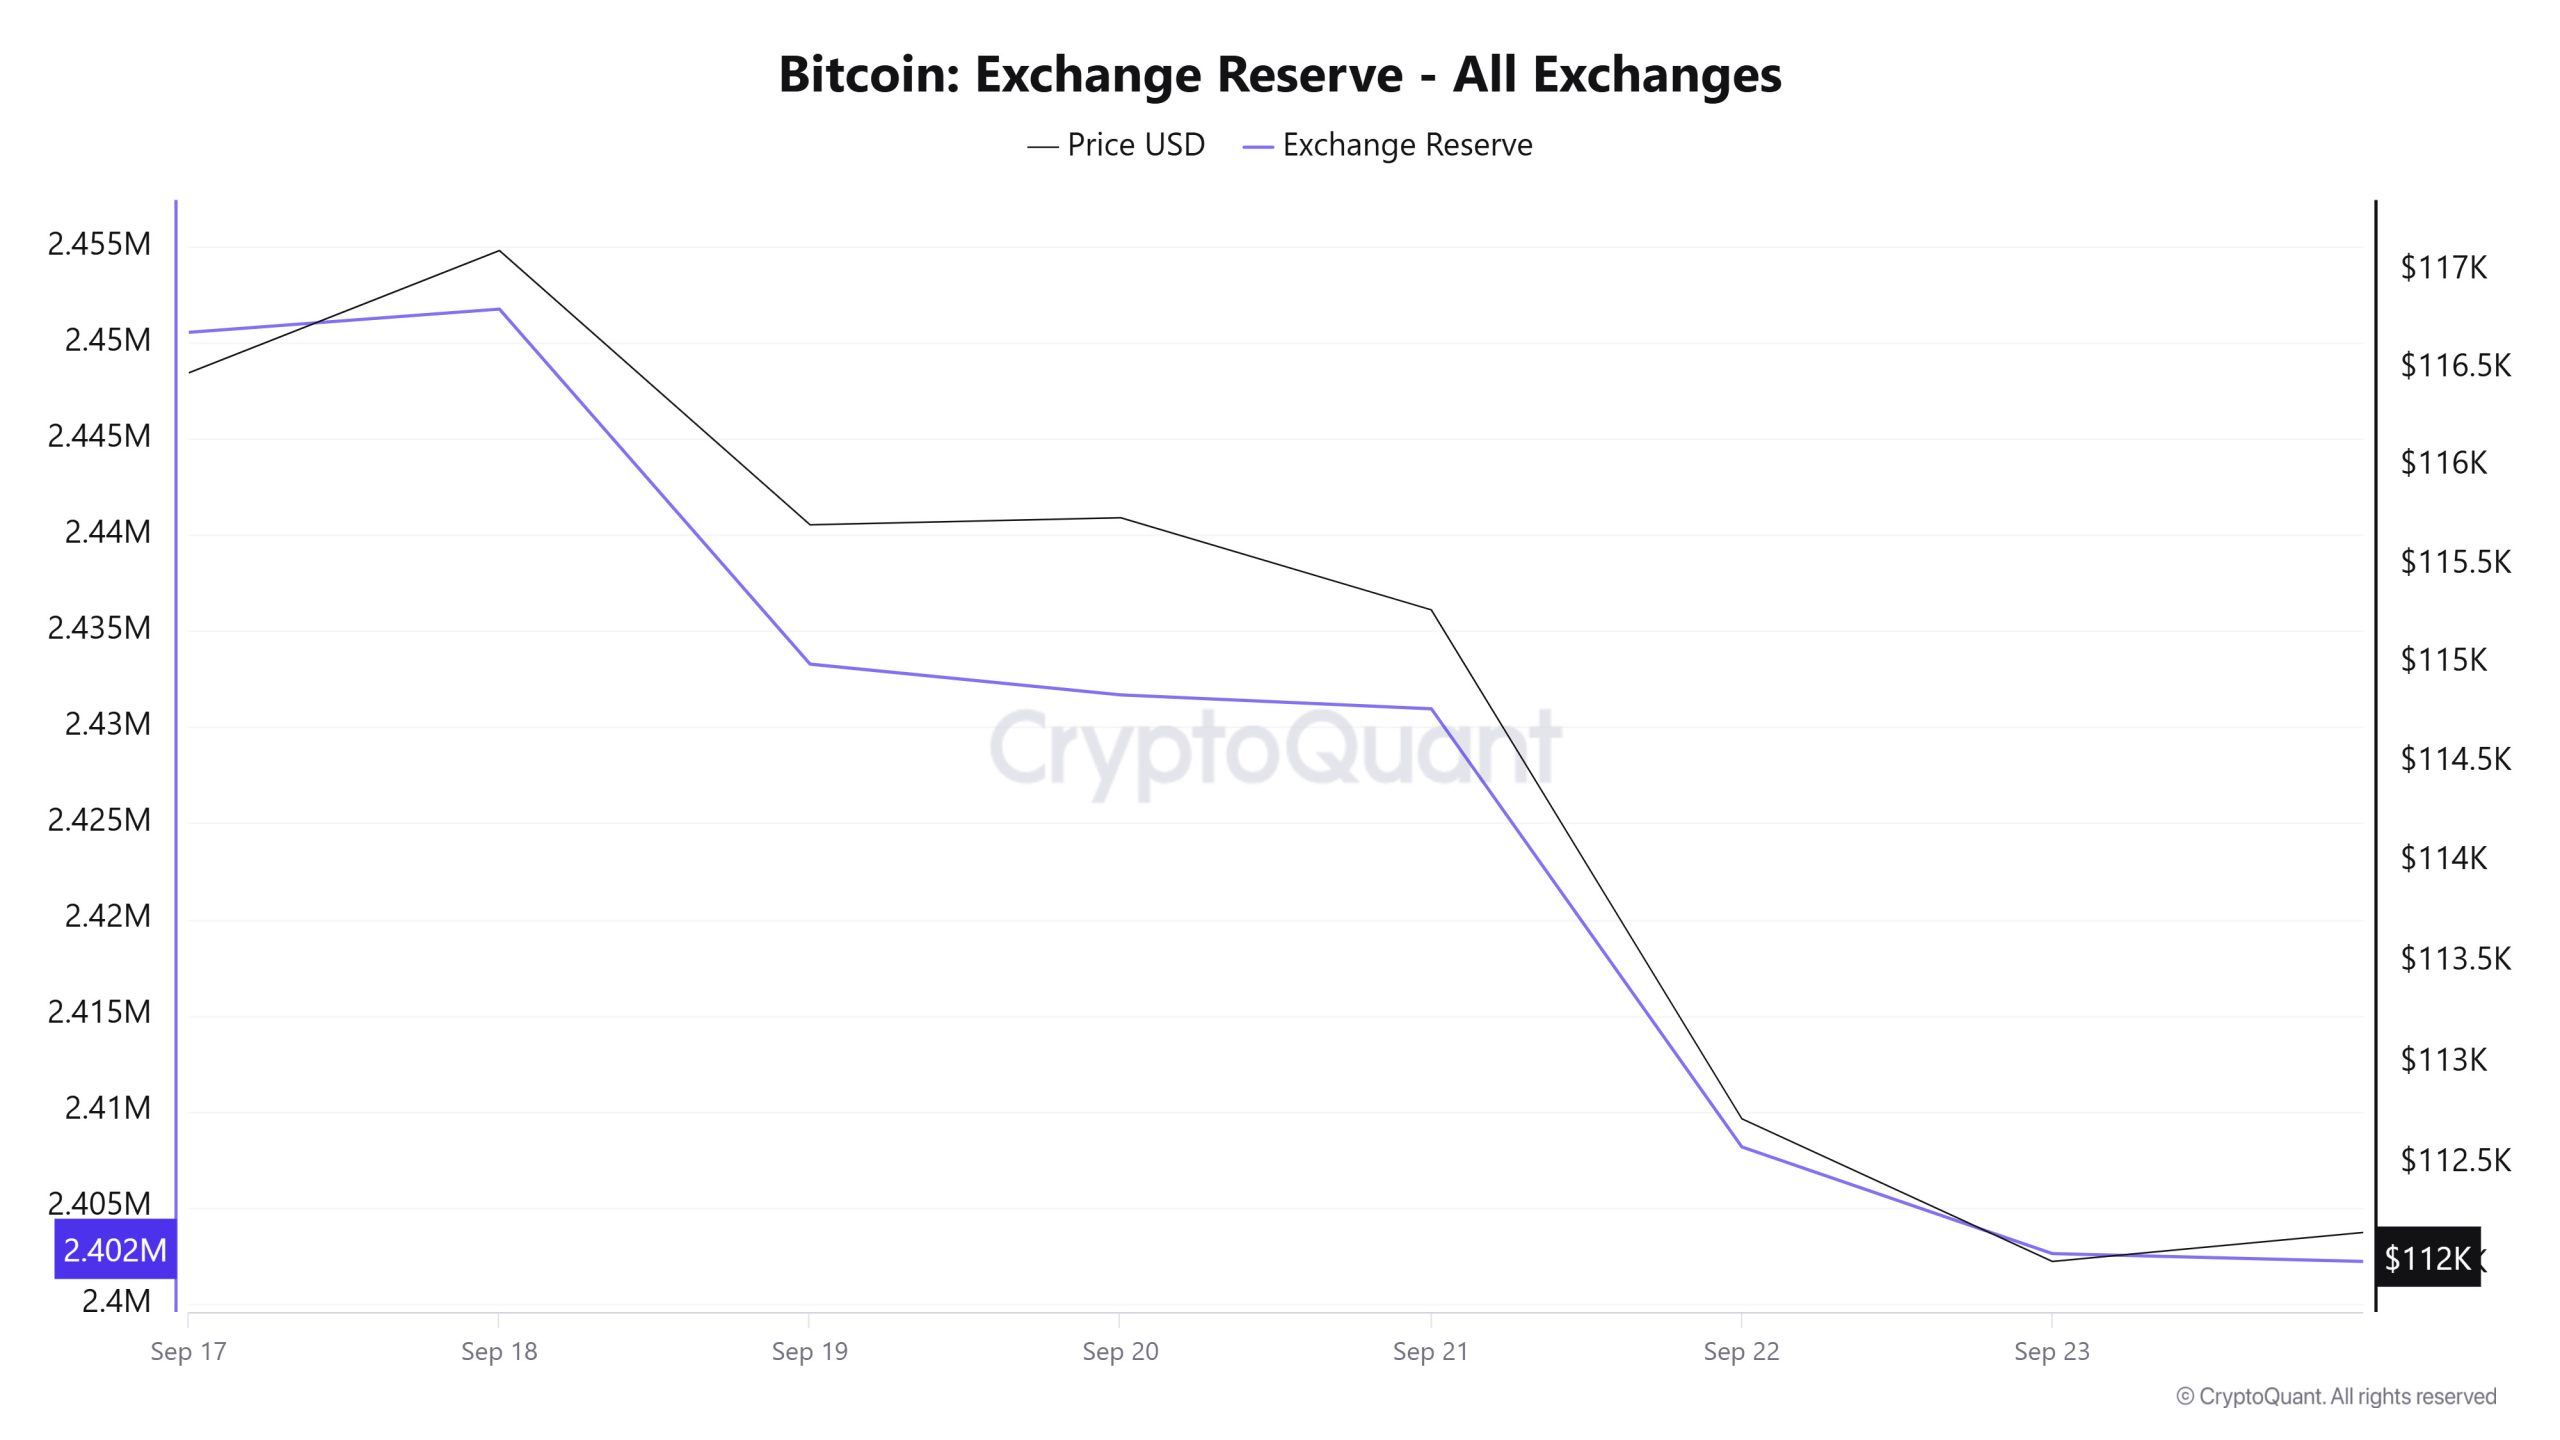
Between September 17-23, 2025, Bitcoin reserves on exchanges decreased from 2,450,537 BTC to 2,402,607 BTC, with a total net outflow of 47,929 BTC. In this process, there was a decrease of approximately 1.96% in reserves. In the same period, the BTC price fell from $116,824 to $112,014, depreciating by about 4.12%. The fact that reserves continued to decline as the price fell suggests that investors are more inclined to withdraw their assets from stock markets rather than sell. However, the strong selling pressure reveals that net outflows have limited impact on the price in this process.
| Date | Exchange Inflow | Exchange Outflow | Exchange Netflow | Exchange Reserve | BTC Price |
|---|---|---|---|---|---|
| 17-Sep | 29,934 | 34,186 | -4,252 | 2,450,537 | 116,824 |
| 18-Sep | 38,330 | 37,125 | 1,205 | 2,451,742 | 117,106 |
| 19-Sep | 21,703 | 40,171 | -18,468 | 2,433,274 | 115,702 |
| 20-Sep | 11,152 | 12,752 | -1,600 | 2,431,673 | 115,738 |
| 21-Sep | 12,090 | 12,813 | -722 | 2,430,951 | 115,270 |
| 22-Sep | 37,980 | 60,776 | -22,796 | 2,408,155 | 112,719 |
| 23-Sep | 31,396 | 36,944 | -5,547 | 2,402,607 | 112,014 |
Fees and Revenues
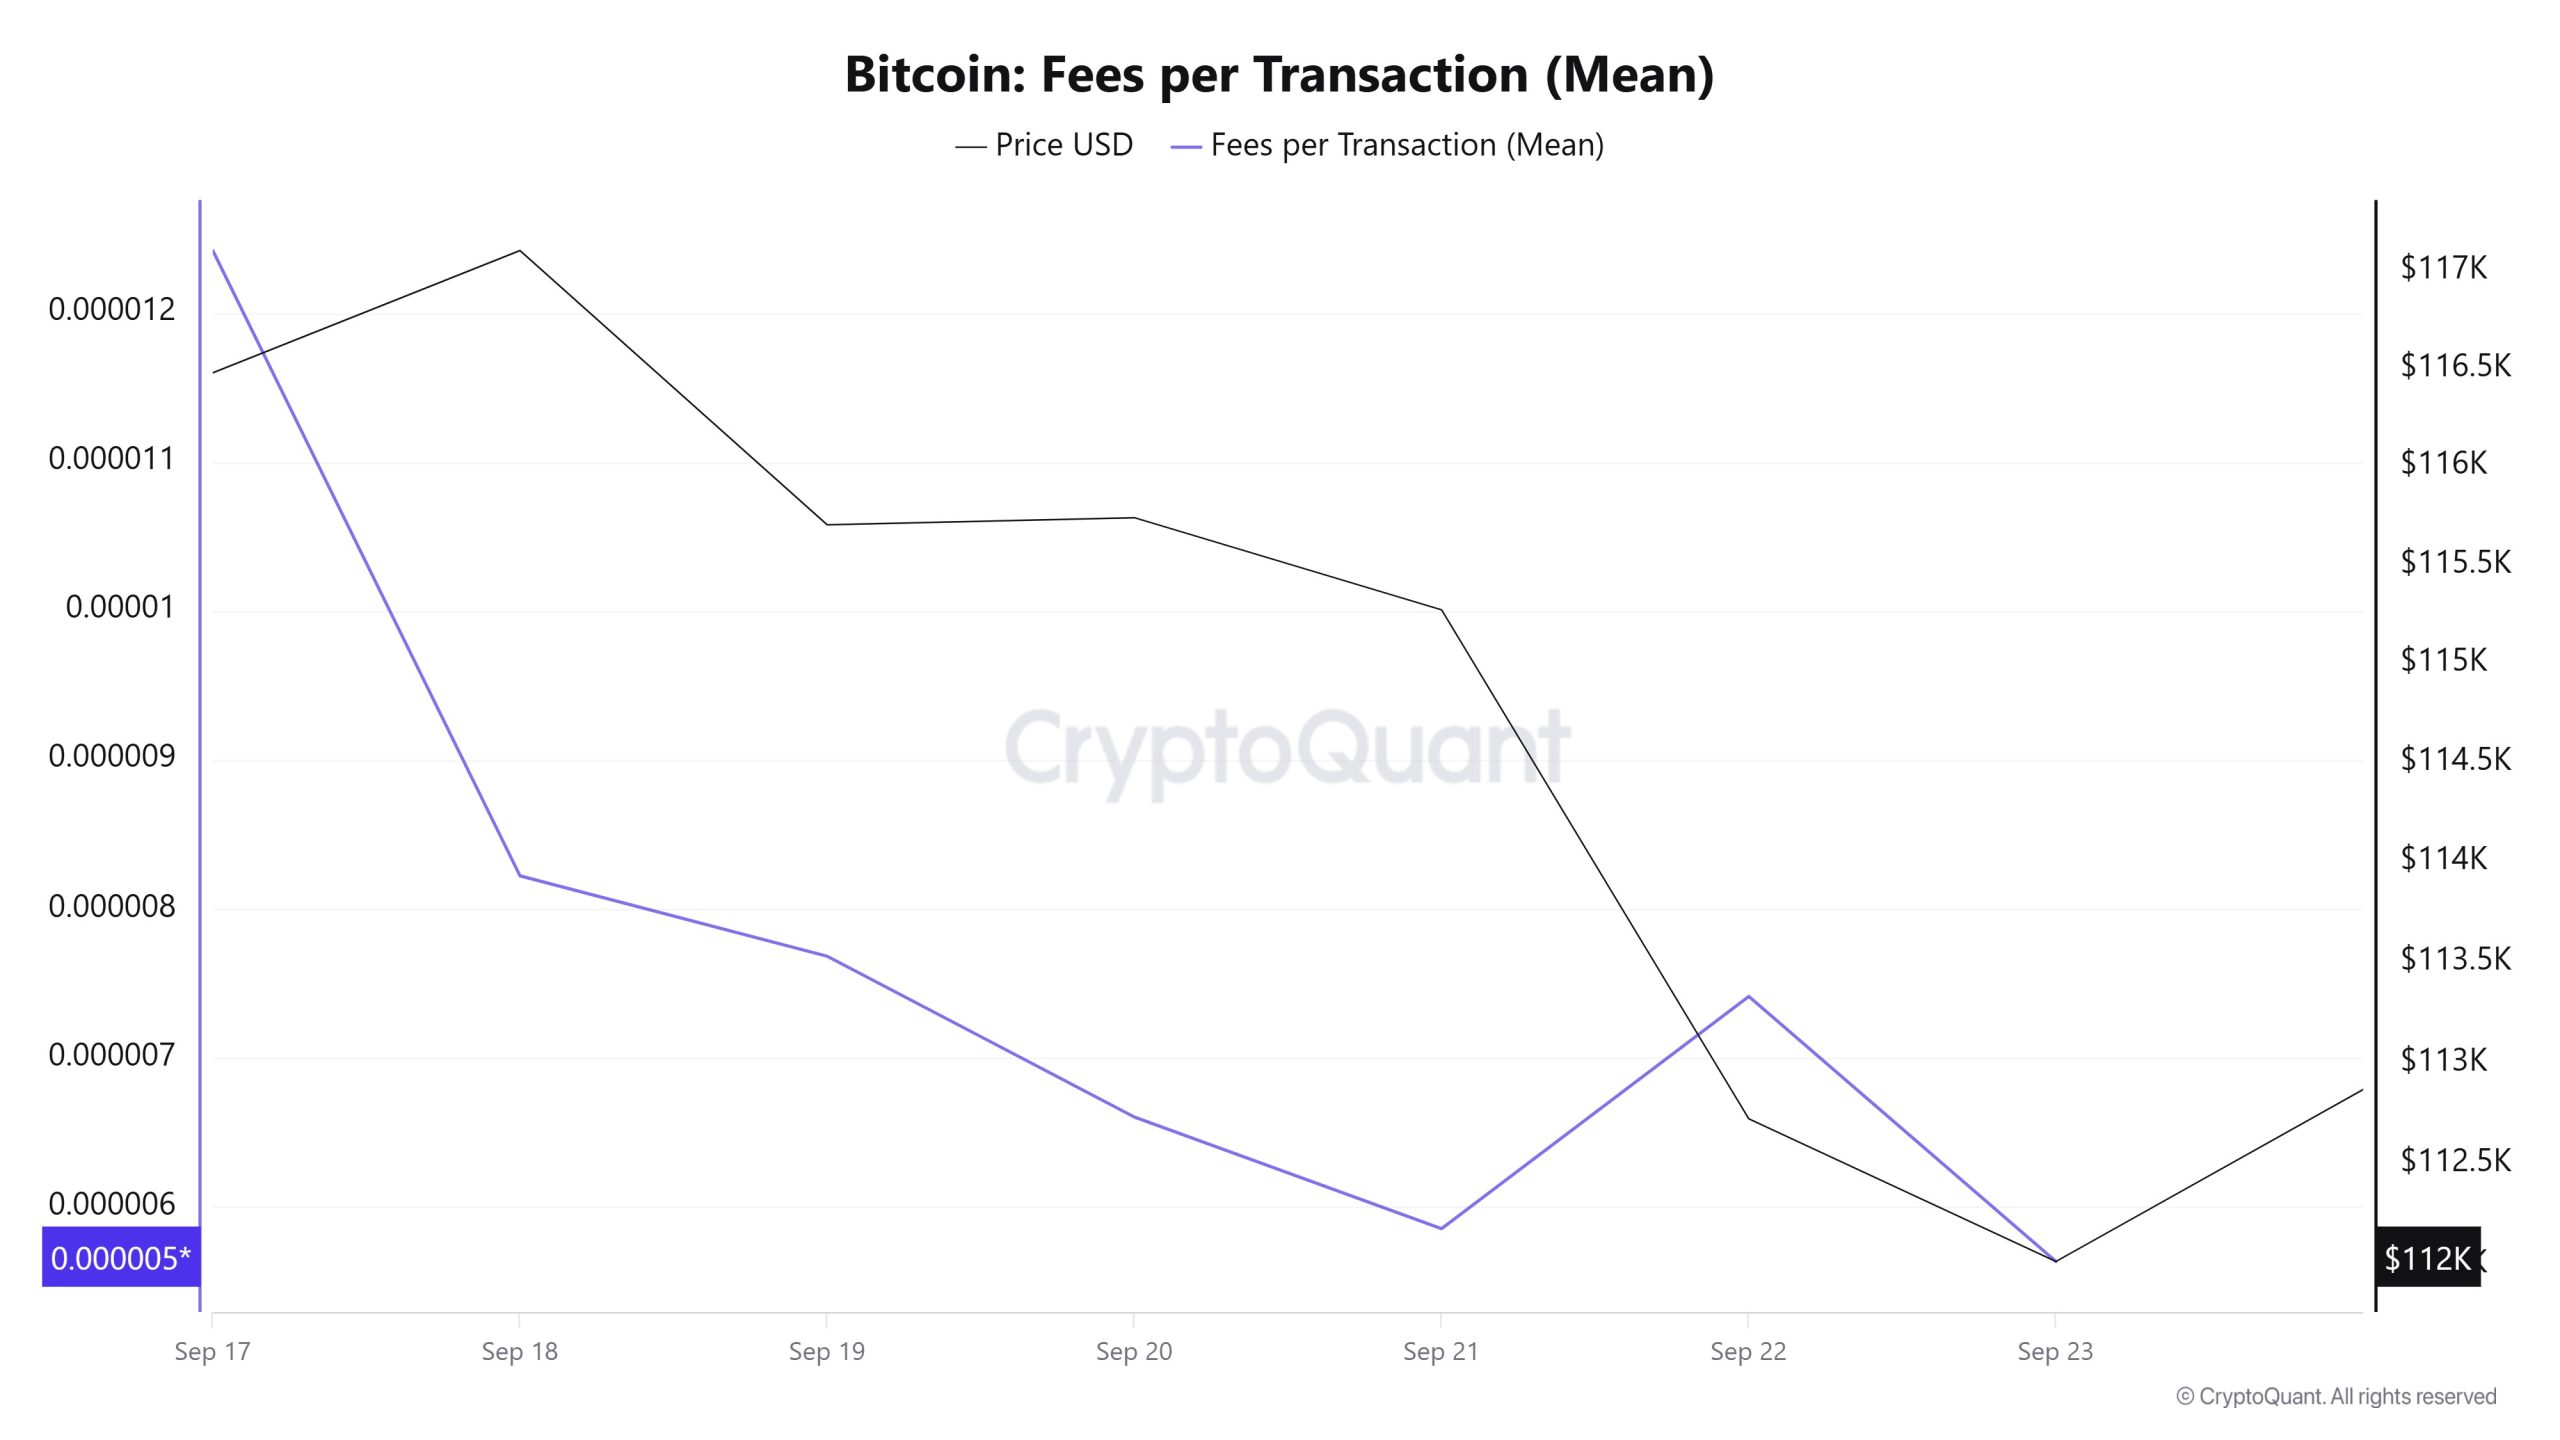
Analysing the Bitcoin Fees per Transaction (Mean) data between September 17 and 23, it is seen that the indicator was realized at 0.00001242 on September 17, the first day of the week.
As of September 17, the value in question, which reached its peak level, followed a fluctuating course after this date due to the volatility in Bitcoin price. On September 21, it fell to 0.00000585.
In the following days, the Bitcoin Fees per Transaction (Mean) indicator resumed an upward trend, but closed at 0.00000563 on September 23, the last day of the week .
Bitcoin: Fees (Total)
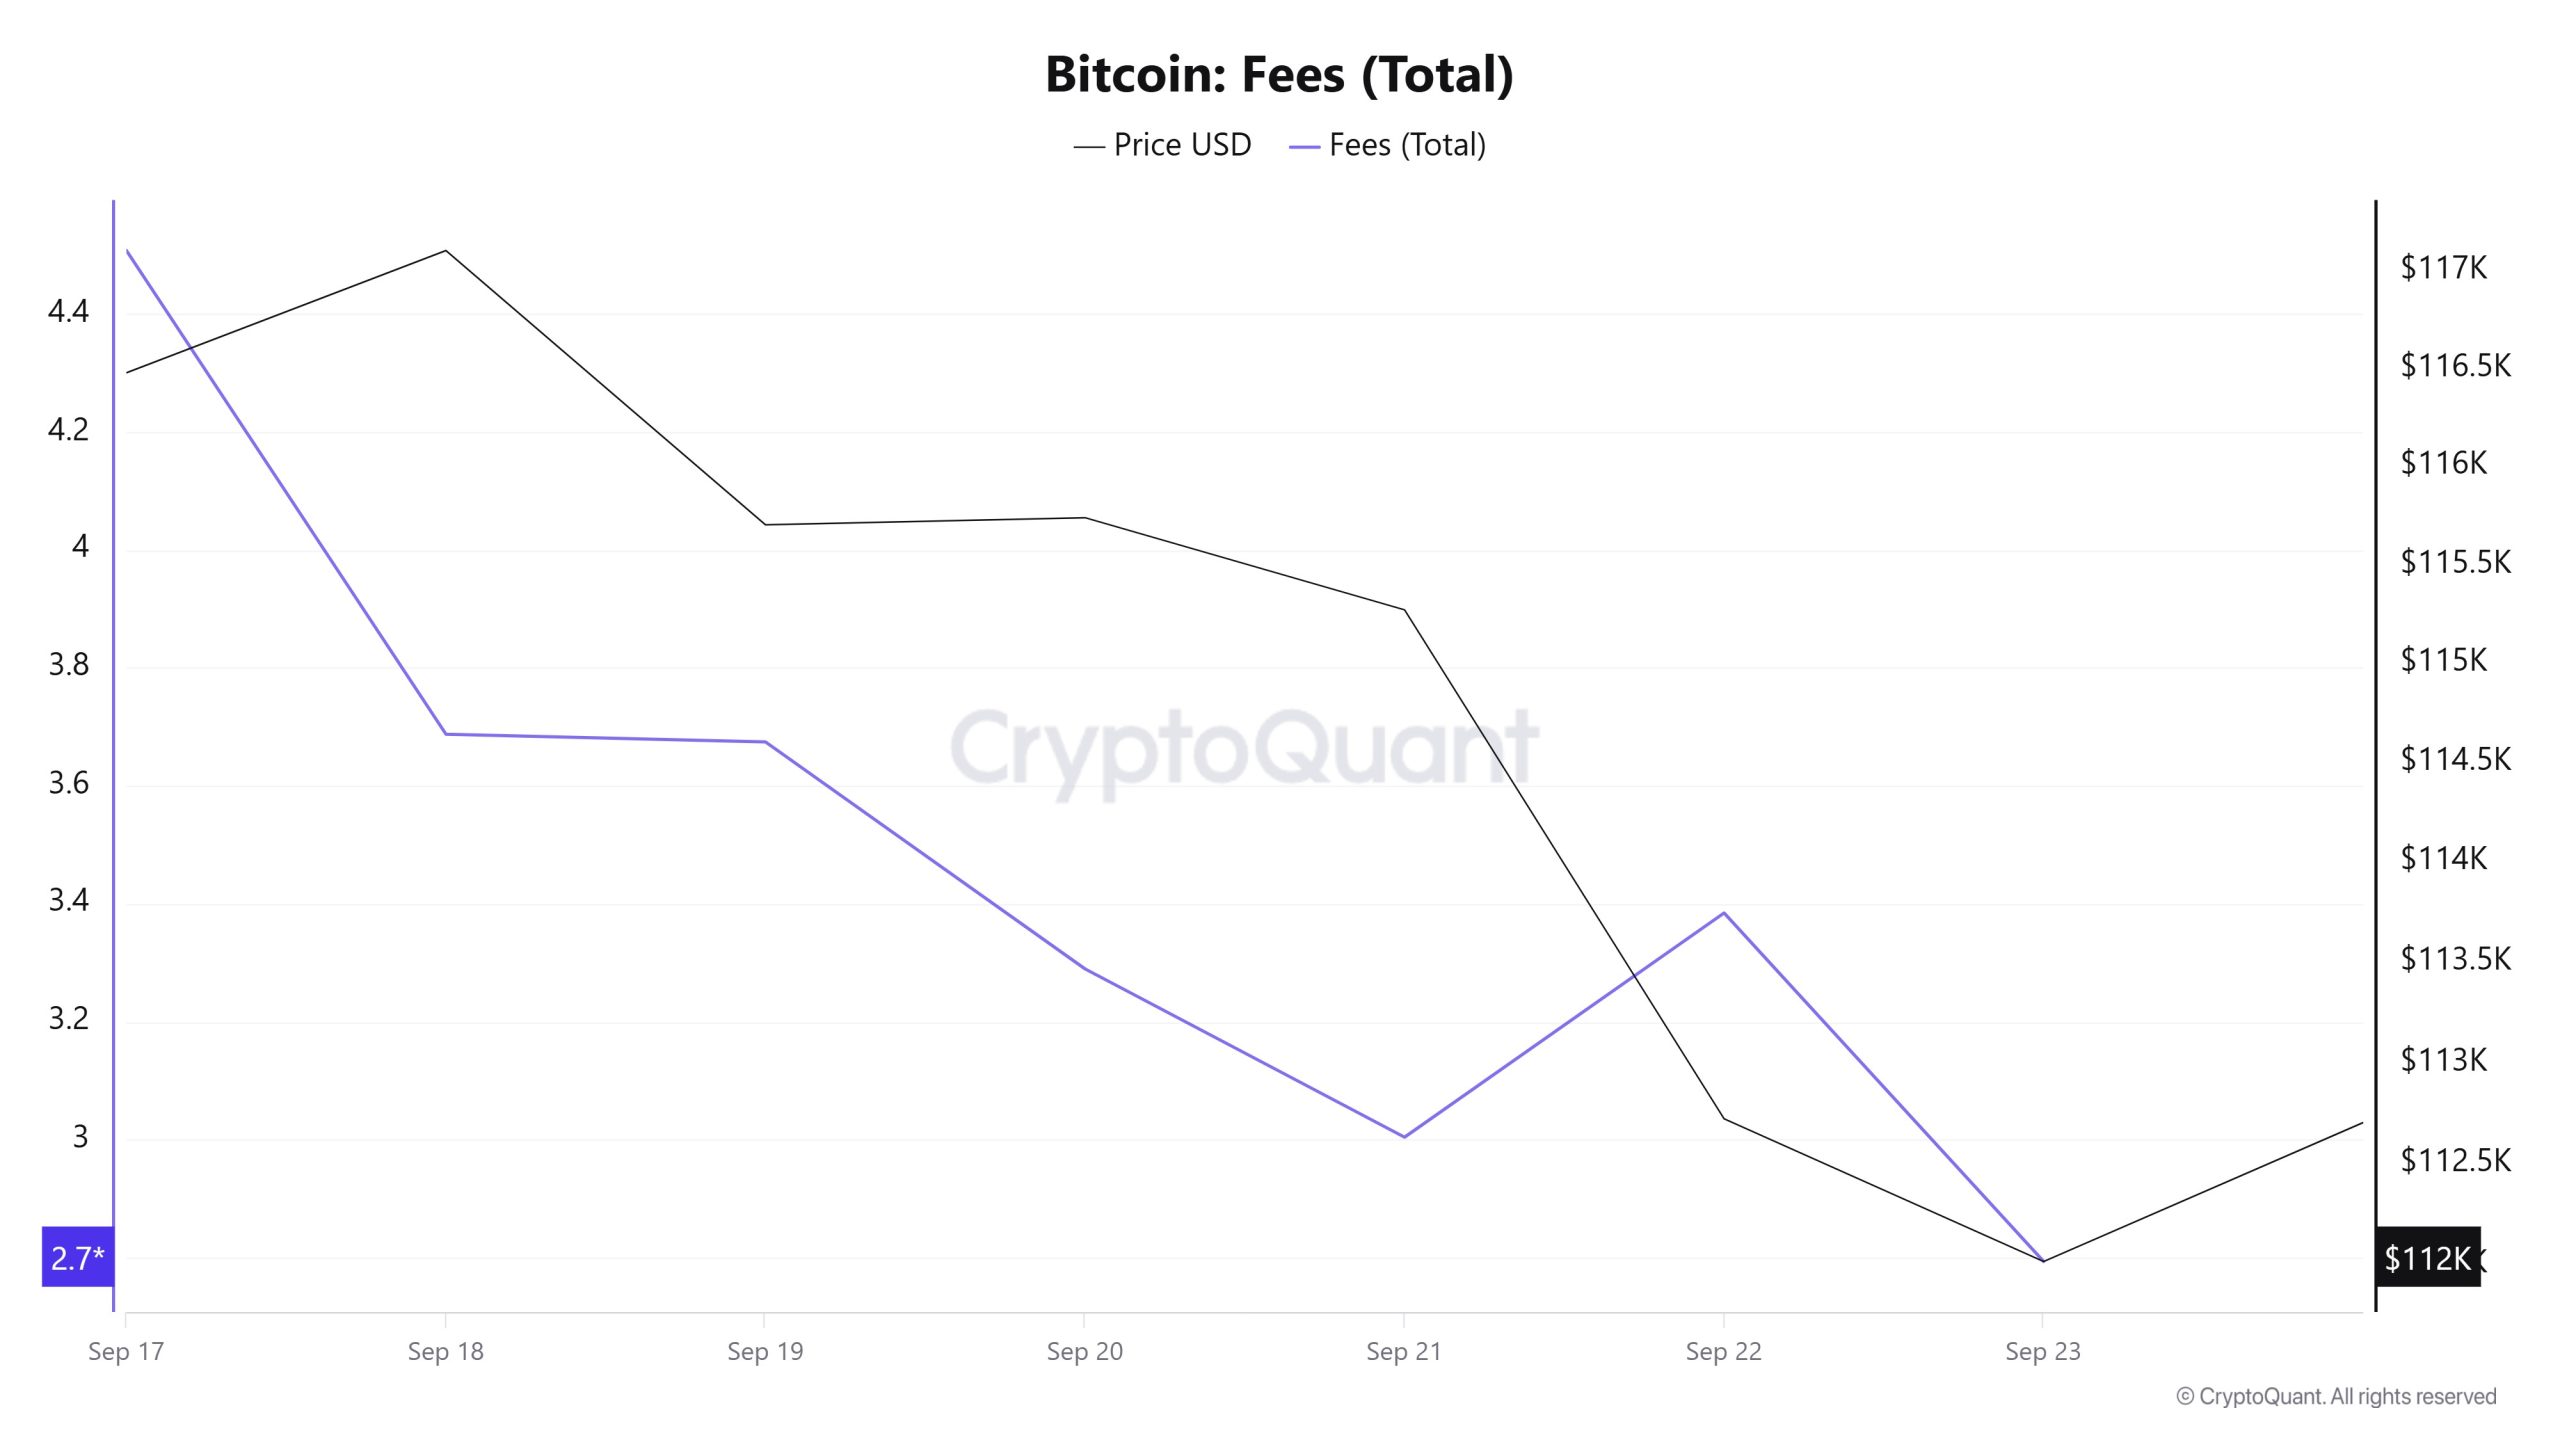
Similarly, when Bitcoin Fees (Total) data between September 17 and 23 are analyzed, it is seen that the indicator was at 4.50749412 on September 17, the first day of the week.
As of September 17, the value peaked, but fluctuated after this date due to the volatility in Bitcoin price. On September 21, it fell to 3.00402984.
In the following days, the Bitcoin Fees (Total) indicator resumed an upward trend, but closed at 2.79331599 on September 23, the last day of the week.
Miner Flows
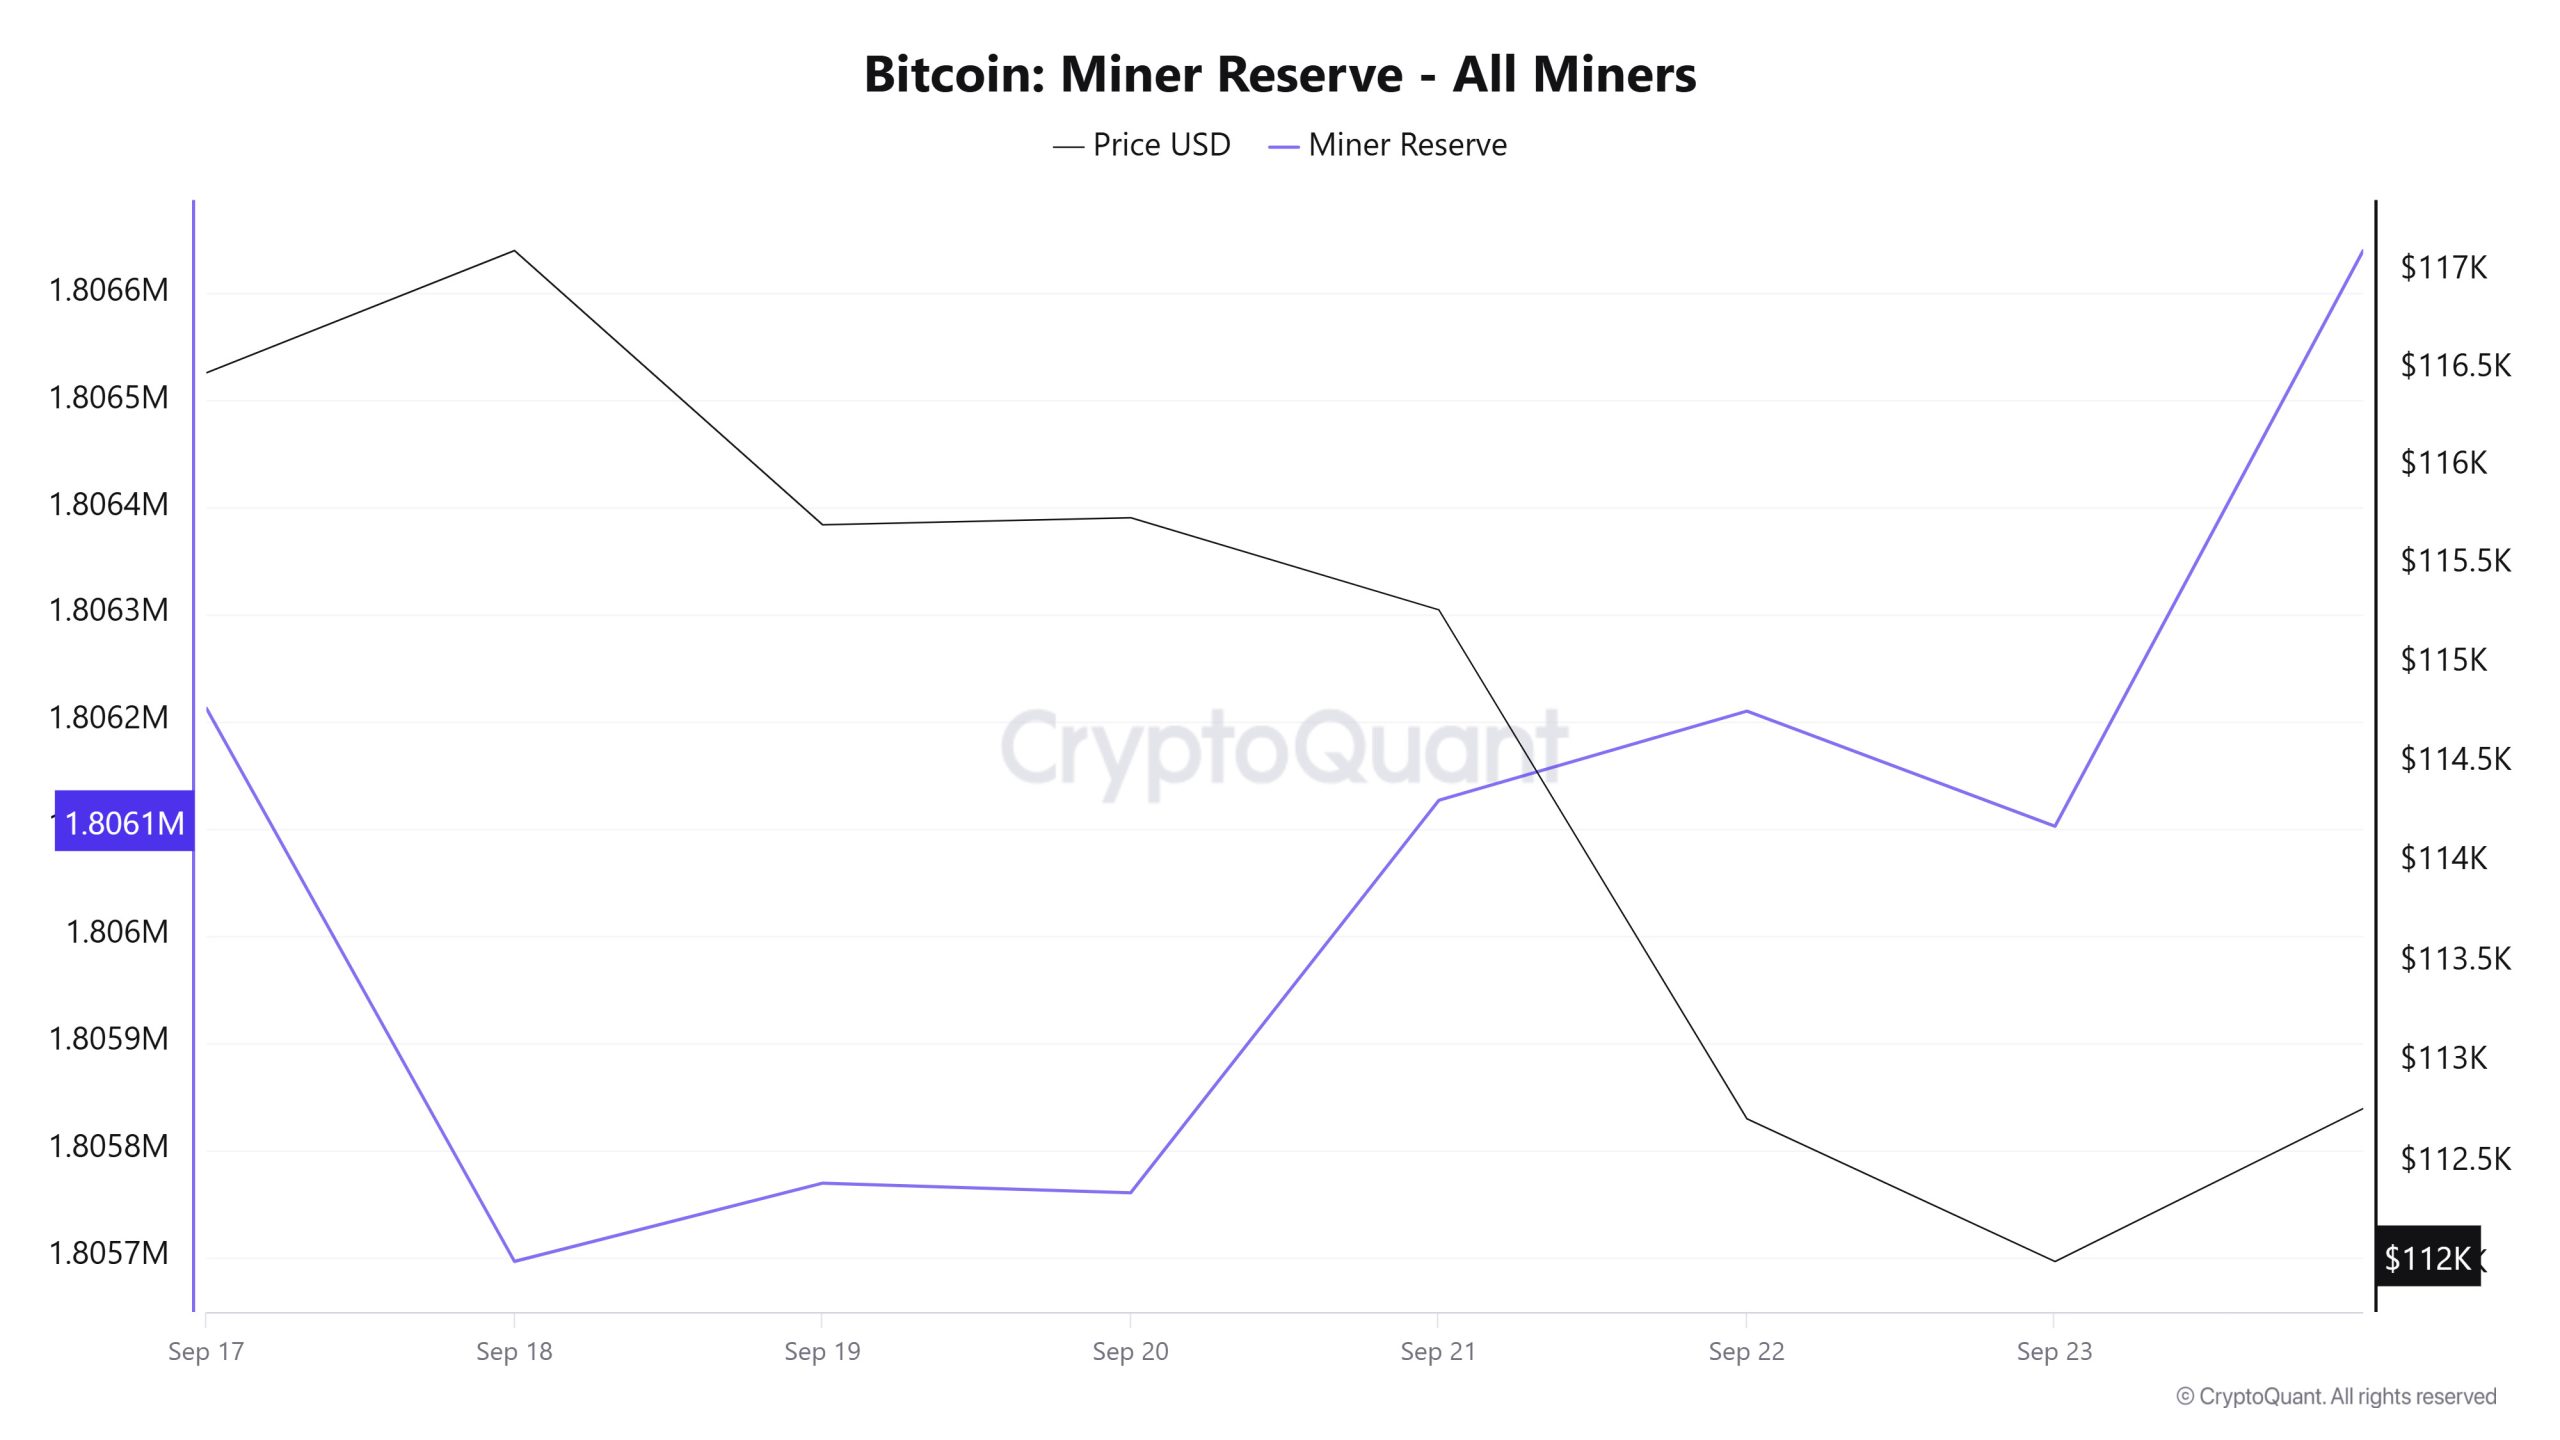
According to the data obtained from the Miner Reserve table, there has been a slight increase in Bitcoin reserves held in miners’ wallets this week. There is a negative correlation between Bitcoin price and Miner Reserve in the time period analyzed.
Miner Inflow, Outflow and Netflow
Between September 17th and 23rd, 34,693 Bitcoins were outflowed from miners’ wallets and 34,832 Bitcoins were inflowed into miners’ wallets between the same dates. The Miner Netflow for this week was 139 Bitcoin. Meanwhile, the Bitcoin price was $116,478 on September 17 and $112,013 on September 23.
For the week, the net flow (Miner Netflow) was positive as Bitcoin inflow into miner wallets (Miner Inflow) was higher than Bitcoin outflow from miner wallets (Miner Outflow).
| Date | Miner Inflow | Miner Outflow | Miner Netflow |
|---|---|---|---|
| Sep. 17 | 4,876.96 | 4,628.25 | 248.71 |
| Sep. 18 | 5,293.21 | 5,809.78 | -516.56 |
| Sep. 19 | 5,370.99 | 5,297.87 | 73.12 |
| Sep. 20 | 2,006.80 | 2,015.75 | -8.95 |
| Sep. 21 | 3,113.40 | 2,746.89 | 366.50 |
| Sep. 22 | 7,027.46 | 6,944.20 | 83.26 |
| Sep. 23 | 7,143.26 | 7,250.80 | -107.54 |
Transaction
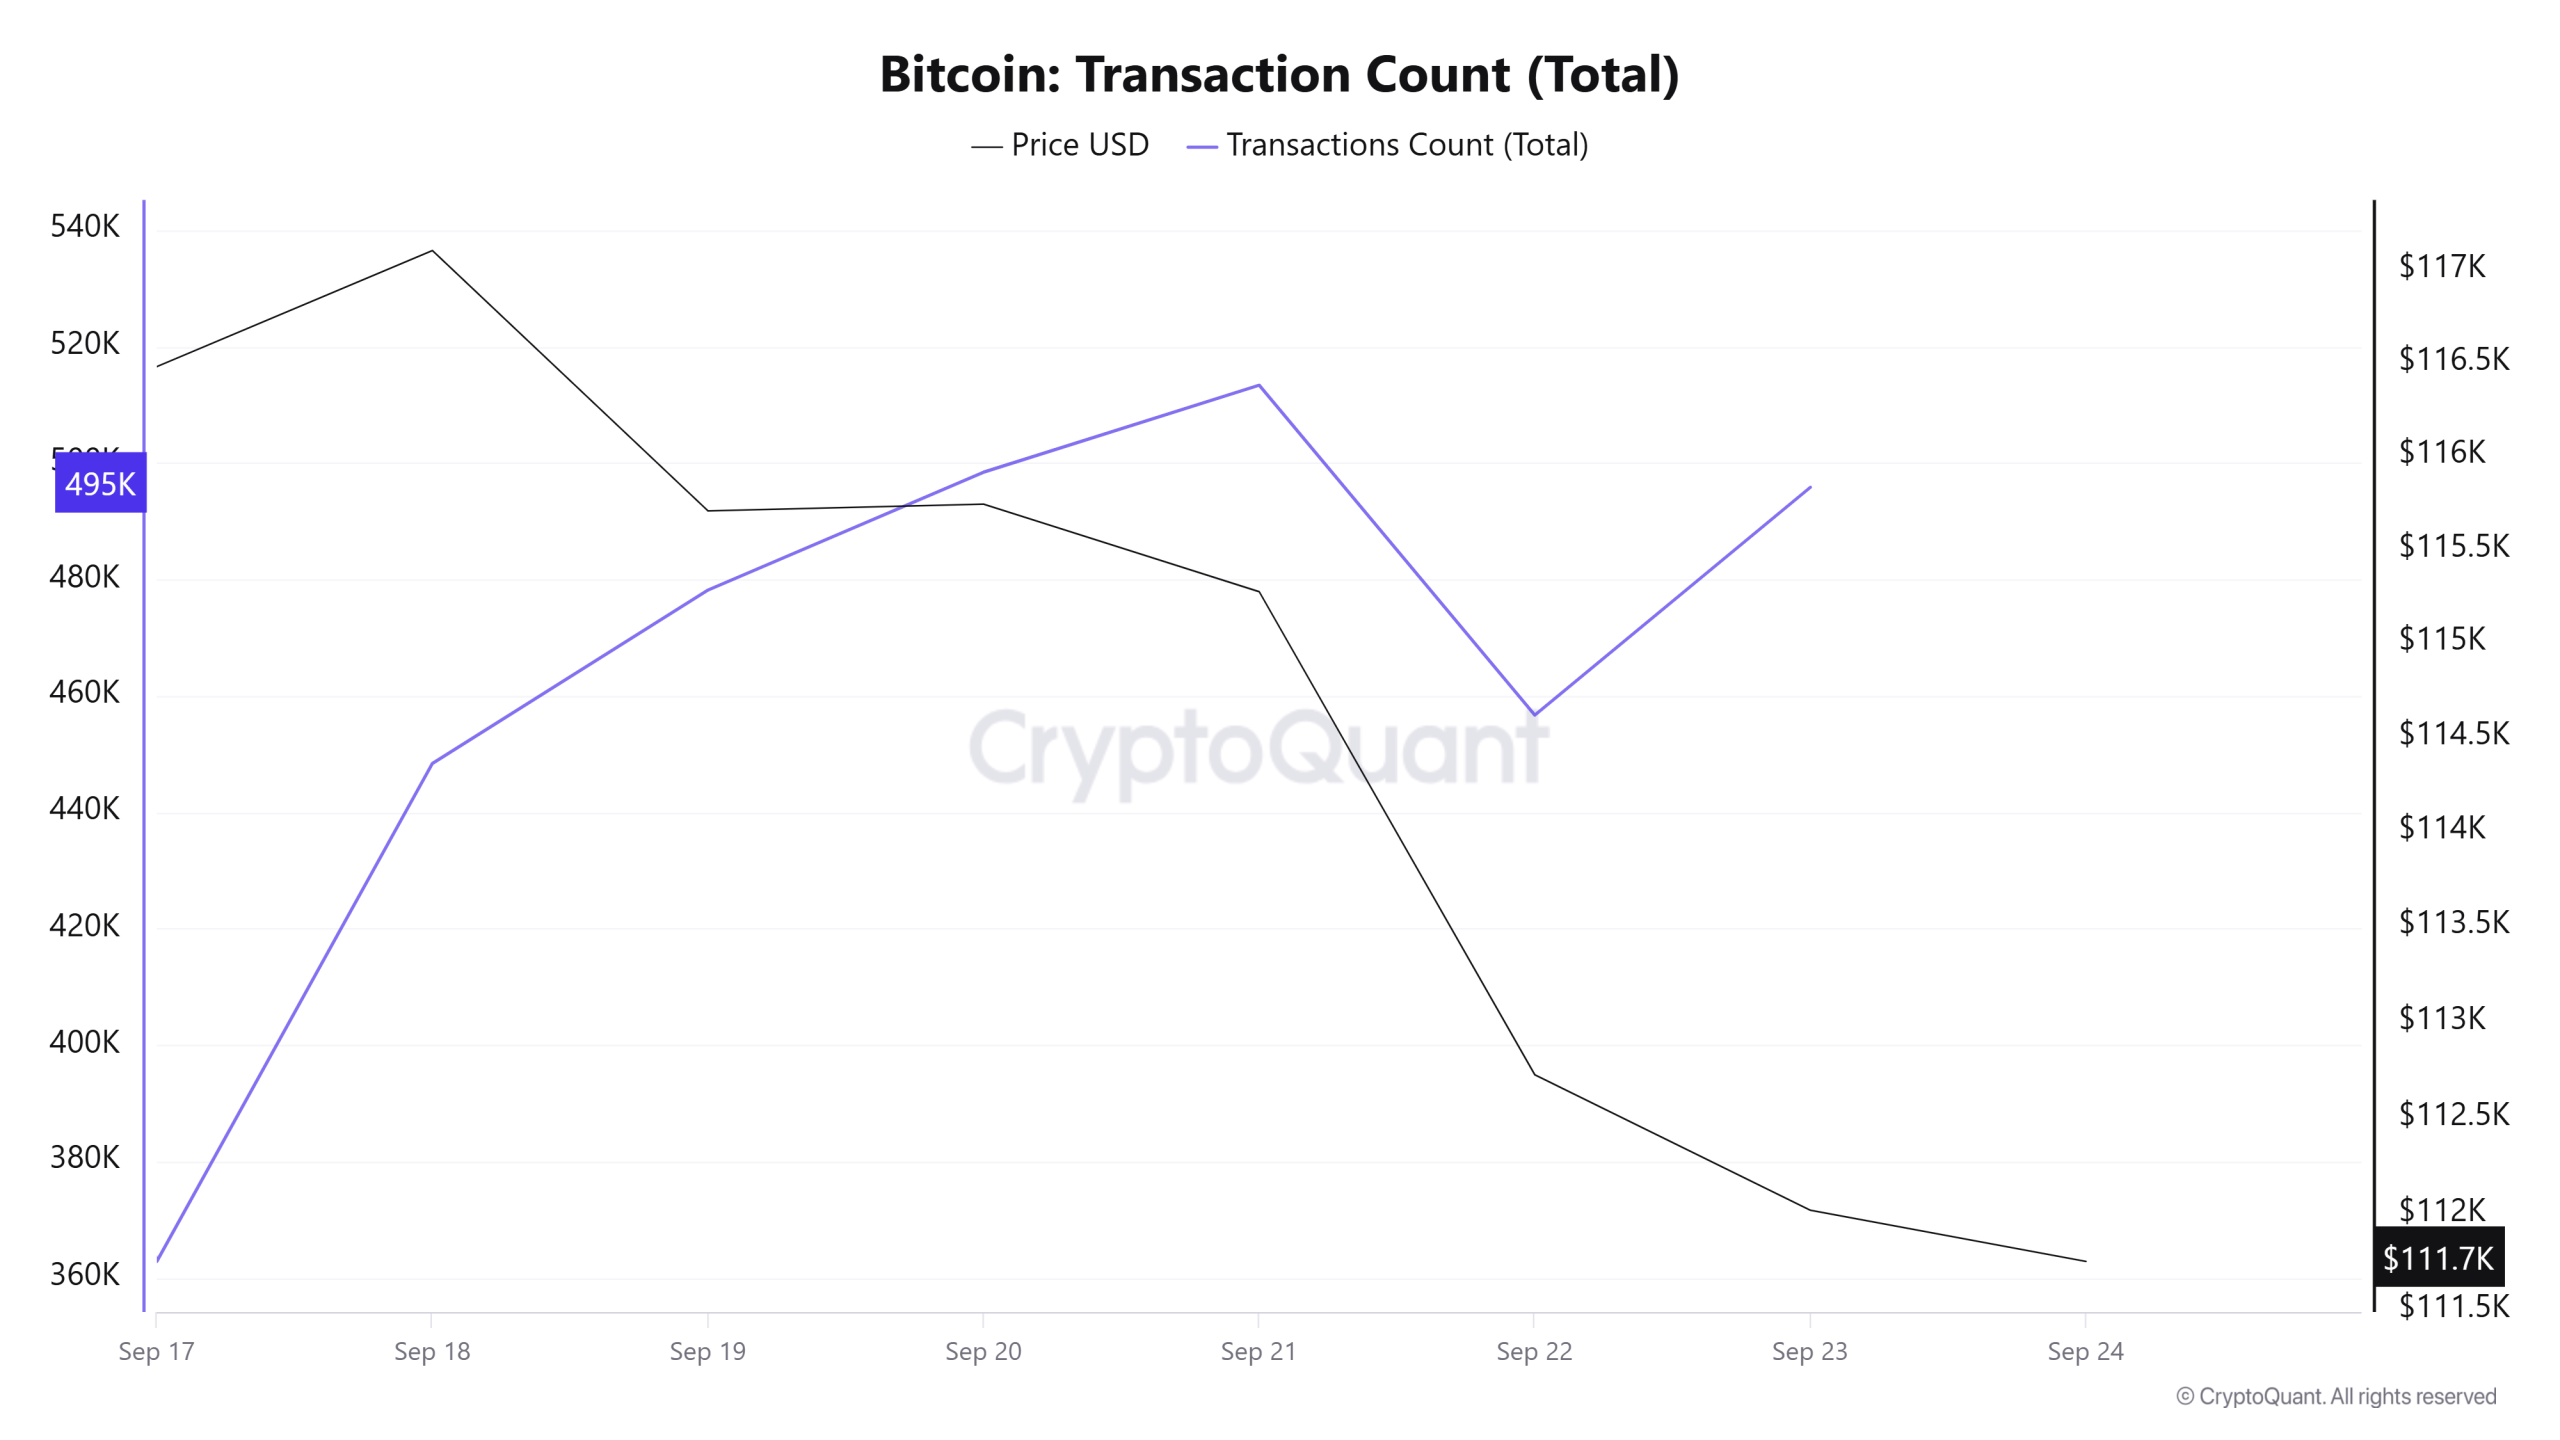
Last week, there were 3,766,256 transactions on the Bitcoin network, while this week the number of transactions was almost unchanged at 3,766,767. The week’s highest transaction volume was 513,328 on September 21, while the lowest was 362,785 on September 17. While the period between September 17 and 21 continued with steady transaction gains, this pattern deteriorated with the pullback on September 22. The fact that the number of transactions is almost the same as last week indicates a rare situation that has not been seen for a long time. When the relationship between transaction count and price is analyzed, negative correlation seems to be dominant throughout the week.
Tokens Transferred
While a total of 4,190,675 BTC was transferred last week, this week the transfer volume increased by 5.28% to 4,411,723 BTC. The highest daily transfer volume of the week was 724,088 BTC on September 22, while the lowest transfer volume was 444,314 BTC on September 21. The correlation between the amount of tokens transferred and the price fluctuated throughout the period.
Considering both the stability in the number of transactions and the increase in the number of tokens transferred, it can be concluded that the exchange of larger amounts of Bitcoins in a single transaction was more intense during the period compared to the previous week. When we examine the relationship with price, we see that this exchange may be mostly a sale-intensive network activity.
Whale Activities
Whales Data:
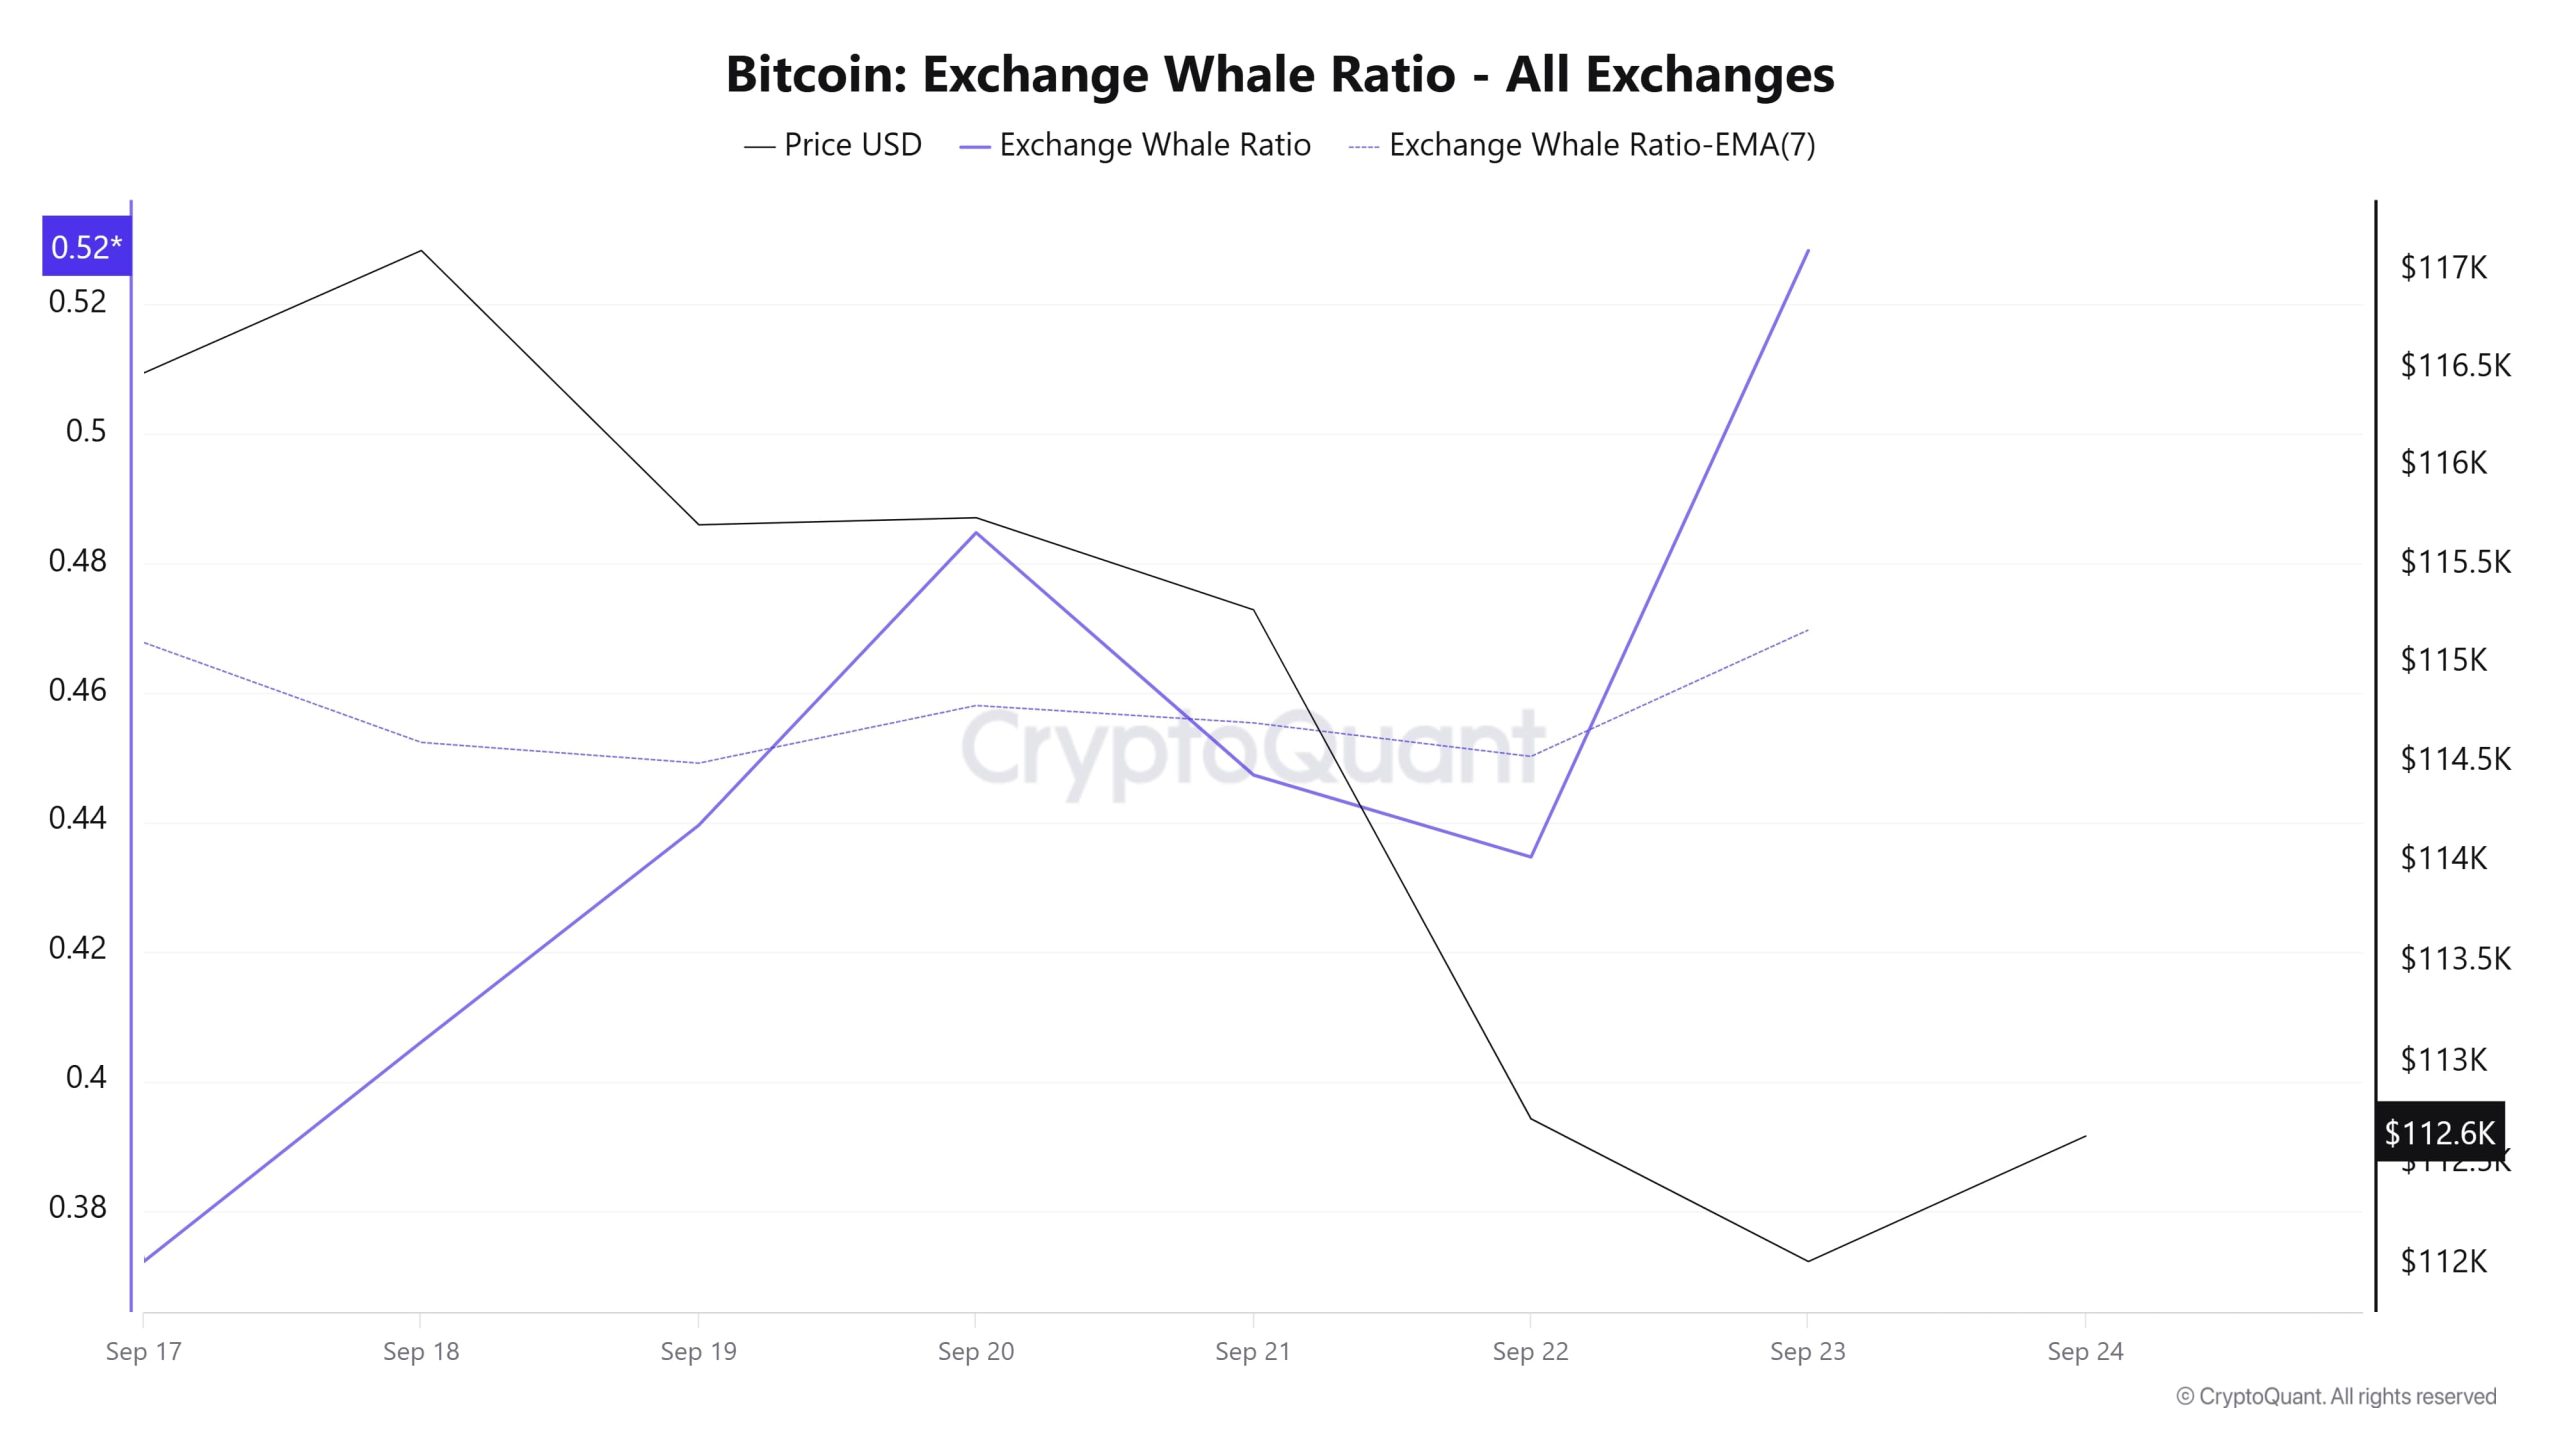
In the last 7 days, according to data from the cryptocurrency market, whale activity on the central exchange has increased from the beginning to the end of the process. When we look at the Exchange Whale Ratio metric, on September 17, the first day of the 7-day period, the rate of whales using central exchanges was 0.372, the lowest point of this process. When this ratio is above 0.35, it usually means that whales use central exchanges frequently. The metric, which currently has a value of 0.528, seems to have caught the upward momentum and at the same time, it has formed the highest point of the process. It is seen that BTC fell from $ 117,300 to 112,400 in this process. At the same time, it is seen that 4,411.72 BTC moved in the total BTC transfer, up 5% compared to last week. Looking at the data, the percentage of long-term holders in Bitcoin is at an all-time high. Whales are adding coins at three times the rate of new issues. However, exchange reserves are decreasing at a very high rate. This suggests a shift towards self-custody and long-term storage. As a result, BTC experienced more exit days last week despite the weakening price. Inflows were distributed to small whale wallets of 1000-10,000 BTC, with additional flows to shark wallets that continue their ongoing expansion. The largest whale wallets with over 10K BTC, some of which are owned by exchanges, redistributed their coins. Alongside the general accumulation trend, specific whales accelerated their buying behavior. The downward buying trend continues. But the market is currently dominated by whales selling.
BTC Onchain Overall
| Metric | Positive 📈 | Negative 📉 | Neutral ➖ |
|---|---|---|---|
| Active Addresses | ✓ | ||
| Derivatives | ✓ | ||
| Supply Distribution | ✓ | ||
| Exchange Supply Ratio | ✓ | ||
| Exchange Reserve | ✓ | ||
| Fees and Revenues | ✓ | ||
| Miner Flows | ✓ | ||
| Transaction | ✓ | ||
| Whale Activities | ✓ |
*The metrics and guidance in the table do not, in and of themselves, describe or imply an expectation of future price changes for any asset. The prices of digital assets may vary depending on many different variables. The onchain analysis and related guidance are intended to assist investors in their decision-making process, and making financial investments based solely on the results of this analysis may result in harmful transactions. Even if all metrics produce a positive, negative or neutral result at the same time, the expected results may not be seen according to market conditions. Investors reviewing the report would be well advised to heed these caveats.
Legal Notice
The investment information, comments and recommendations contained in this document do not constitute investment advisory services. Investment advisory services are provided by authorized institutions on a personal basis, taking into account the risk and return preferences of individuals. The comments and recommendations contained in this document are of a general type. These recommendations may not be suitable for your financial situation and risk and return preferences. Therefore, making an investment decision based solely on the information contained in this document may not result in results that are in line with your expectations.
NOTE: All data used in Bitcoin onchain analysis is based on Cryptoqaunt.