
Weekly Ethereum Onchain Report – November 26
Active Addresses
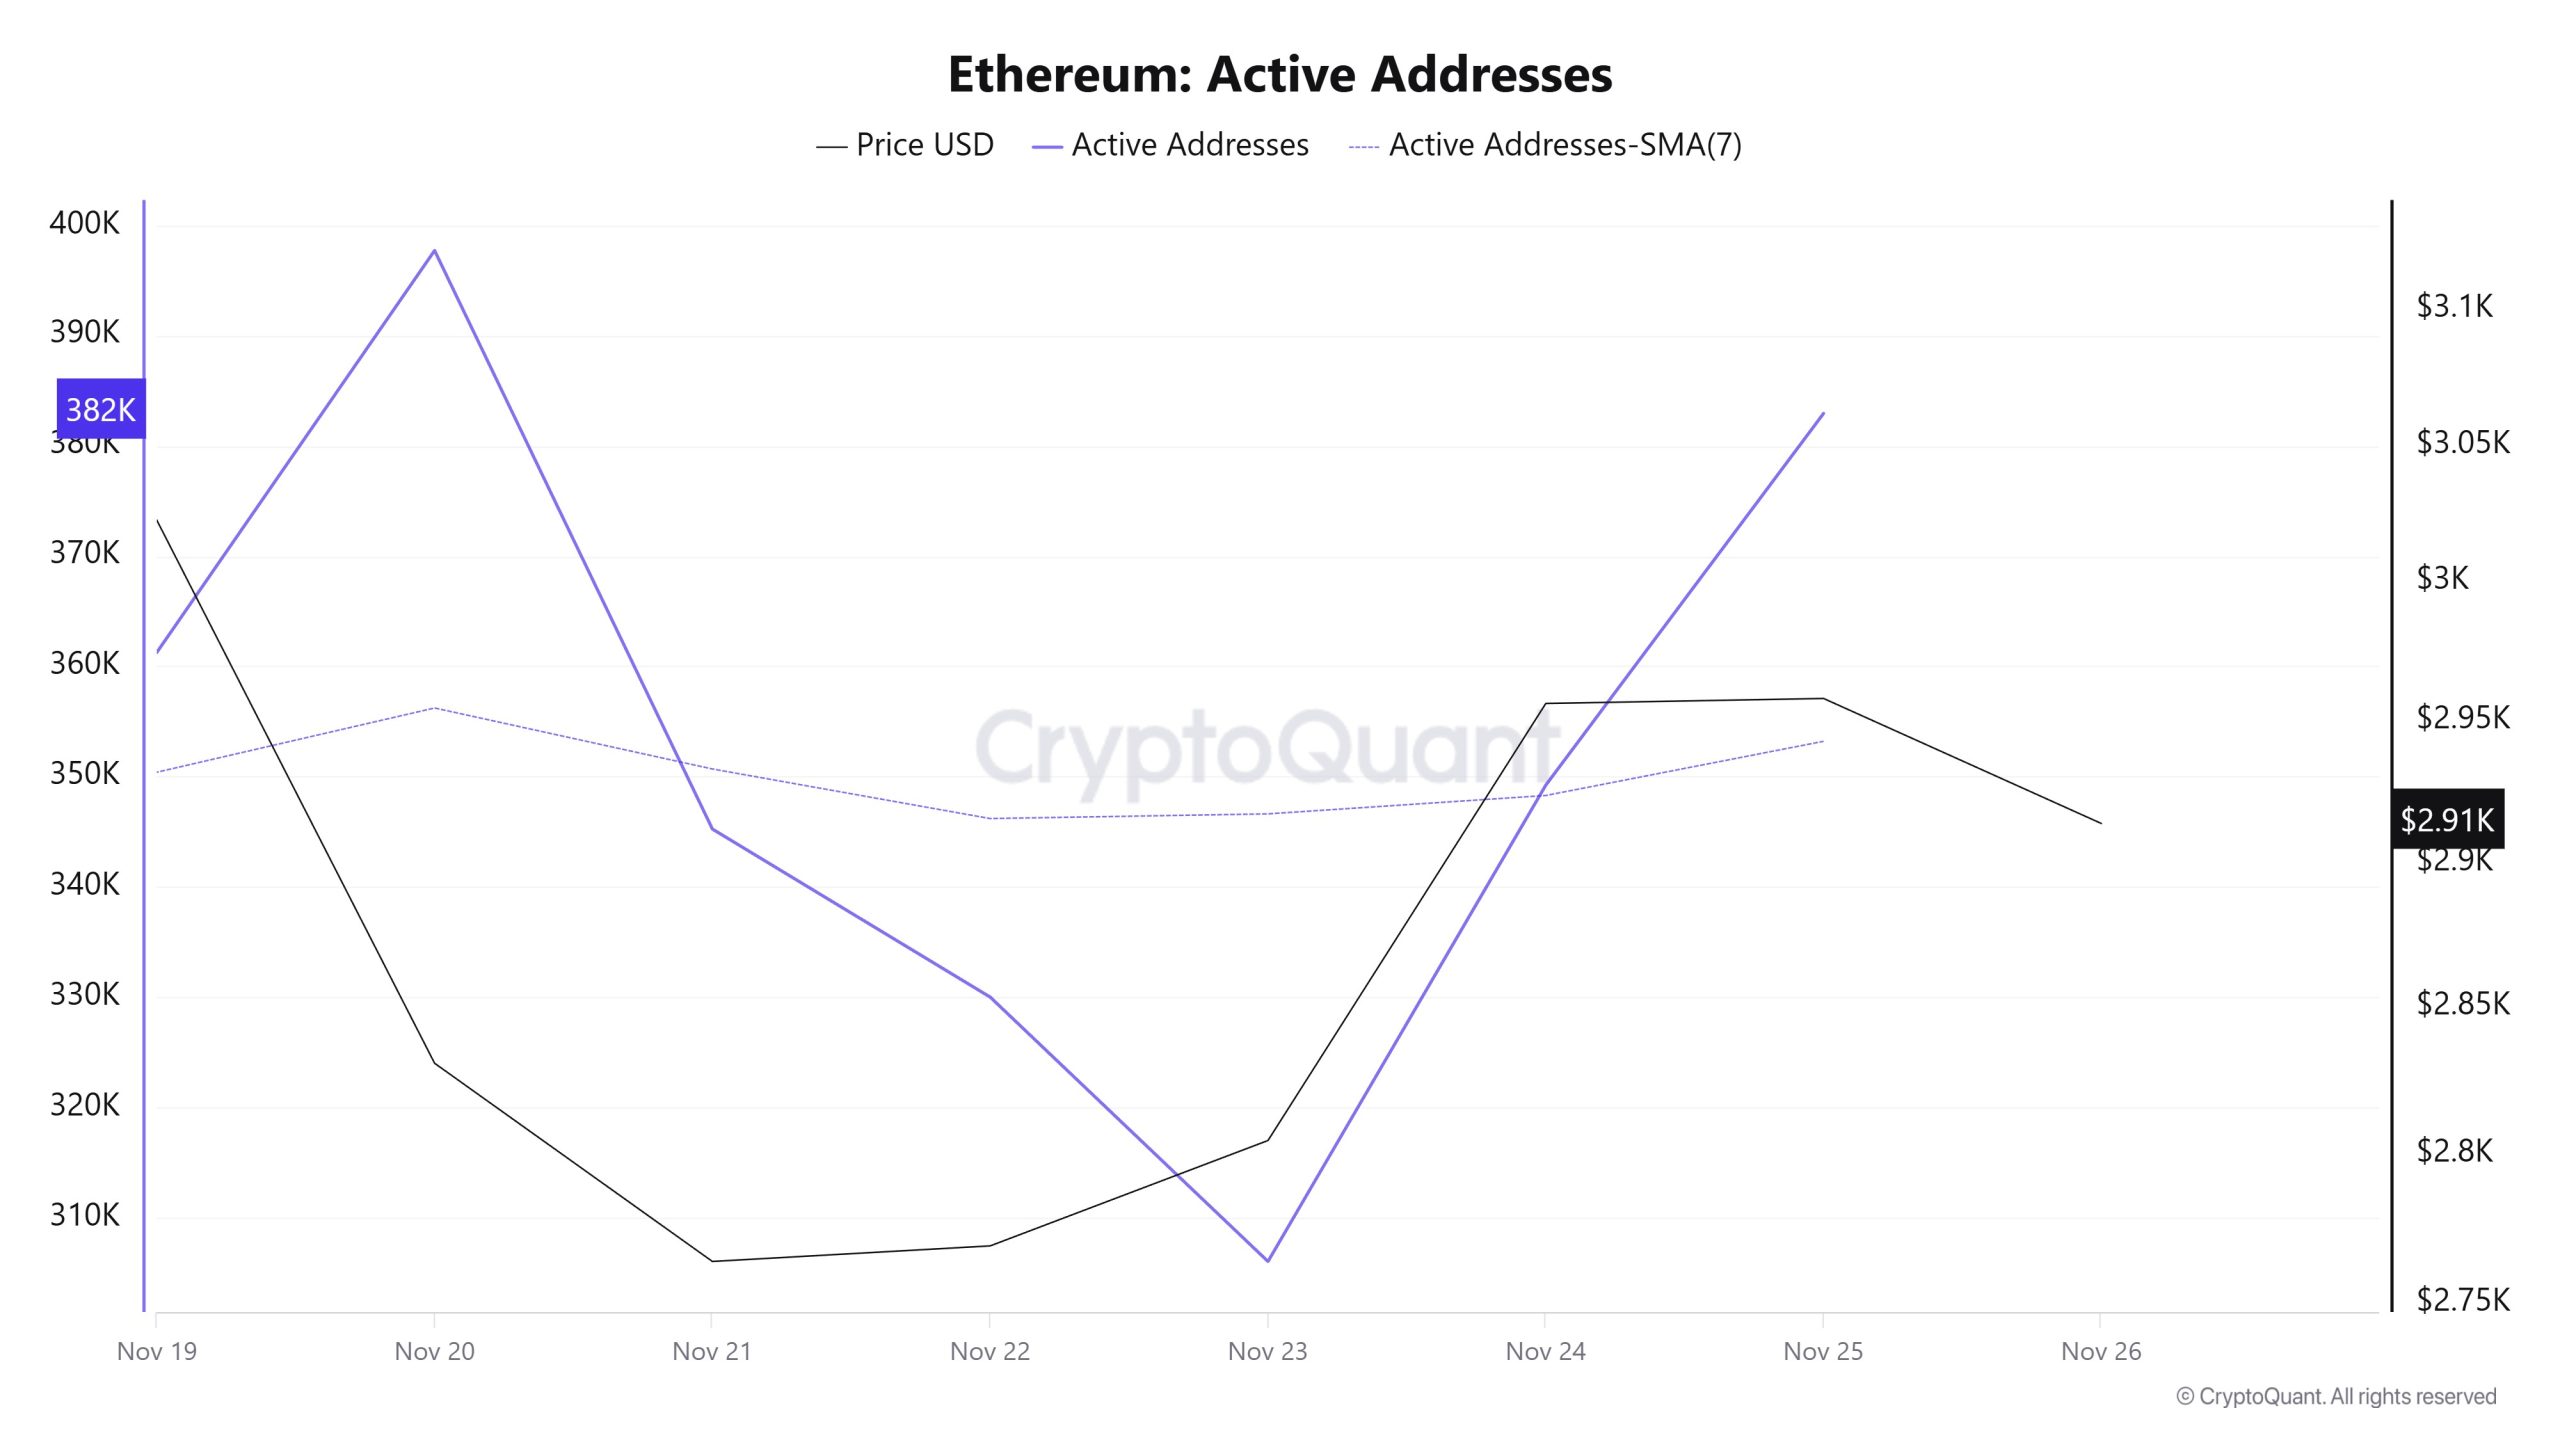
Between November 19 and November 26, a total of 397,727 active addresses were added to the Ethereum network. During this period, the Ethereum price fell from $3,200 to $2,763. On November 13, in particular, when the price hit the active address point, the number of active addresses rose, while a certain decline was observed in the price point. When examining the 7-day simple moving average (SMA), it can be seen that the Ethereum price is generally trending downward.
Active Sending Addresses
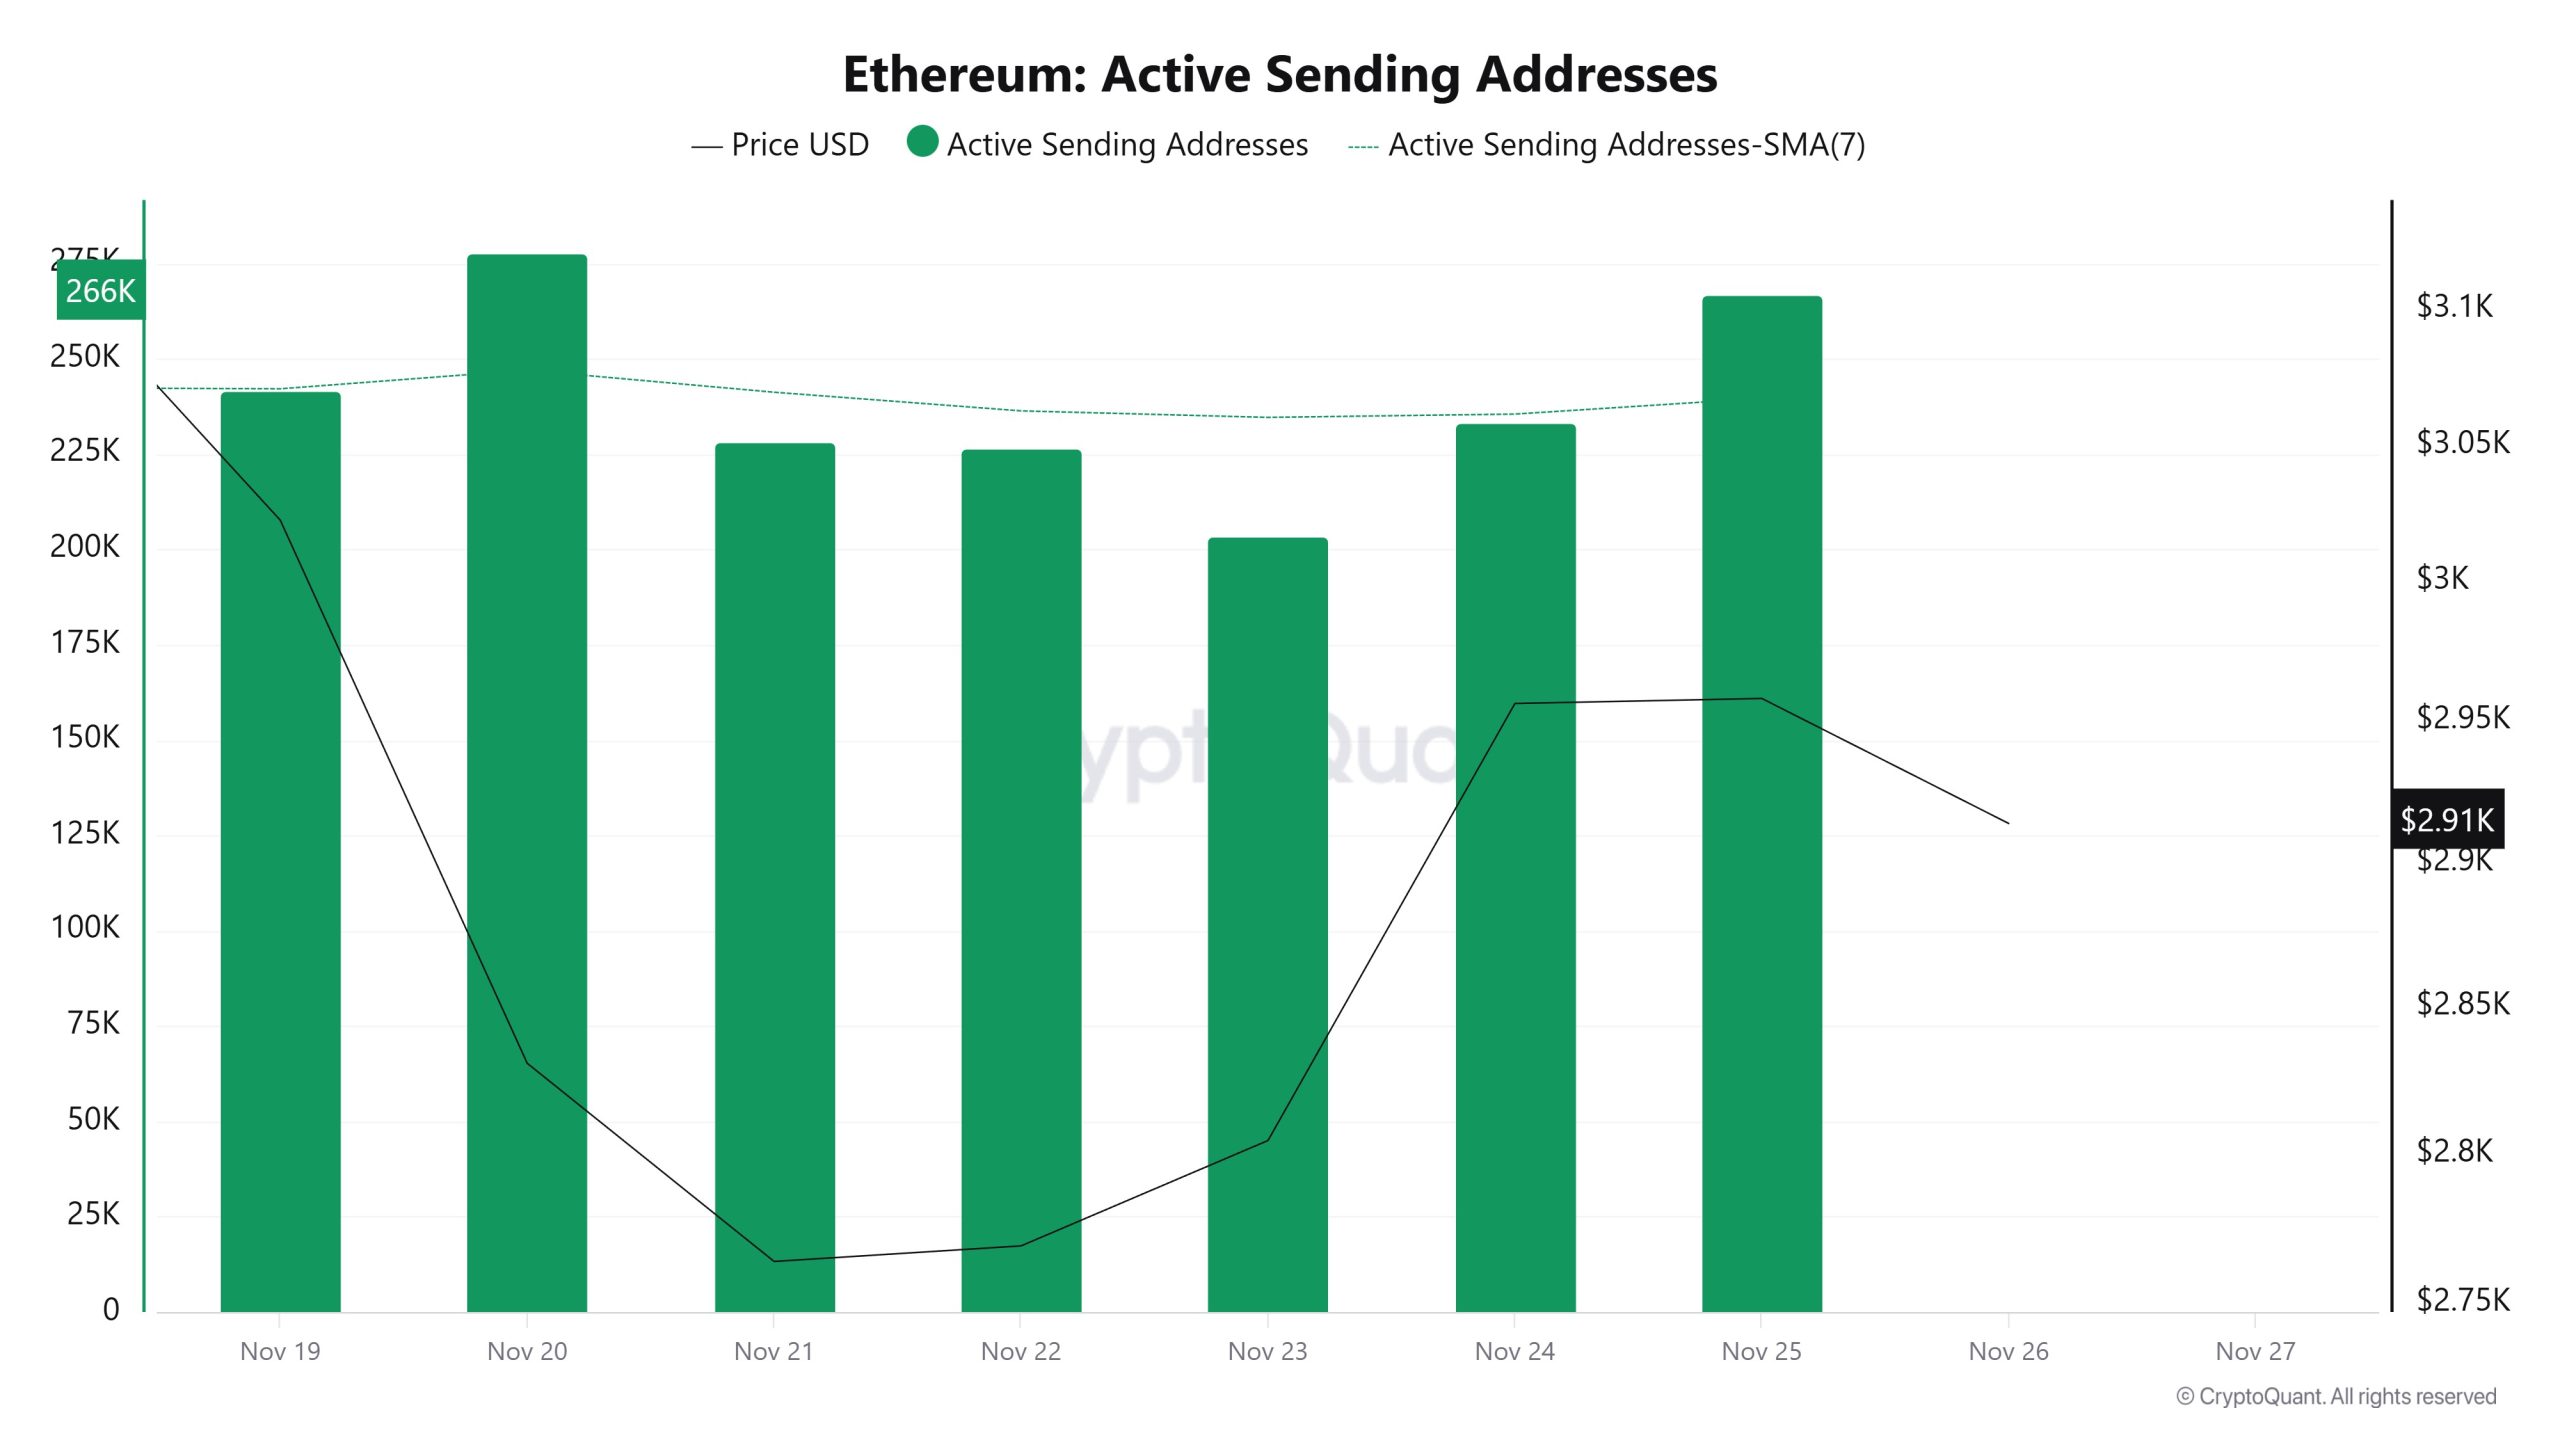
Between November 19 and November 26, high levels of active sending activity were observed alongside the Black Line (price line). On the day the price reached its highest level on a weekly basis, active sending addresses reached 277,746.
Active Receiving Addresses
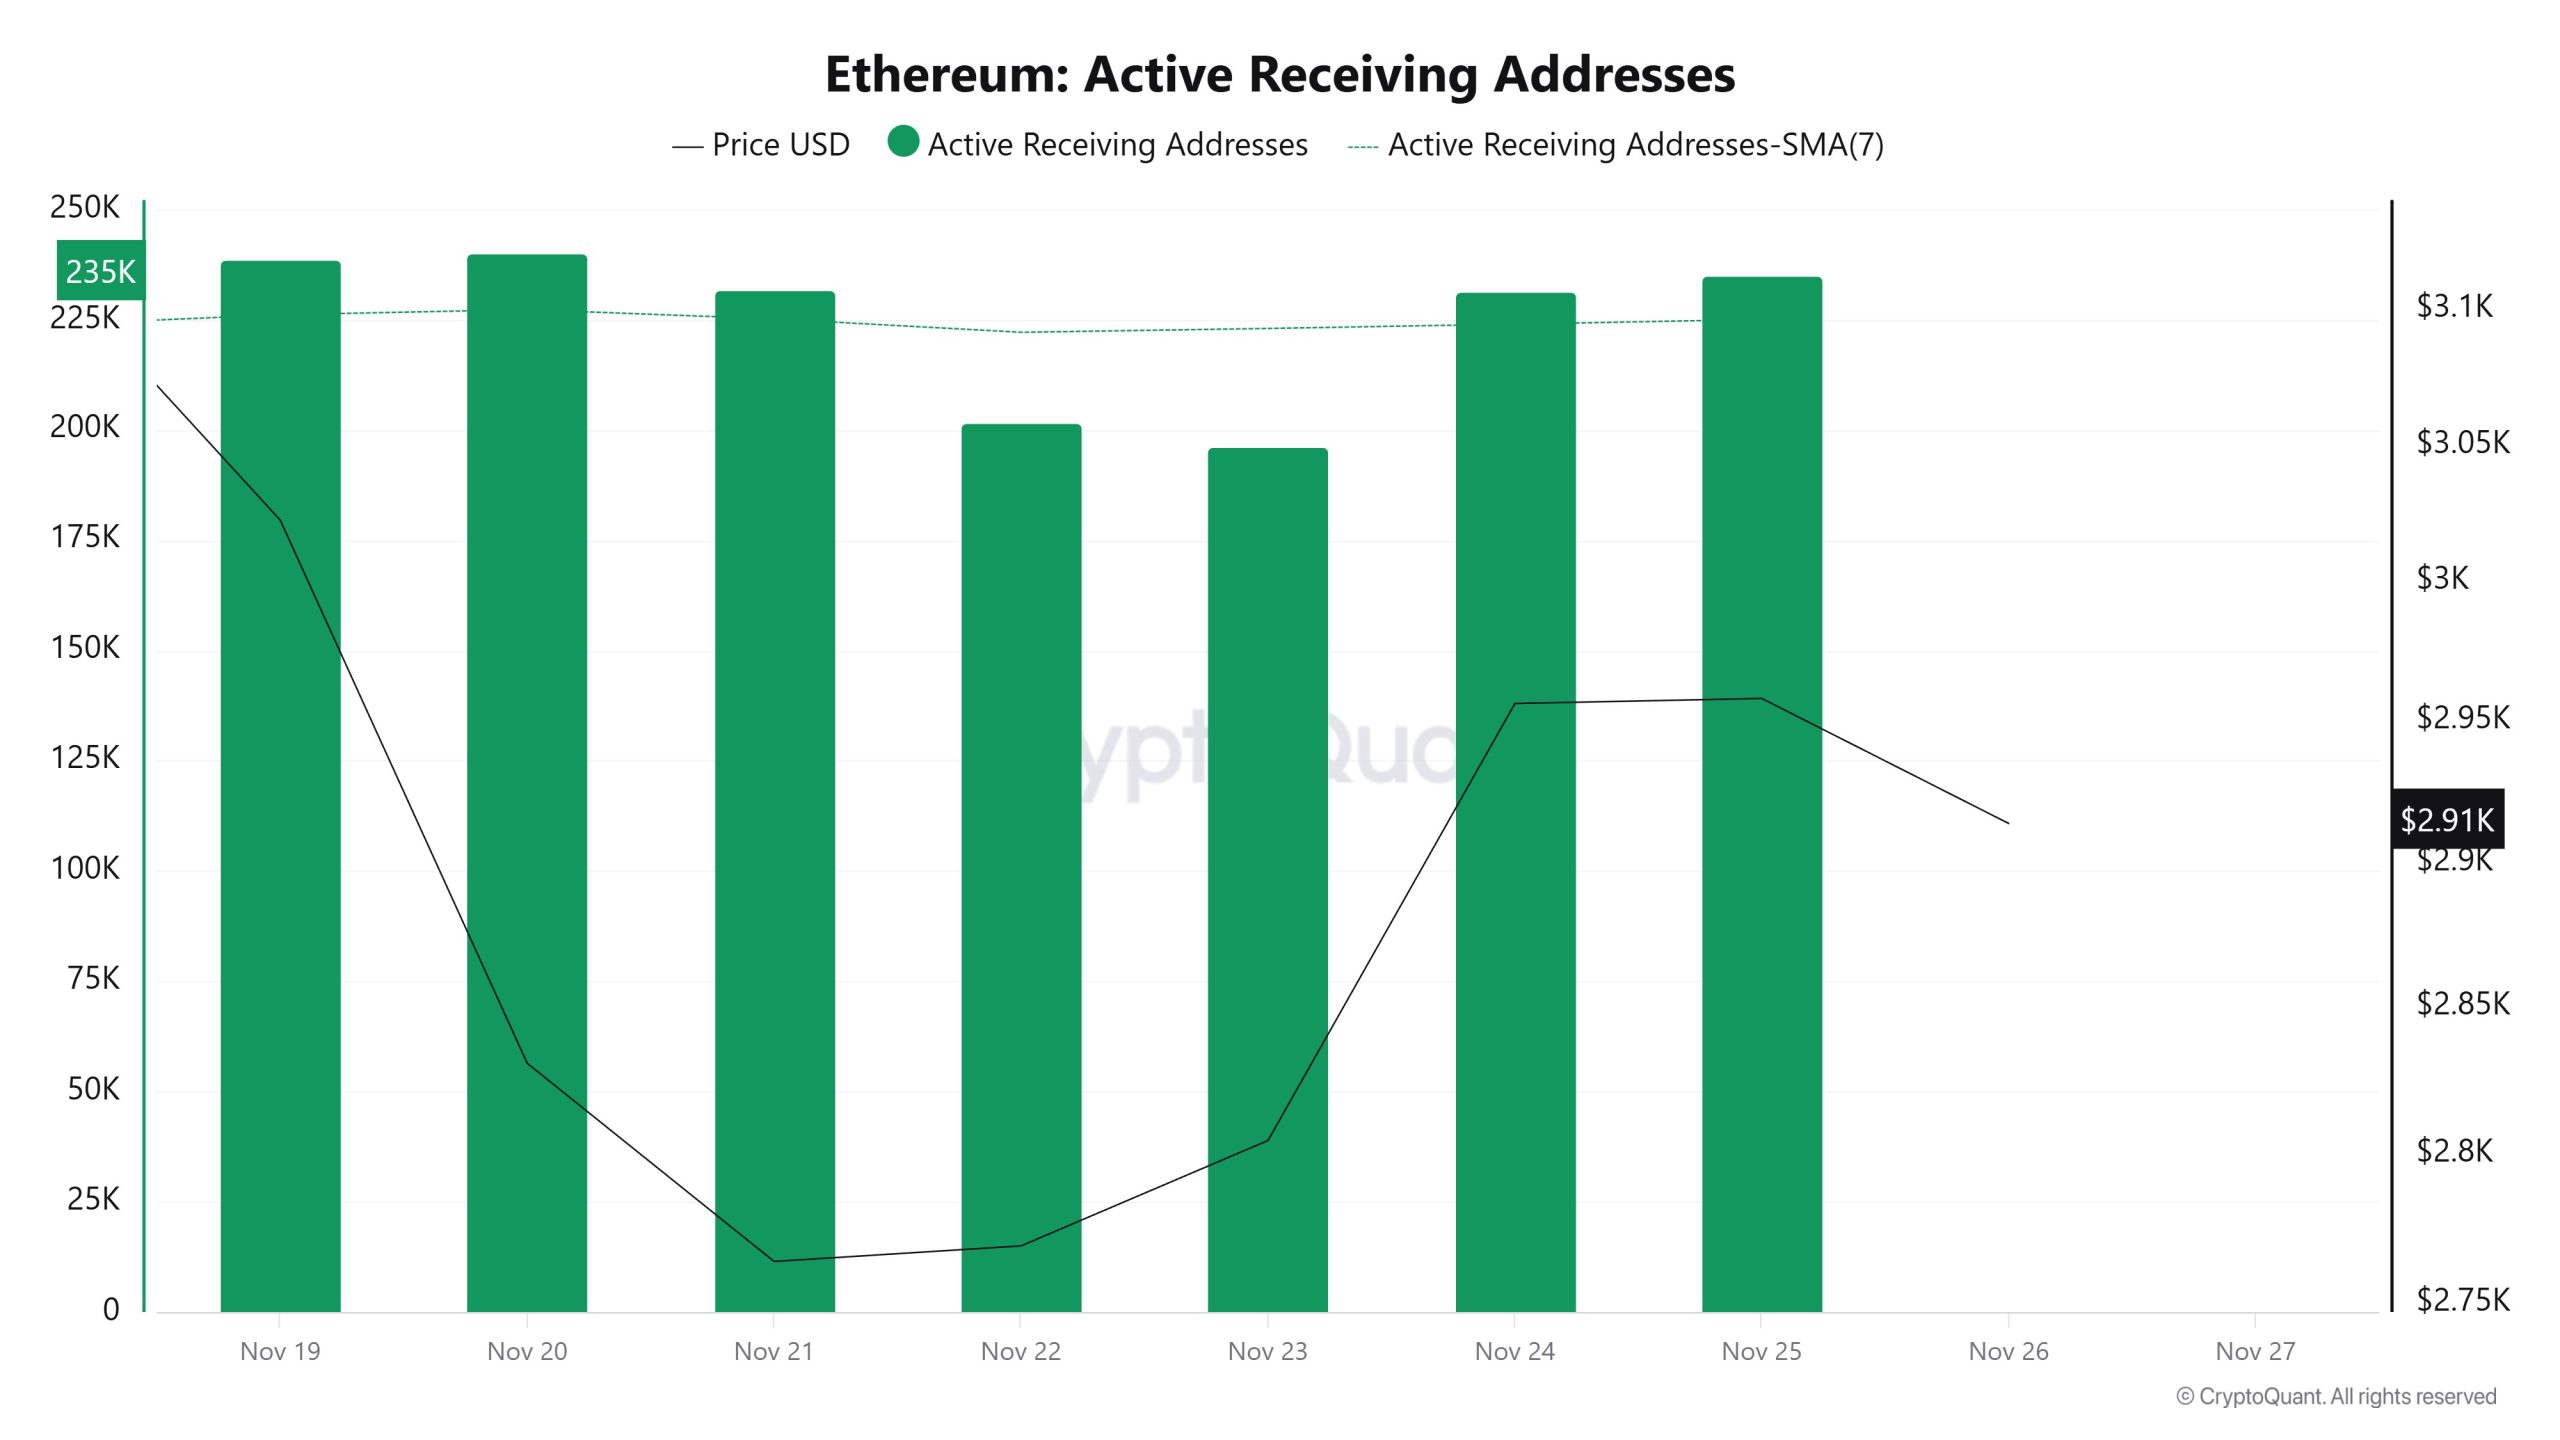
Between November 19 and November 26, while there was no significant increase in active receiving addresses, the price was seen to move downward. On the day the price reached its highest level, active receiving addresses reached 240,165, indicating an increase in purchases.
Total Value Staked
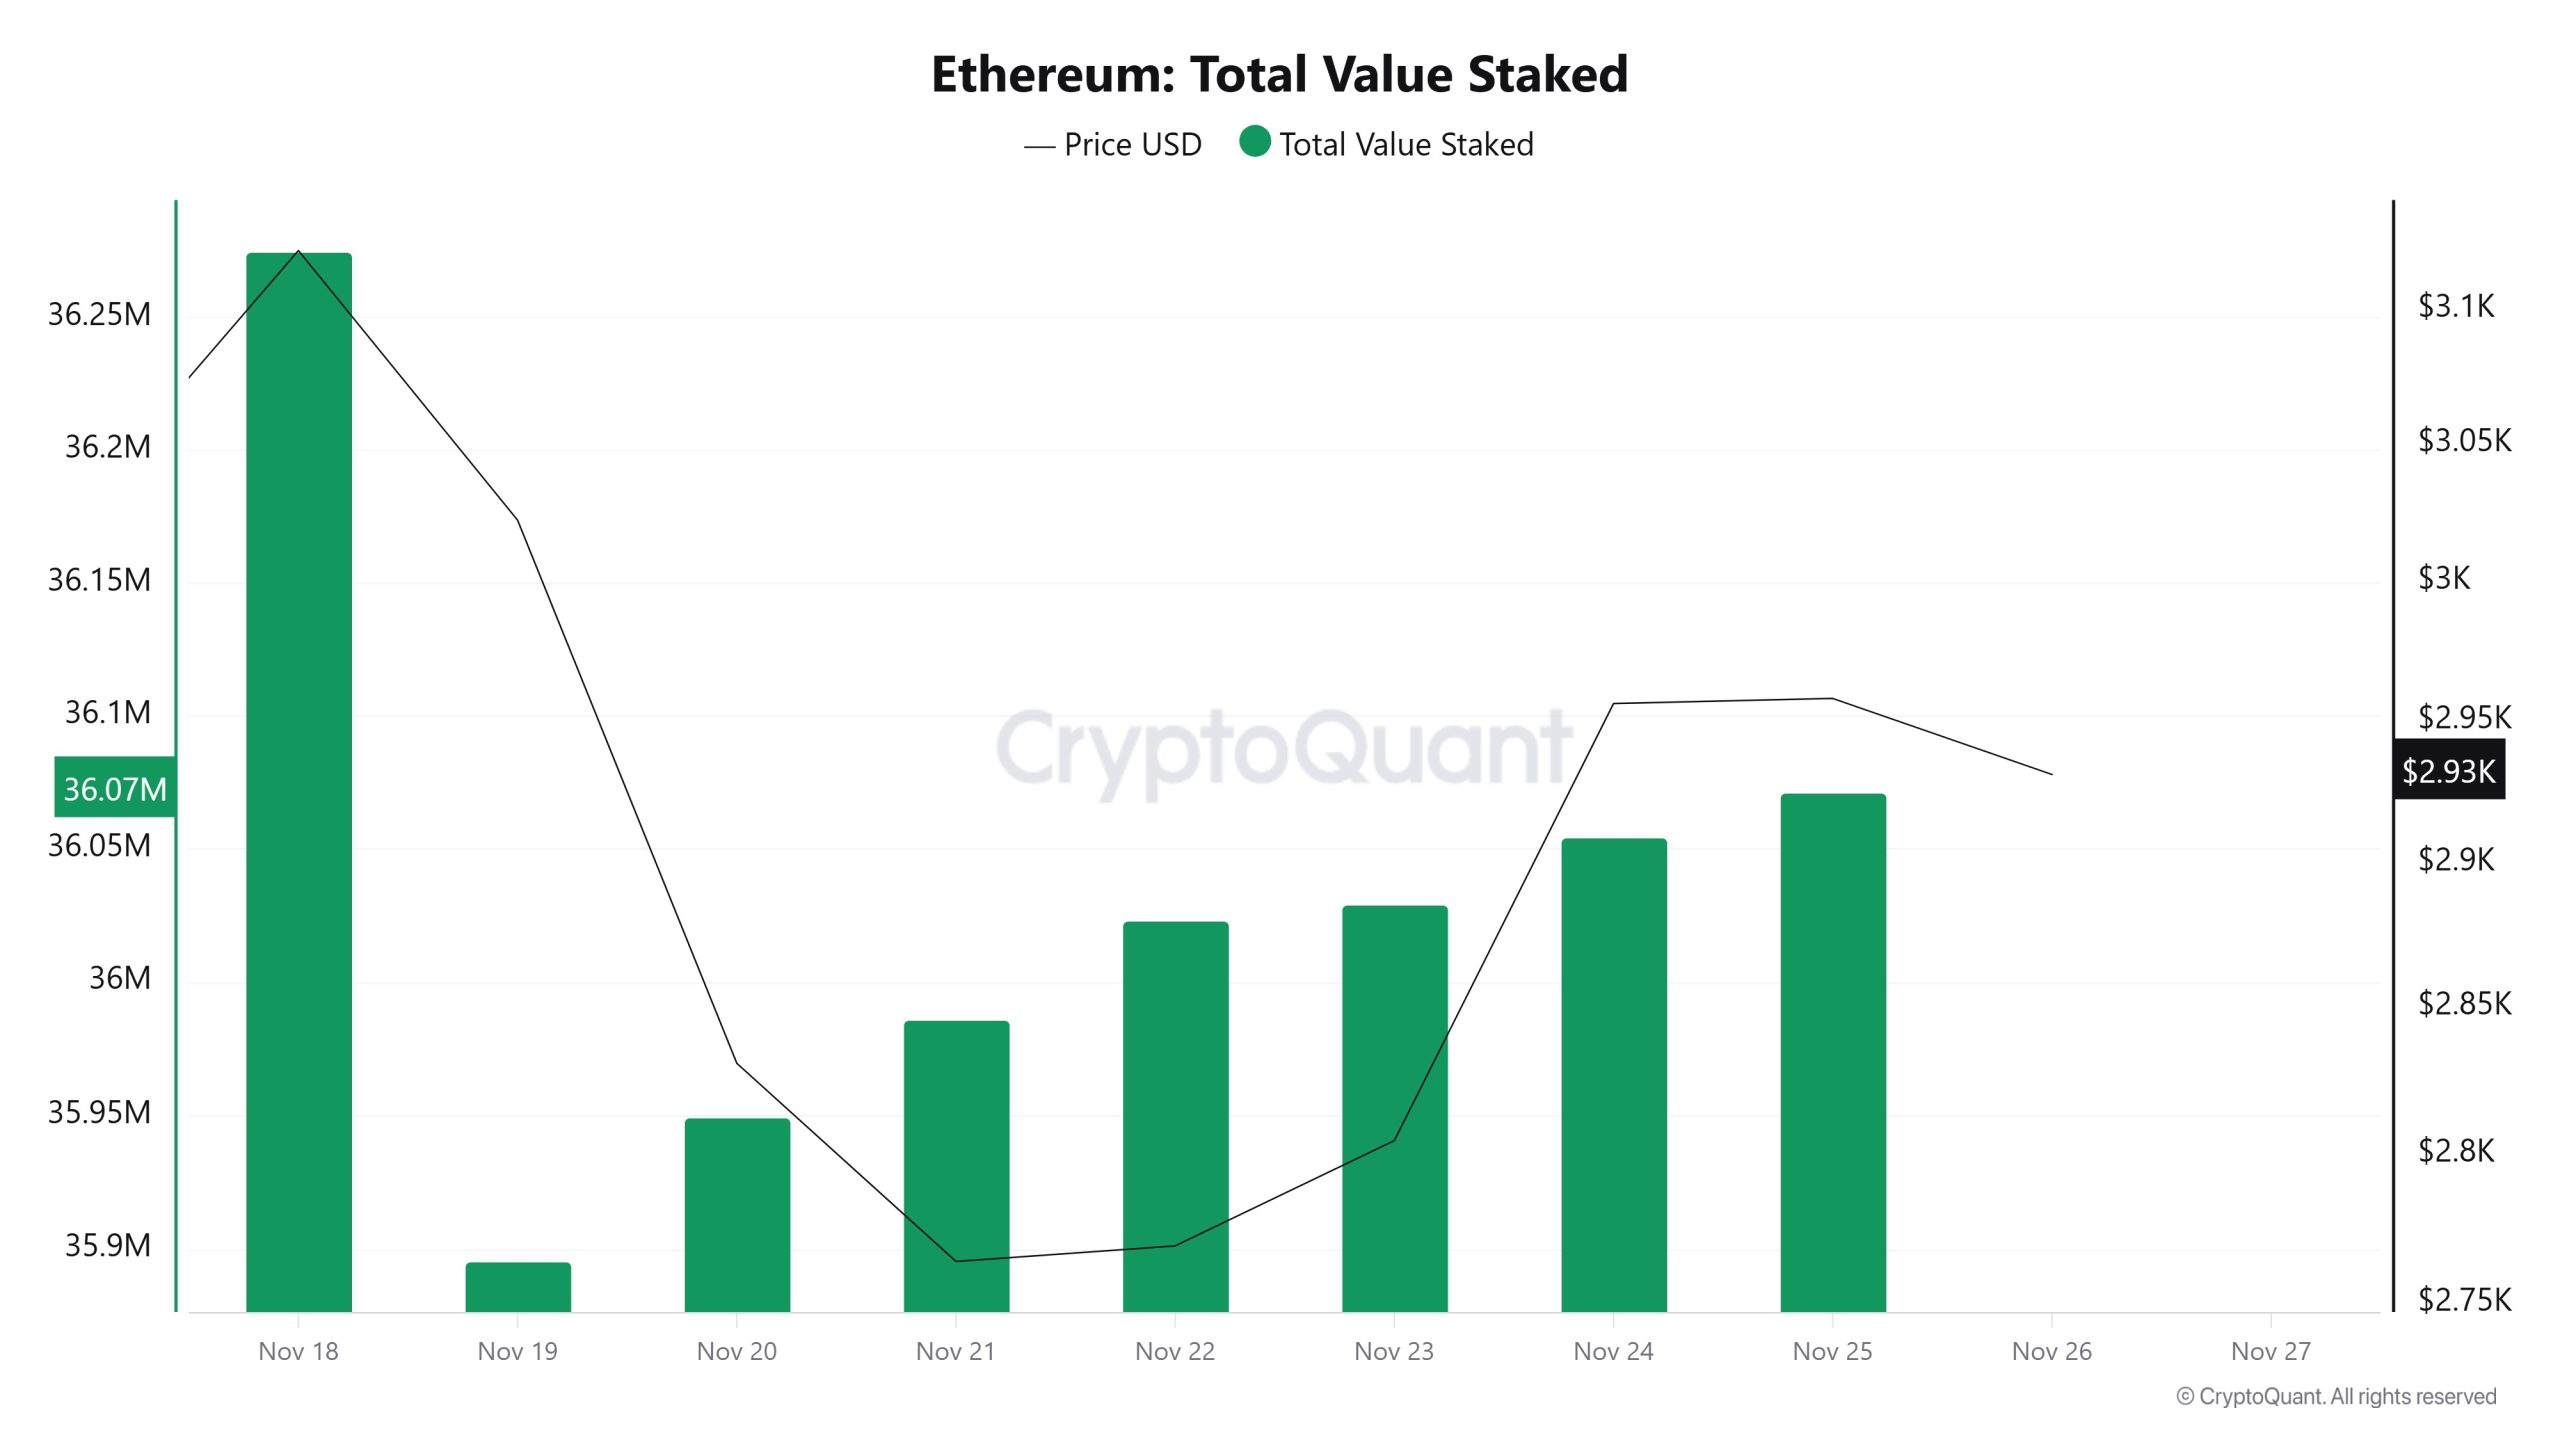
On November 19, when the ETH price was trading at $3,022, the Total Value Staked was at 35,895,448. As of November 25, the ETH price fell to $2,958, while the Total Value Staked rose to 36,071,172, recording a 0.49% increase.
Staking Inflows
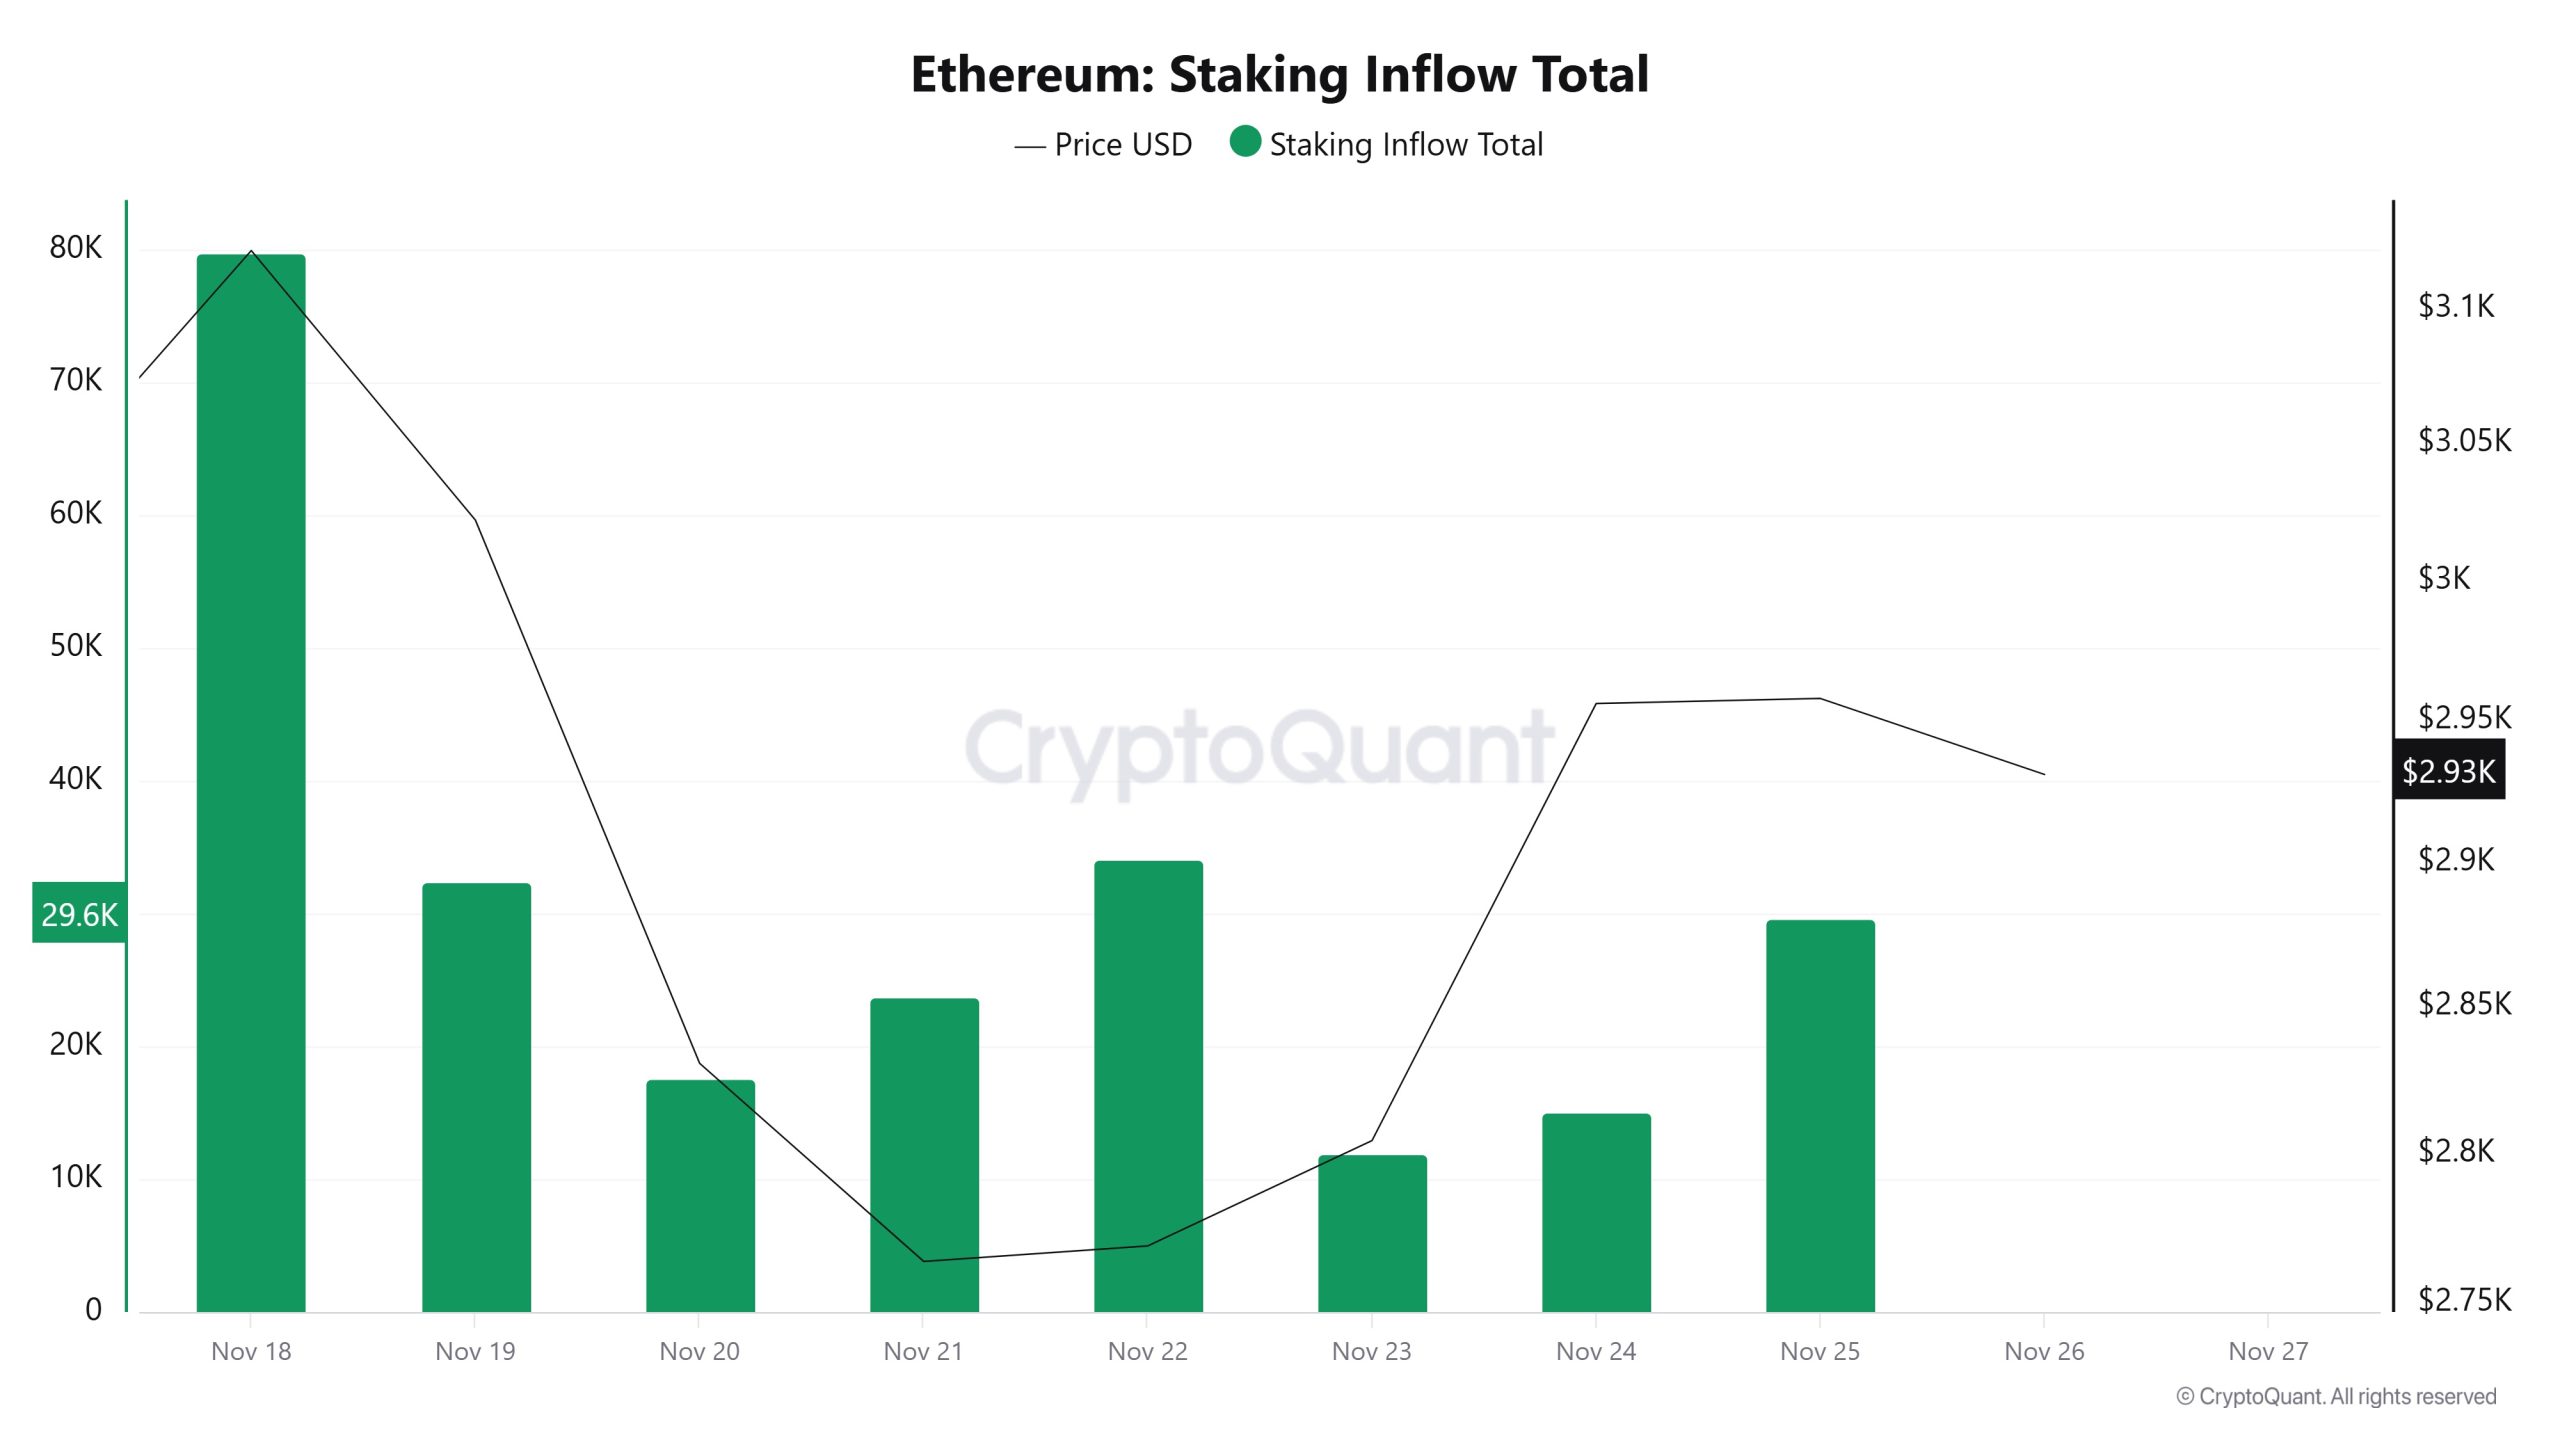
On November 19, while the ETH price was trading at $3,022, the Staking Inflow was at 32,473. As of November 25, while the ETH price fell to $2,958, the Staking Inflow dropped to 29,696, recording an 8.55% decrease.
Derivatives
Open Interest

Ethereum’s open interest data shows that tension in the futures market has eased somewhat in recent days. The chart indicates that a gradual recovery process has begun following a sharp pullback. This initial decline in the futures markets aligns with investors’ tendency to reduce short-term risks. Subsequently, as the price reacted upward, open interest also began to recover. This is a positive sign, indicating that market interest is starting to increase again and new positions are being opened. However, the slight pullback following the recovery shows that the direction is not yet completely clear. The overall outlook suggests a cautious but positive expectation in the Ethereum futures market. This volatile trend in open interest indicates that volatility on the price may increase in the coming period.
Funding Rate
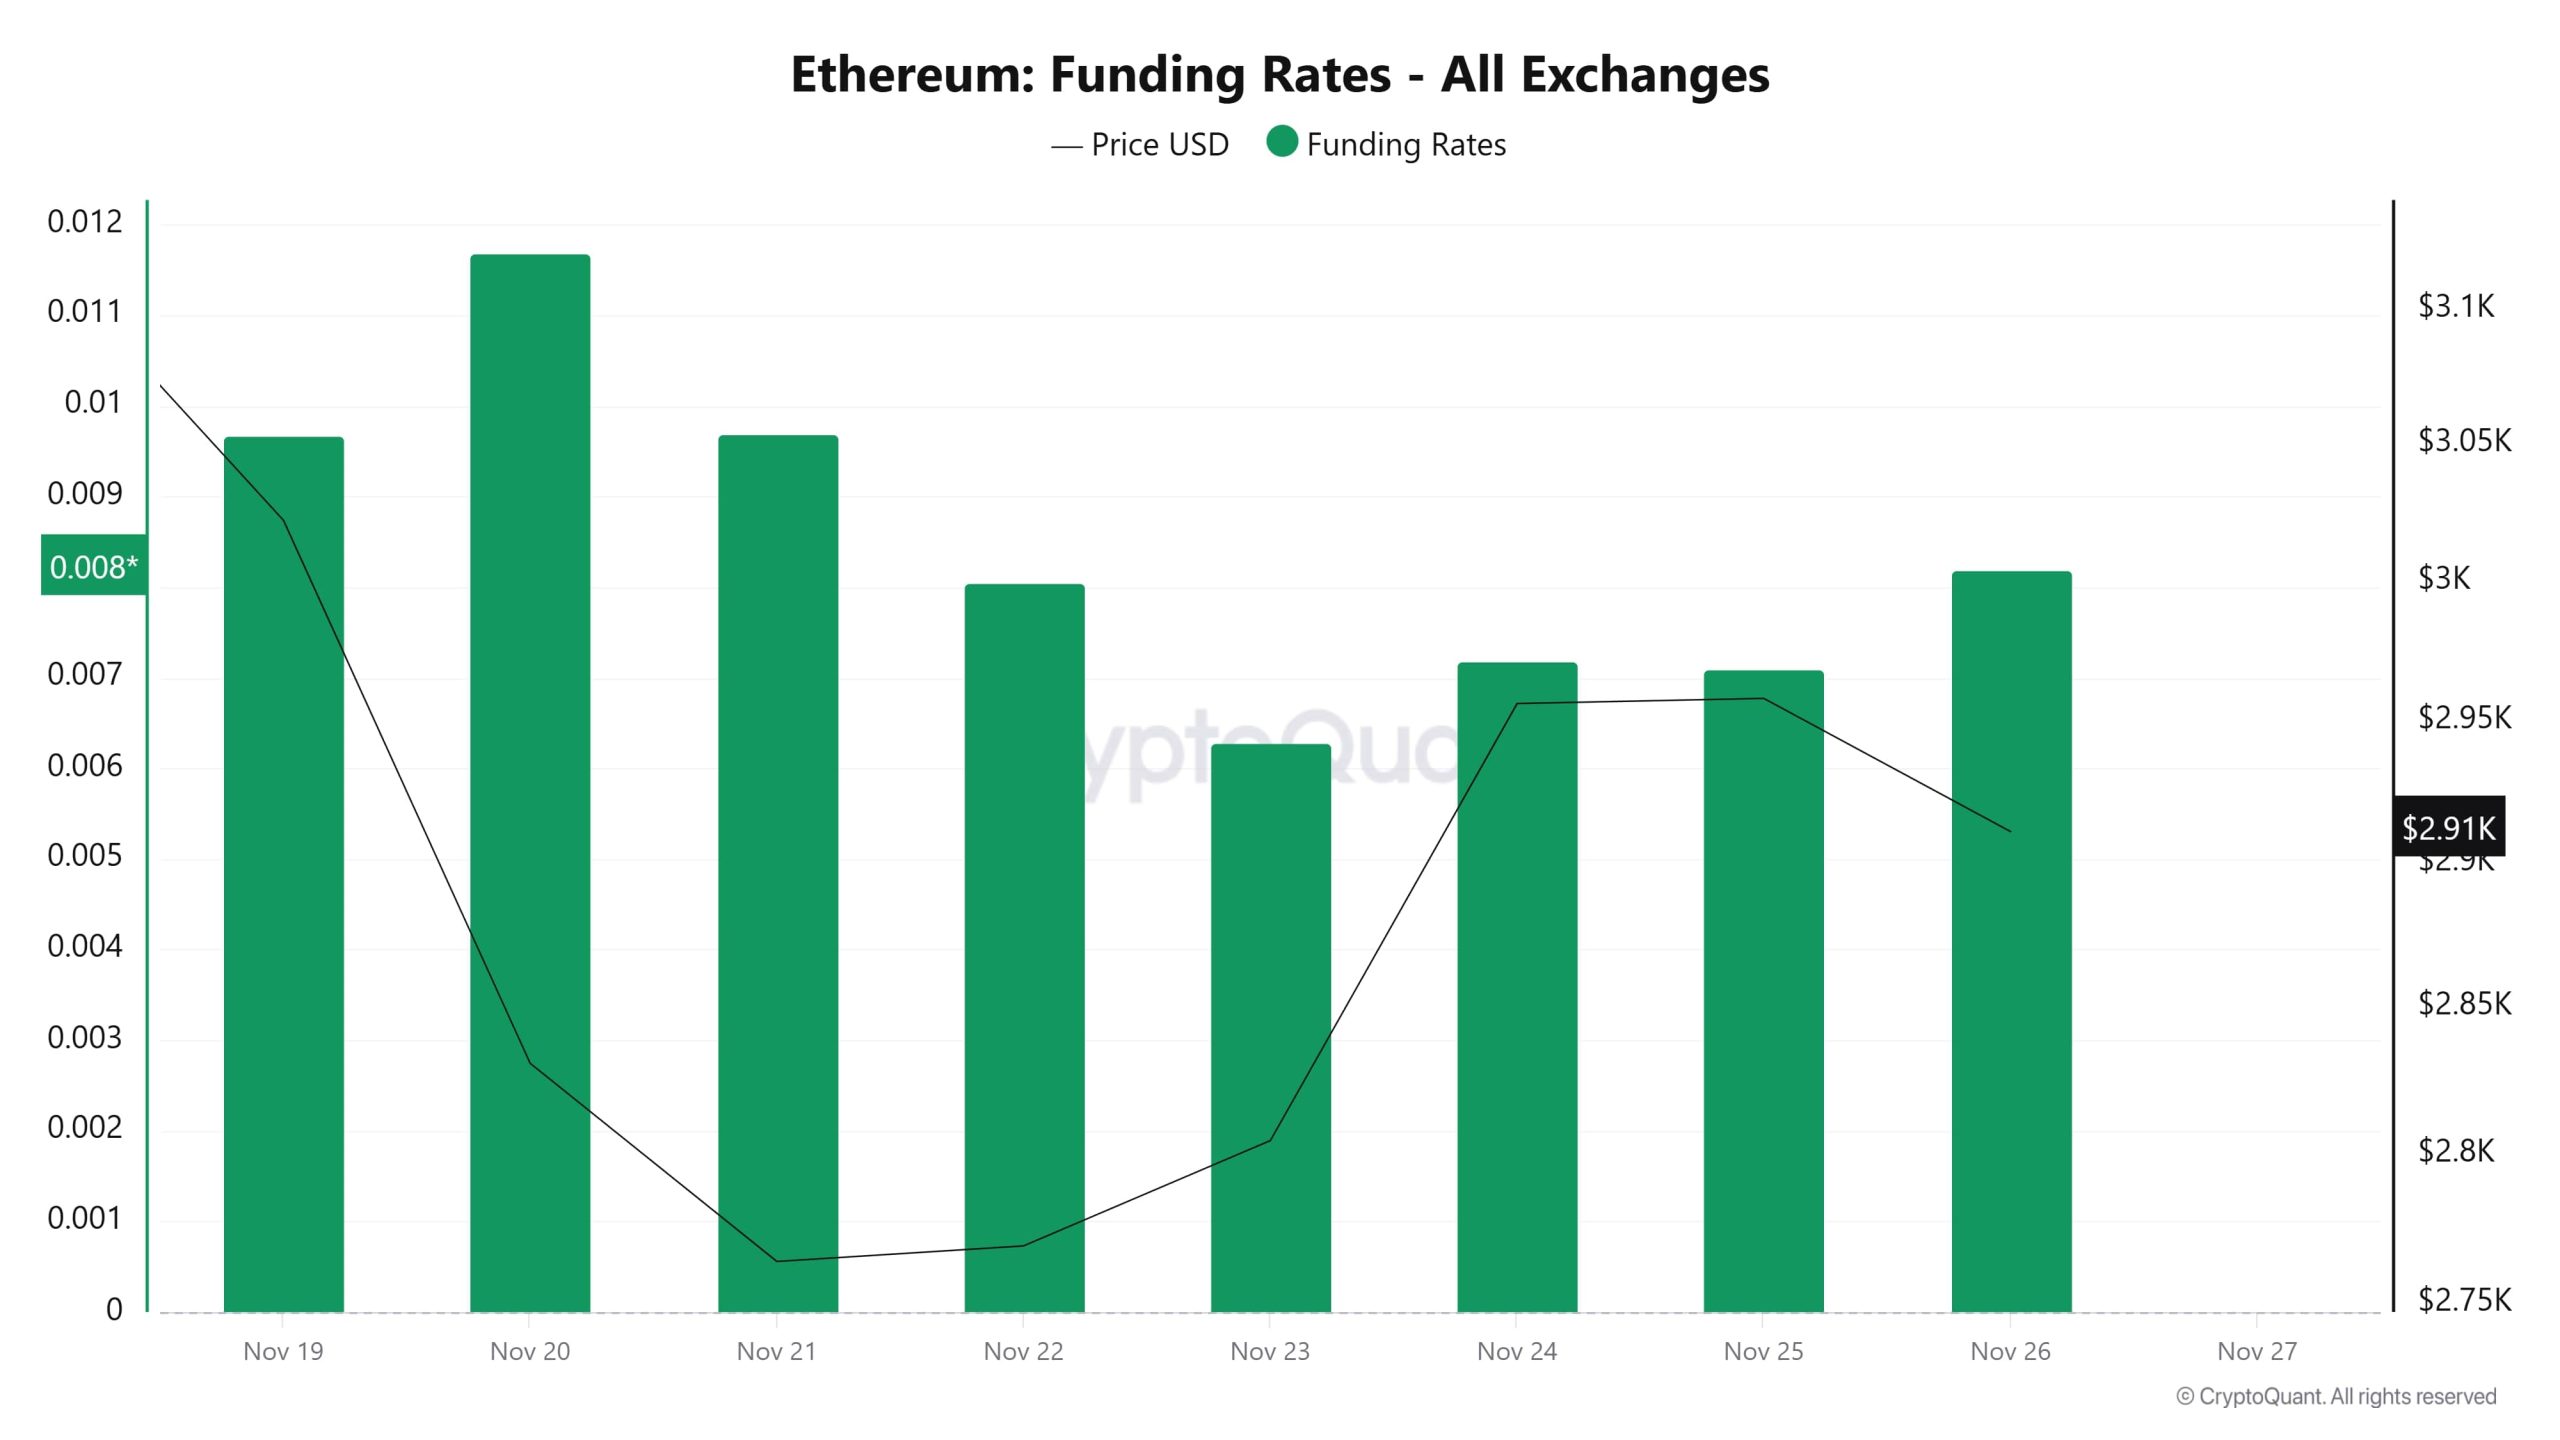
On the Ethereum side, the funding rate data shows that long positions still dominate the leveraged market. The fact that the rates mostly remain in positive territory on the chart indicates that investors maintain their expectations for the price’s upside potential. Although the price retreated at times, the funding rate’s ability to stay above the positive line shows that the declines did not create a strong atmosphere of panic. The rise in rates during the recovery period between November 24 and 26 stands out as an important signal supporting renewed appetite for futures trading. The overall outlook suggests that despite continued short-term volatility in Ethereum, market players still point to an upward direction.
Long & Short Liquidations
Along with the ETH price falling from $3,126 to $2,623, $749 million worth of long positions were liquidated. During the same time frame, $376 million worth of short positions were also liquidated.
| Date | Long Volume (Million $) | Short Volume (Million $) |
|---|---|---|
| November 19 | 125.17 | 54.29 |
| November 20 | 323.48 | 32.70 |
| November 21 | 170.45 | 87.52 |
| November 22 | 14.56 | 21.73 |
| November 23 | 23.25 | 41.27 |
| November 24 | 47.80 | 101.48 |
| November 25 | 45.38 | 37.10 |
| Total | 749.09 | 376.09 |
Supply Distribution
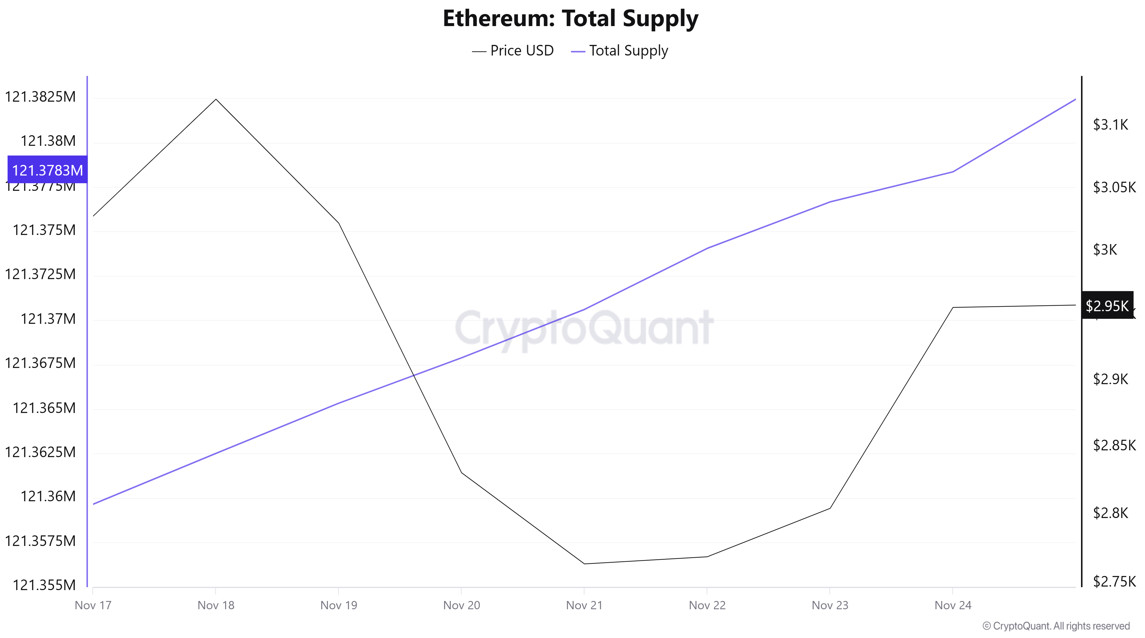
Total Supply: Reached 121,378,359 units, an increase of approximately 0.0462% compared to last week.
New Supply: The amount of ETH produced this week was 56,106.
Velocity: The velocity, which was 10.03 last week, reached 10.07 as of November 24.
| Wallet Category | 11/17/2025 | 11/24/2025 | Change (%) |
|---|---|---|---|
| 100 – 1k ETH | 8.4795M | 8.4106M | −0.8126% |
| 1k – 10k ETH | 11.7807M | 11.9204M | +1.1859% |
| 10k – 100k ETH | 22.3904M | 21.0555M | −5.9626% |
| 100k+ ETH | 4.145M | 4.3046M | +3.8493% |
According to the latest weekly data, the Ethereum wallet distribution showed a balanced but uncertain outlook. The total balance of wallets in the 100–1k ETH range showed a slight increase, indicating a limited accumulation trend in this segment. In contrast, addresses in the 1k–10k ETH range saw a decline, with partial unwinding prominent in this group. Wallets in the 10k–100k ETH band recorded a weekly increase, indicating that larger investors were buying, albeit to a limited extent. The most notable change was the decline in large wallets holding 100k+ ETH, suggesting that the trend of selling or distribution among high-volume addresses continued.
Exchange Supply Ratio
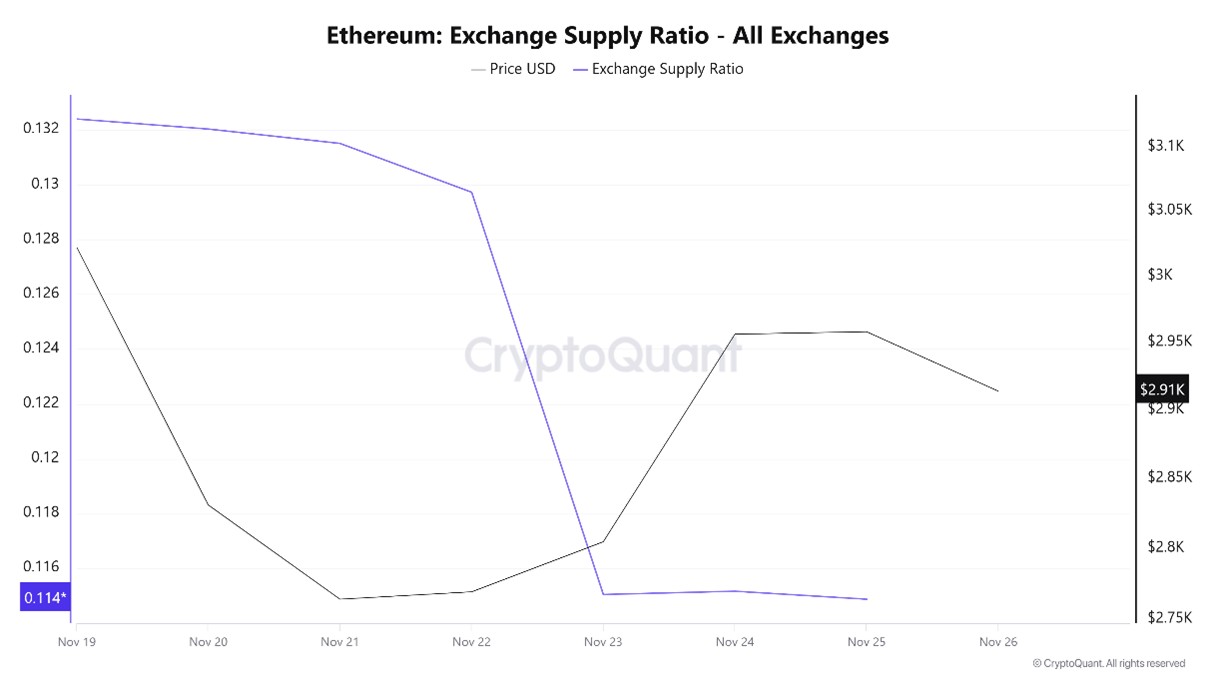
Between November 19 and November 26, the Ethereum Exchange Supply Ratio fell from 0.13203178 to 0.11487697. During this period, the price of Ethereum fell from $3,022 to $2,958. Particularly around November 23, when the price and Exchange Supply Ratio intersected, the correlation between the price and Exchange Supply Ratio turned positive. The decline in price indicates that the amount of Ethereum supplied to exchanges has decreased and that long-term investors are likely selling their Ethereum holdings. It appears that the Ethereum price may generally decline.
Exchange Reserve
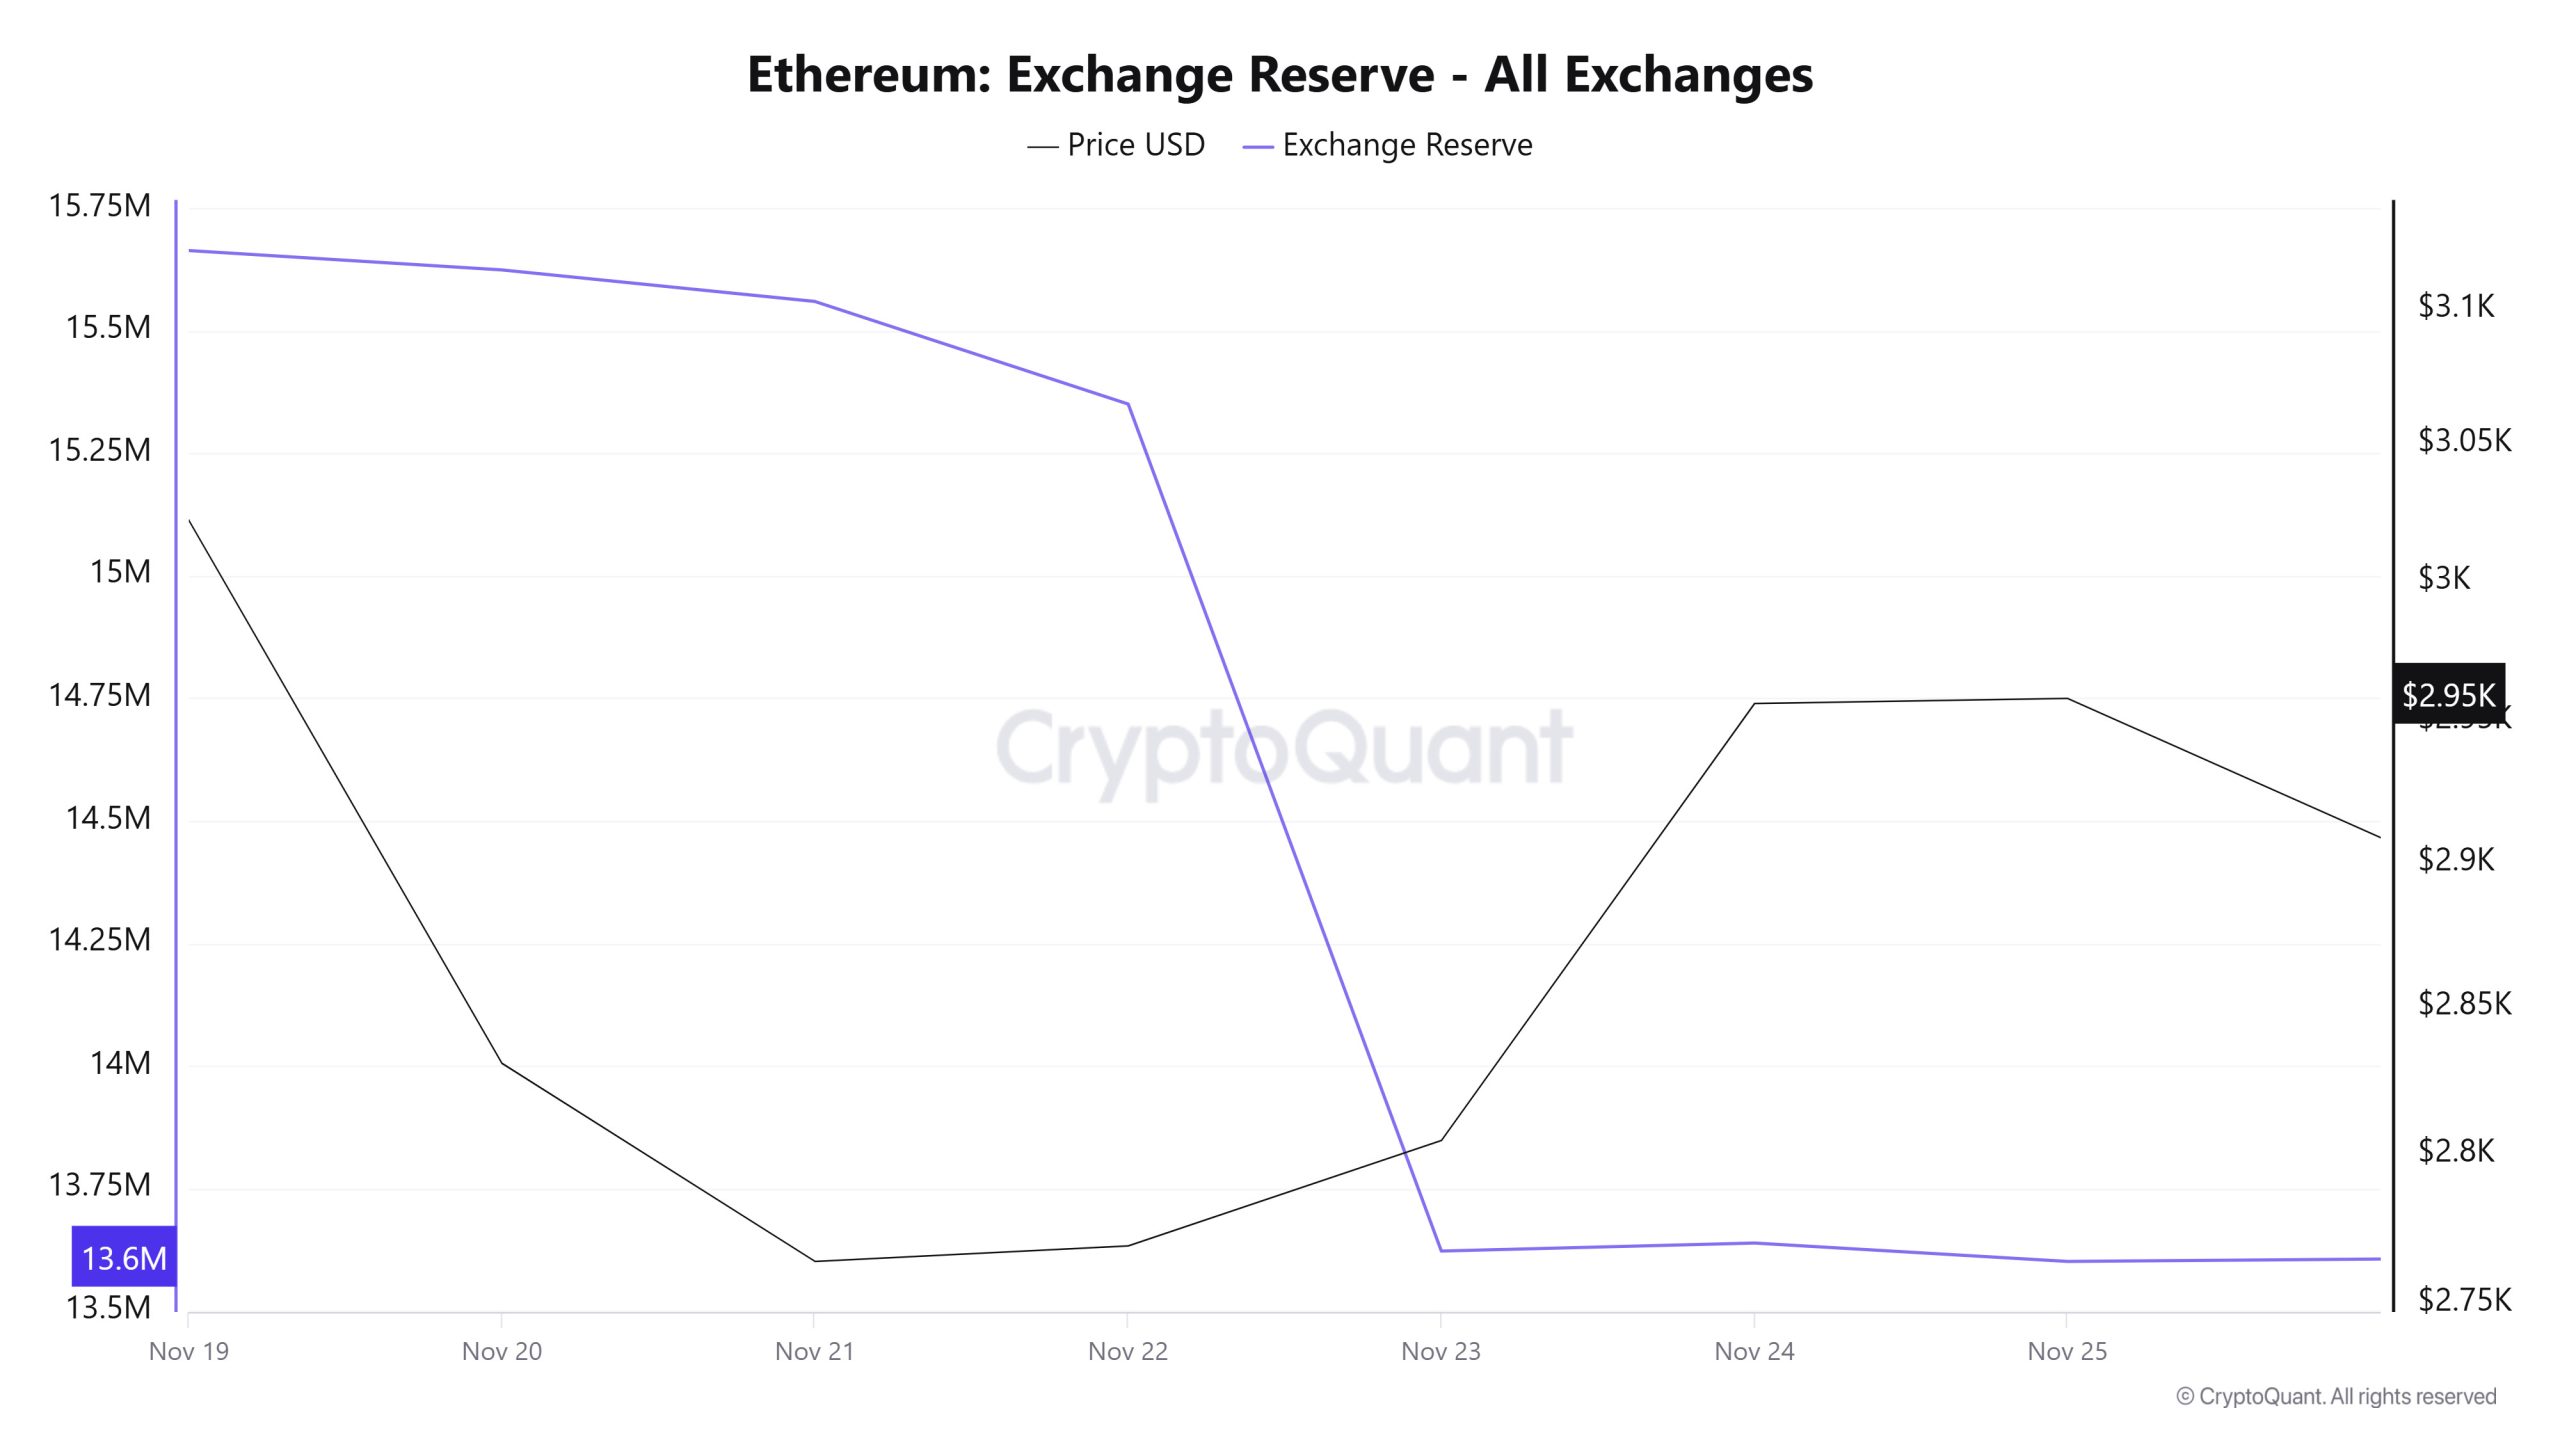
Between November 19-25, 2025, Ethereum reserves on exchanges declined from 15,606,031 ETH to 13,600,650 ETH, resulting in a significant net outflow of 2,005,381 ETH. During this period, reserves fell by approximately 12.85%, while the price of ETH declined from $3,129 to $2,958, losing 5.46% of its value. After the price of Ethereum fell below $2,800, the noticeable acceleration of outflows from exchanges was noteworthy. In particular, the outflow of approximately 1.73 million ETH on November 23 indicated that investors were quickly withdrawing their ETH from exchanges and moving it to safer areas rather than rushing to sell. The occurrence of such a large outflow during the price decline signaled that selling pressure was weakening and that investors were thinking more long-term and moving their positions off exchanges. The fact that the ETH price began to recover during the period of increased outflows also indicated that the supply on exchanges was tightening, which had a positive effect on the ETH price. Continued outflows from exchanges and the resulting tightening of supply on exchanges may continue to have a positive impact on the ETH price.
| Date | Exchange Inflow | Exchange Outflow | Exchange Netflow | Exchange Reserve | ETH Price ($) |
|---|---|---|---|---|---|
| Nov 19 | 1,207,677 | 1,149,554 | 58,123 | 15,664,153 | 3,129 |
| Nov 20 | 1,222,164 | 1,261,745 | -39,580 | 15,624,573 | 2,831 |
| Nov 21 | 1,392,158 | 1,456,608 | -64,450 | 15,560,123 | 2,764 |
| Nov 22 | 515,418 | 724,676 | -209,258 | 15,350,866 | 2,769 |
| Nov 23 | 373,072 | 2,102,166 | -1,729,094 | 13,621,772 | 2,805 |
| Nov 24 | 1,135,878 | 1,119,461 | 16,417 | 13,638,189 | 2,956 |
| Nov 25 | 866,889 | 904,428 | -37,539 | 13,600,650 | 2,958 |
Fees and Revenues
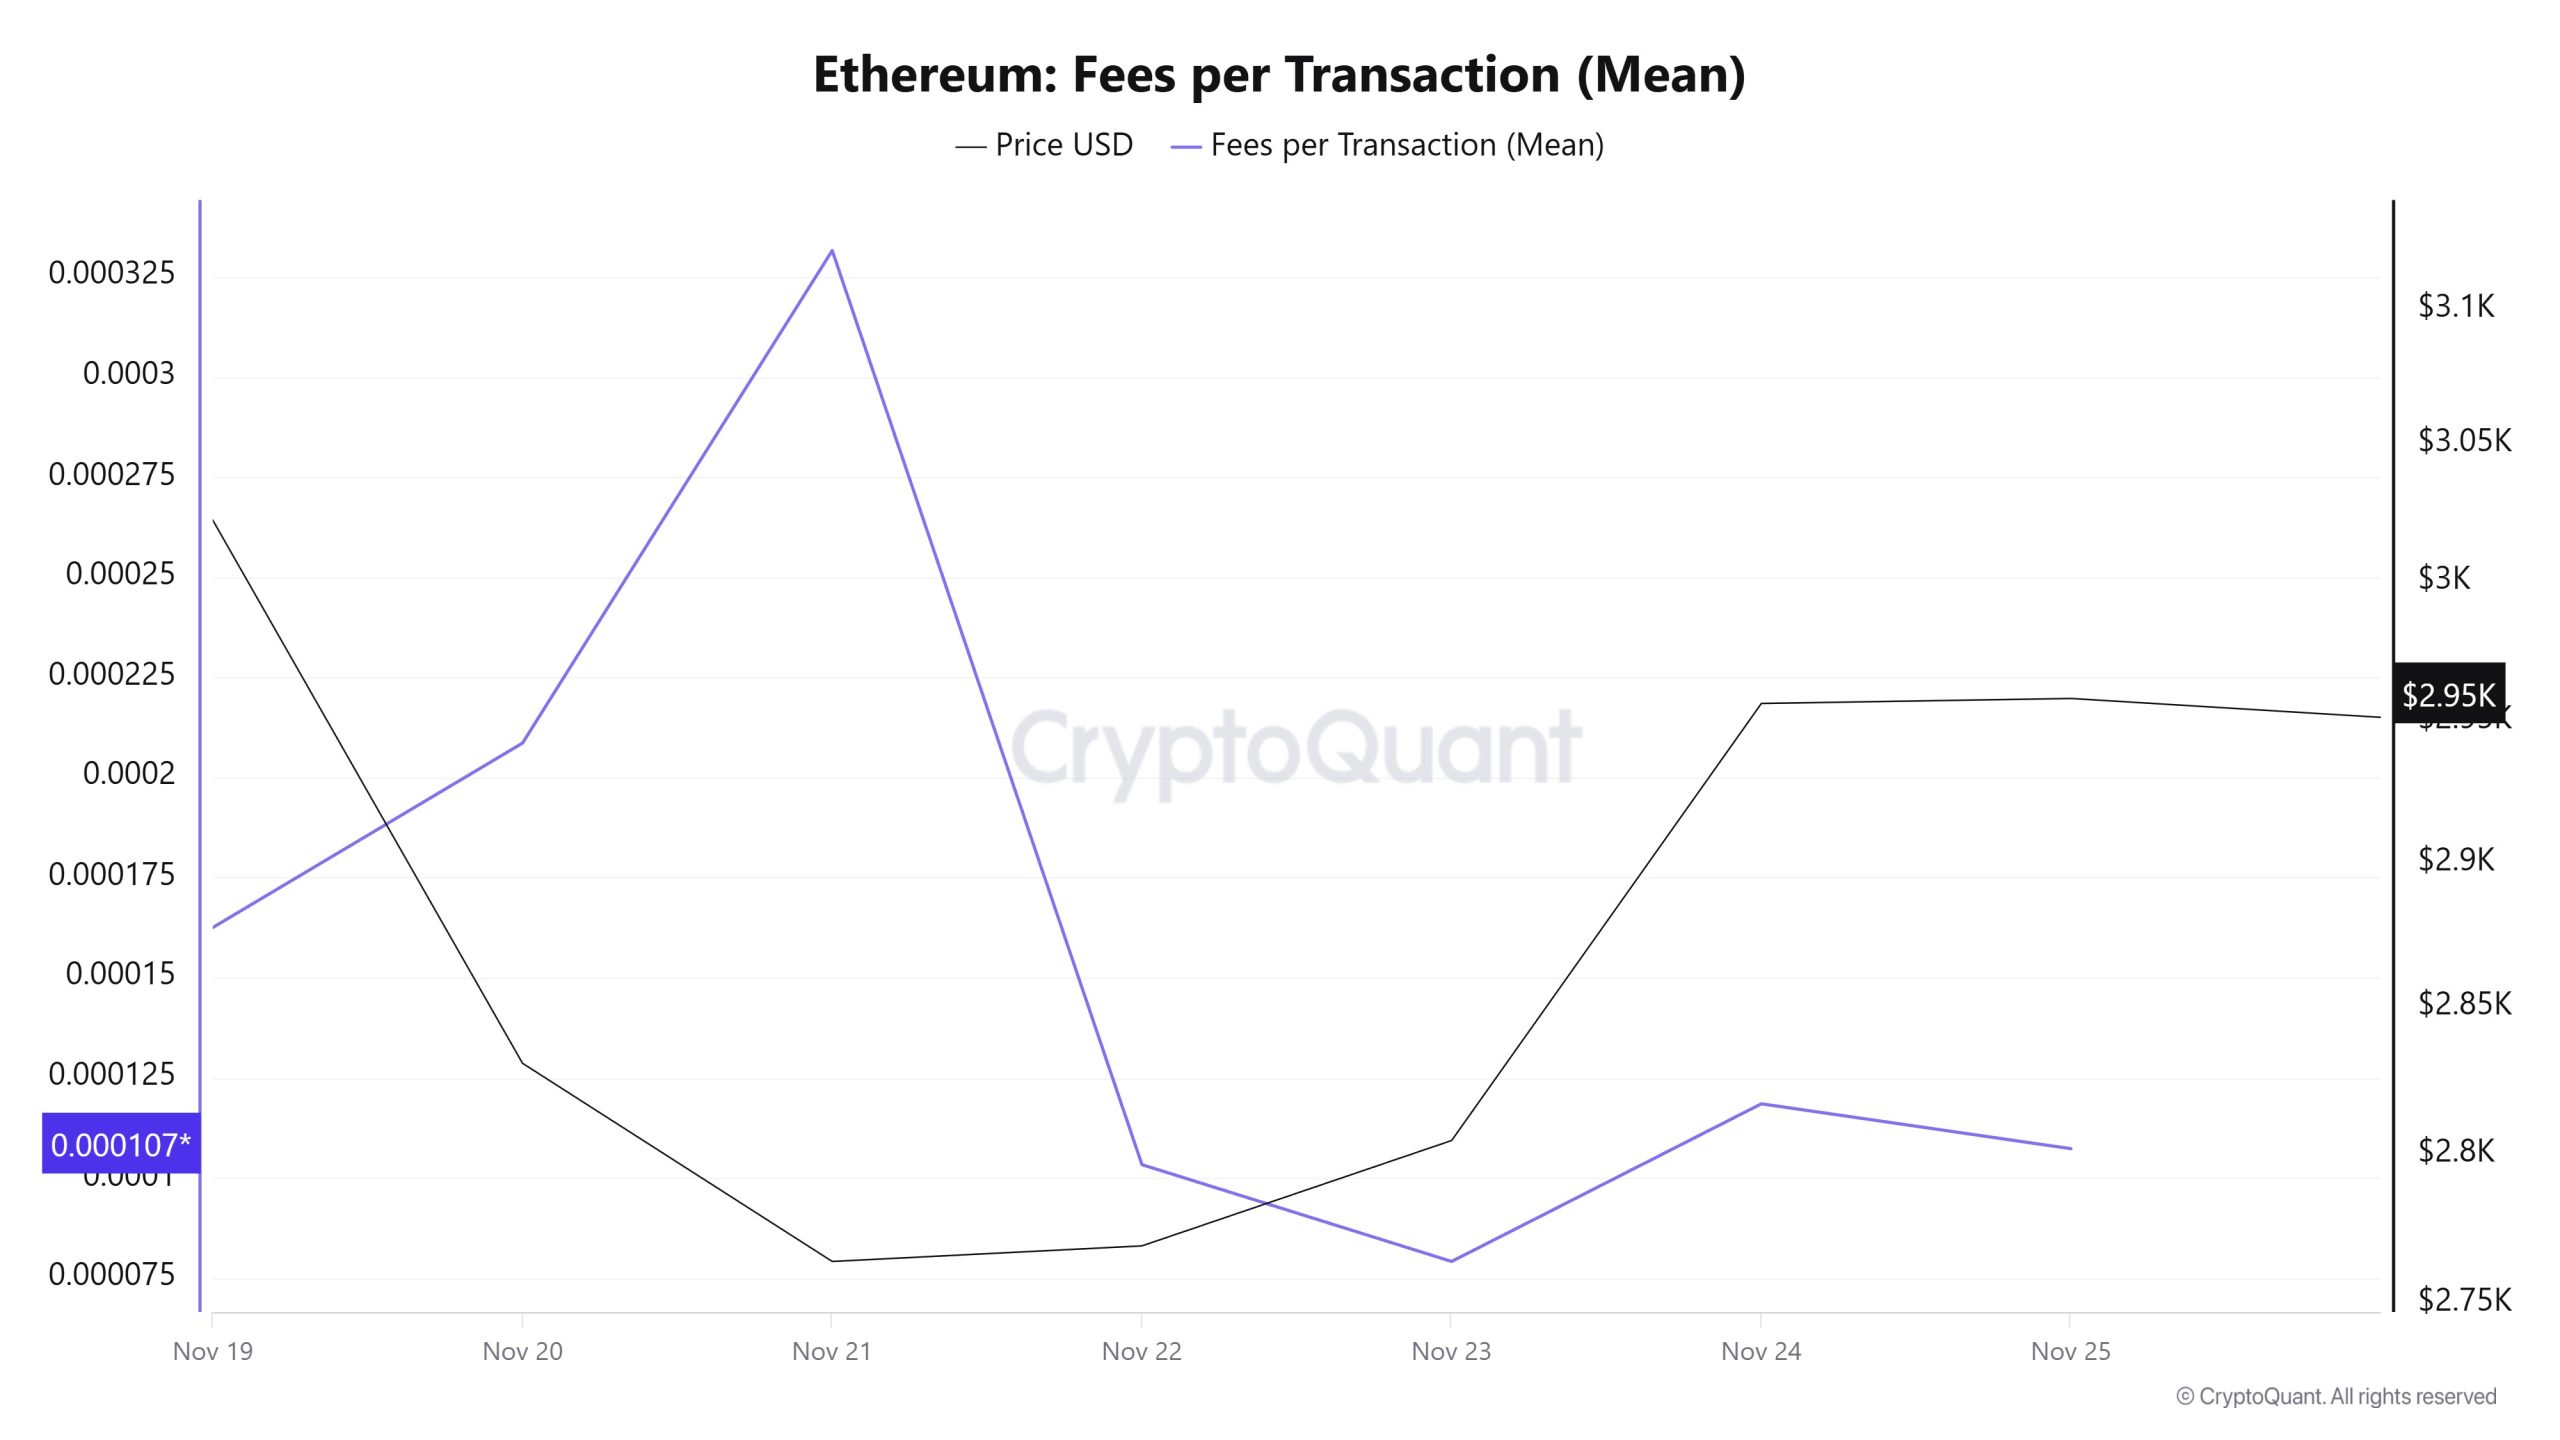
When examining the Ethereum Fees per Transaction (Mean) data for the period between November 19-25, it is observed that on November 19, the first day of the week, the indicator reached a level of 0.000162478850484376.
A fluctuating trend was observed until November 23, and on this date, the indicator recorded the lowest value of the week at 0.000079091176115915.
In this context, as of November 23, a significant increase in Ethereum price volatility resulted in the indicator regaining momentum and following a positive trend due to the impact of price volatility.
On November 25, the last day of the weekly period, the indicator closed the week at 0.000107246062423551 .
Ethereum: Fees (Total)
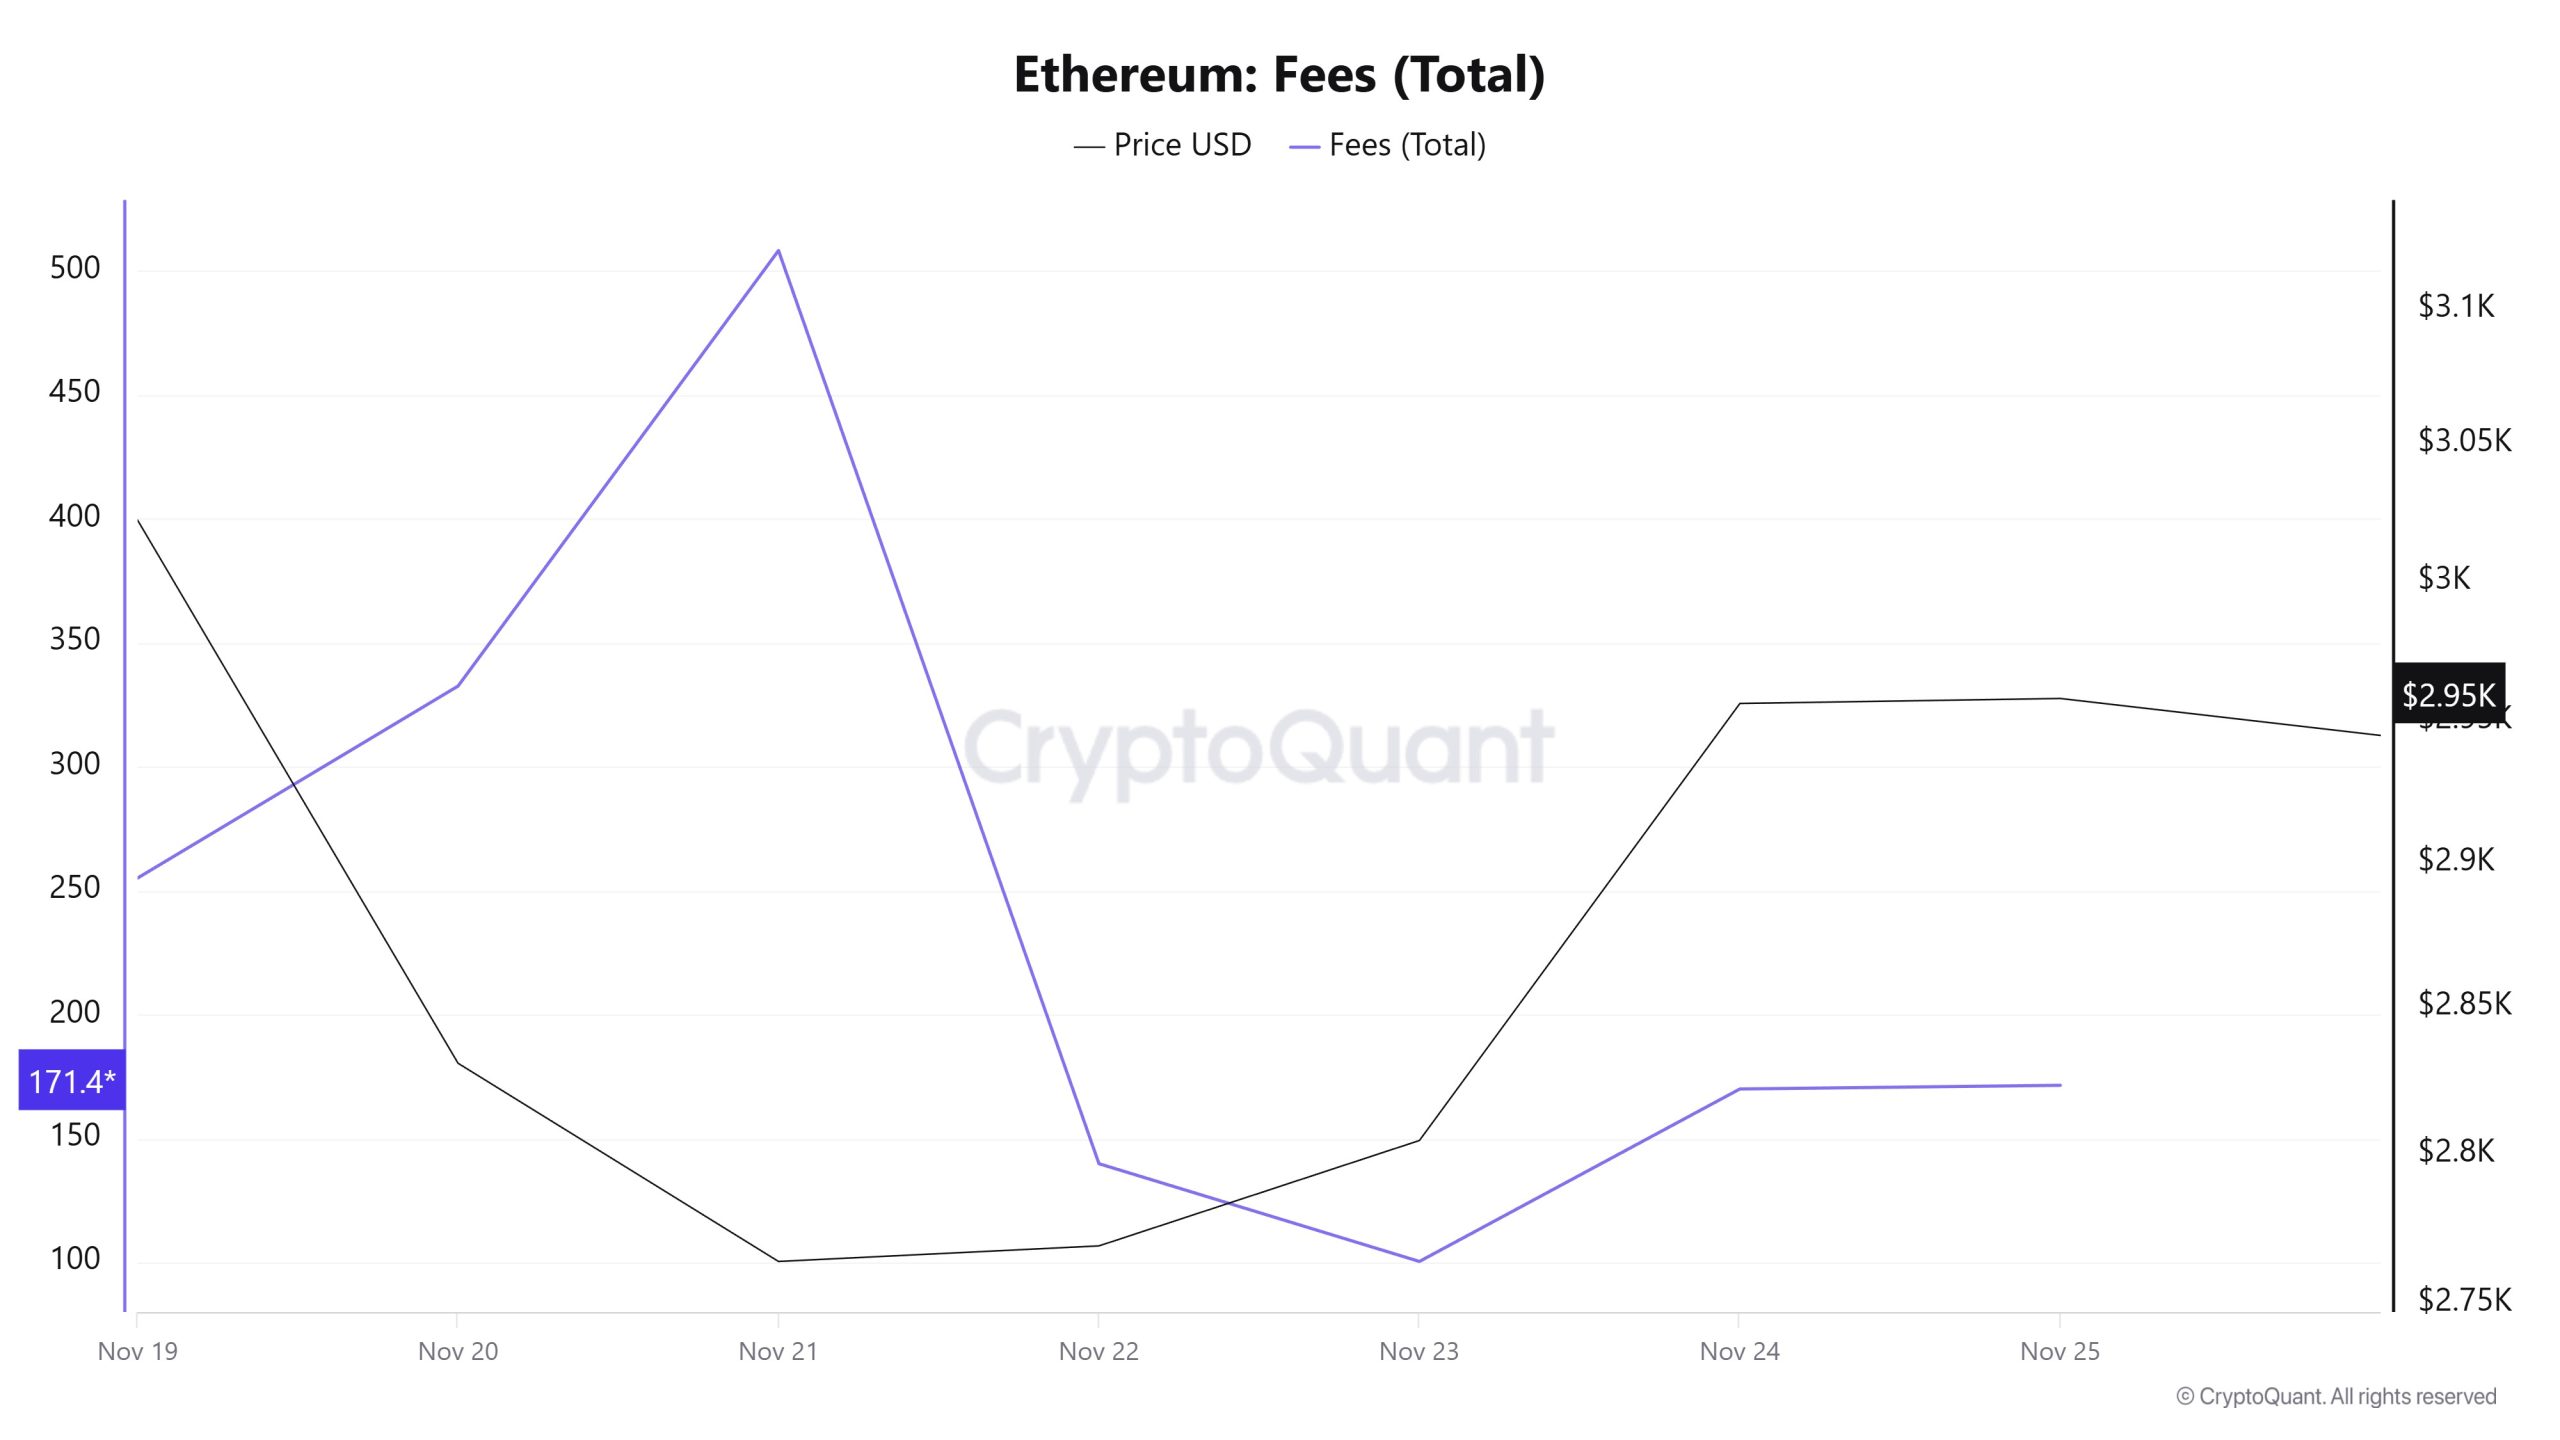
Similarly, when examining the Ethereum Fees (Total) data between November 19-25, it is seen that on November 19, the first day of the week, the indicator stood at 255.07505993887096.
A fluctuating trend was observed until November 23, and on this date, the indicator recorded the week’s lowest value at 100.35792337054697.
In this context, as of November 23, a significant increase in Ethereum price volatility resulted in the indicator regaining momentum and following a positive trend due to the impact of price volatility.
On November 25, the last day of the weekly period, the indicator closed the week at 171.4376568568556.
Blocks Mined
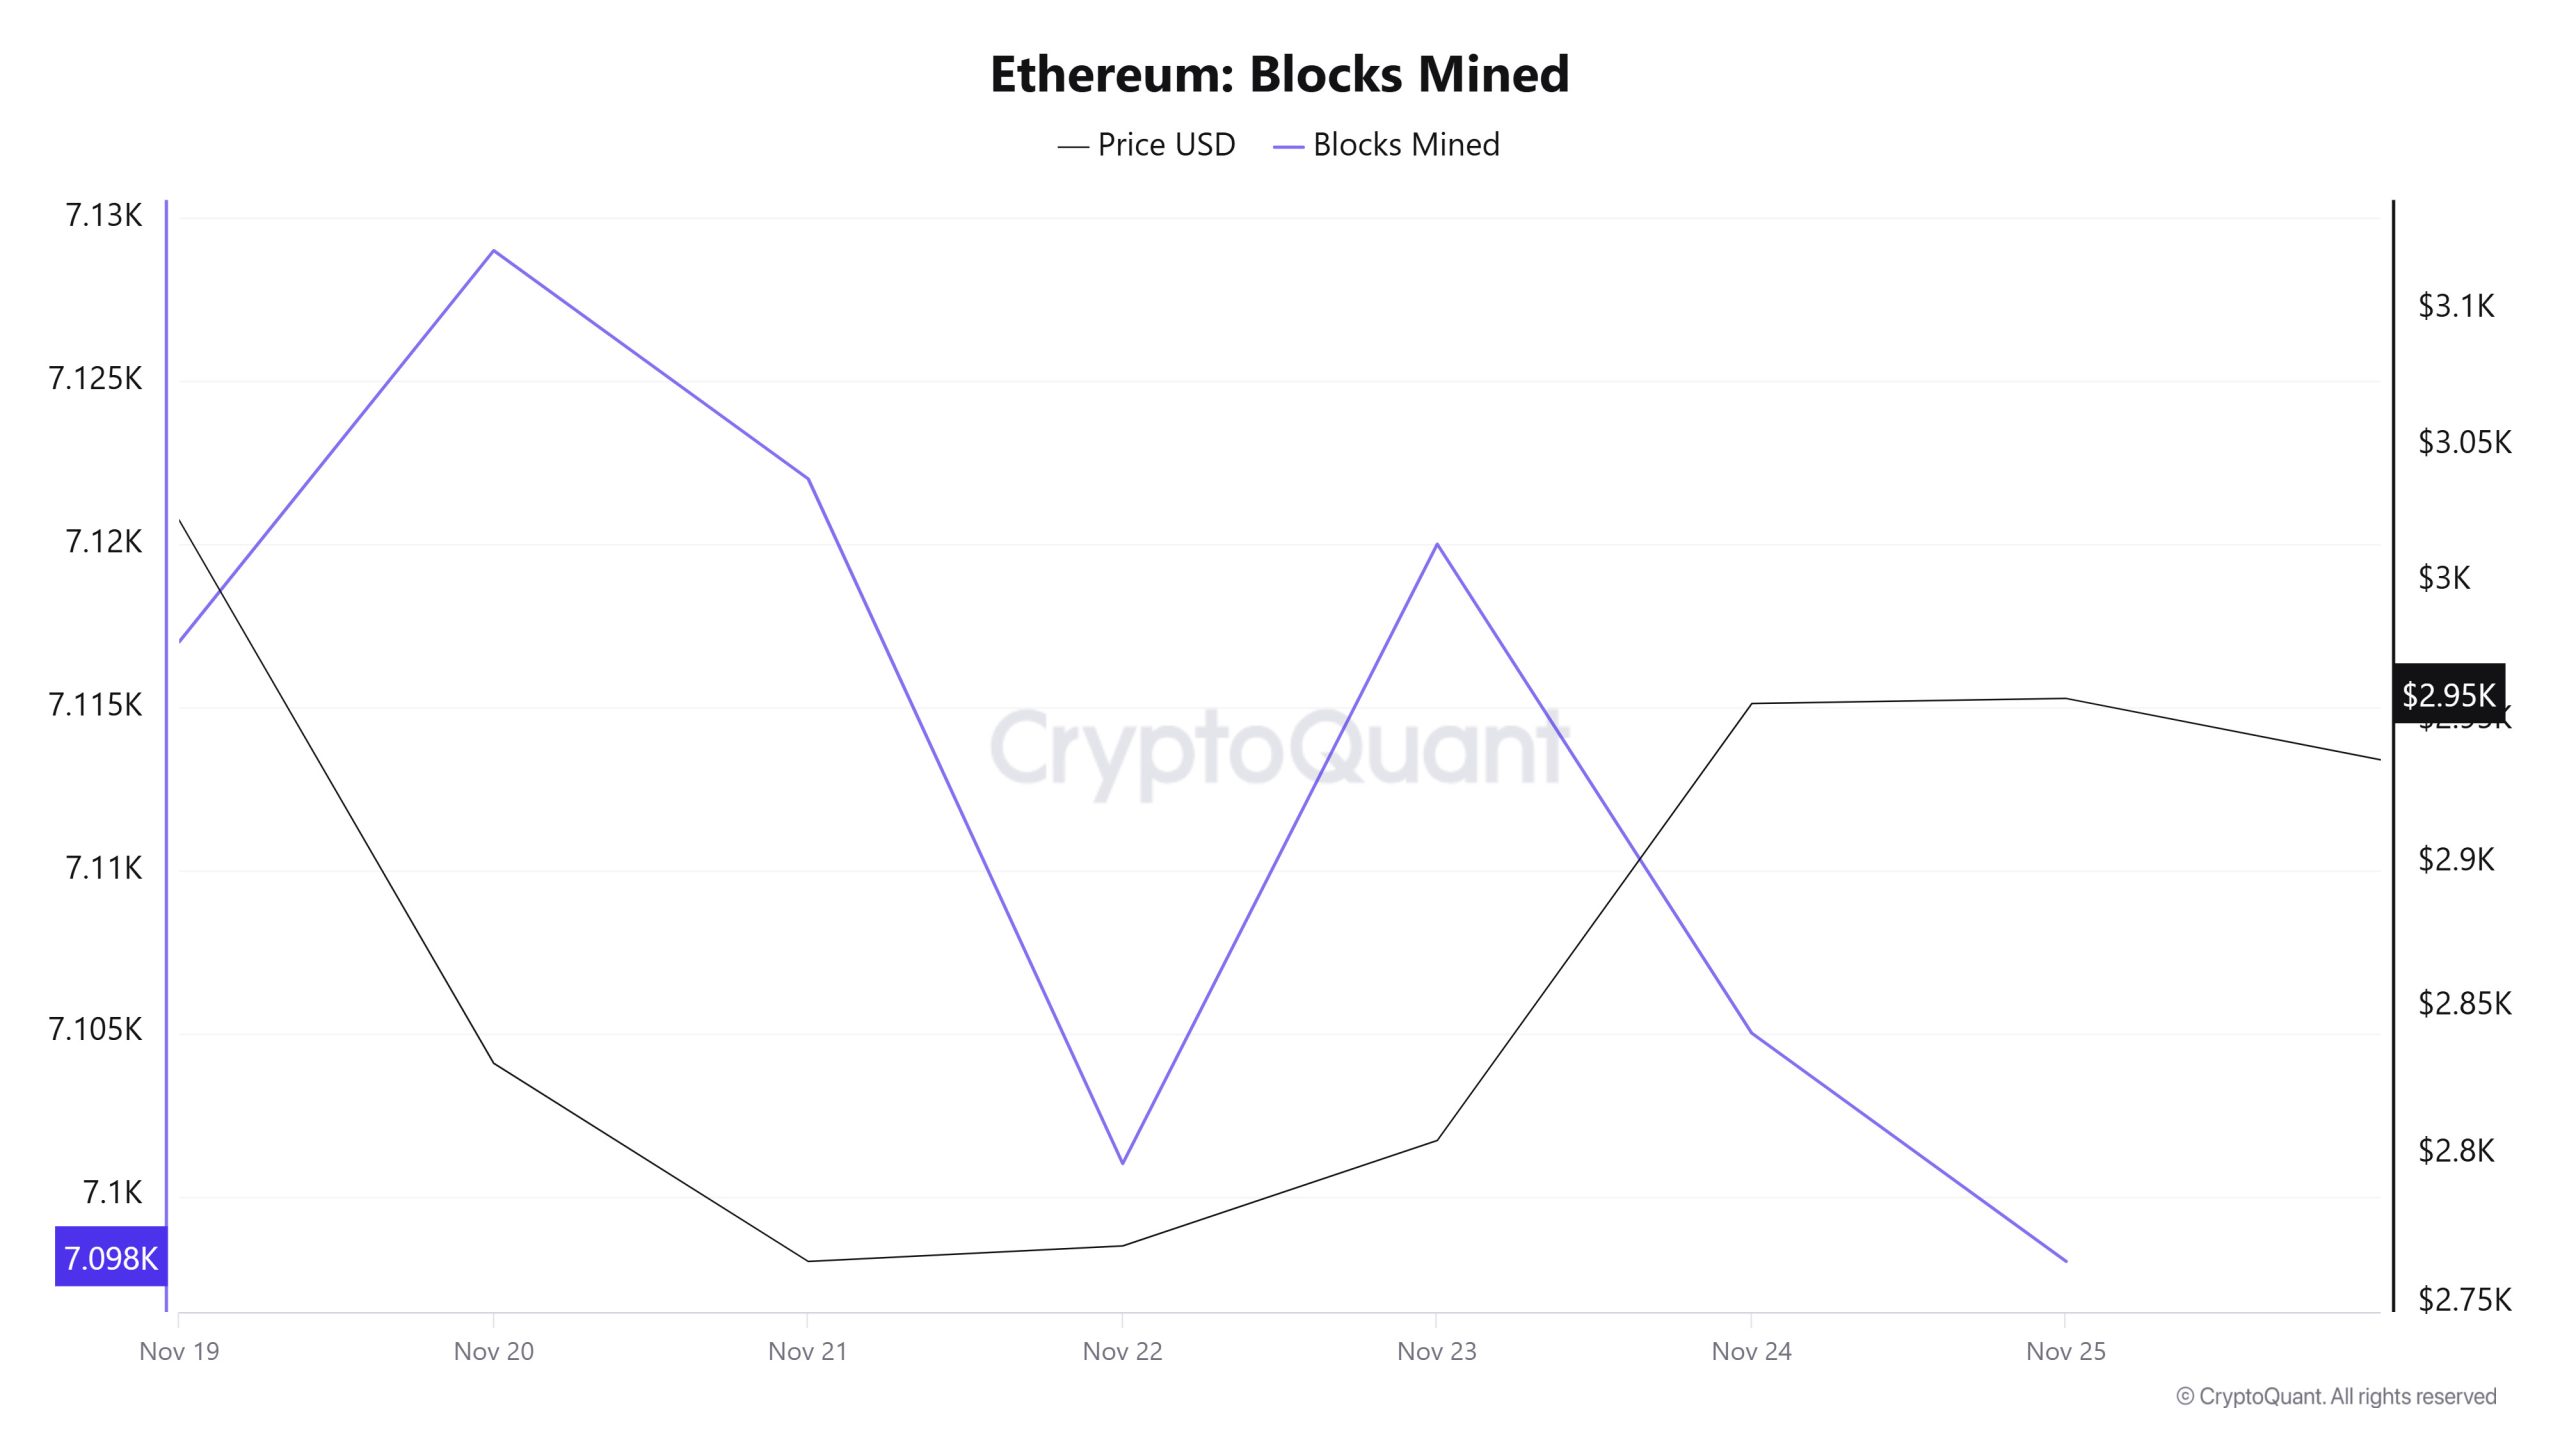
When examining Ethereum block production data between November 19 and 25, a slight decrease was observed throughout the week. While 7,117 blocks were produced on November 19, this number declined to 7,098 by November 25.
During the period in question, a time-dependent correlation structure was observed between the Ethereum price and the number of blocks produced. However, the general trend reveals that a negative correlation between these two variables is dominant.
Block Size
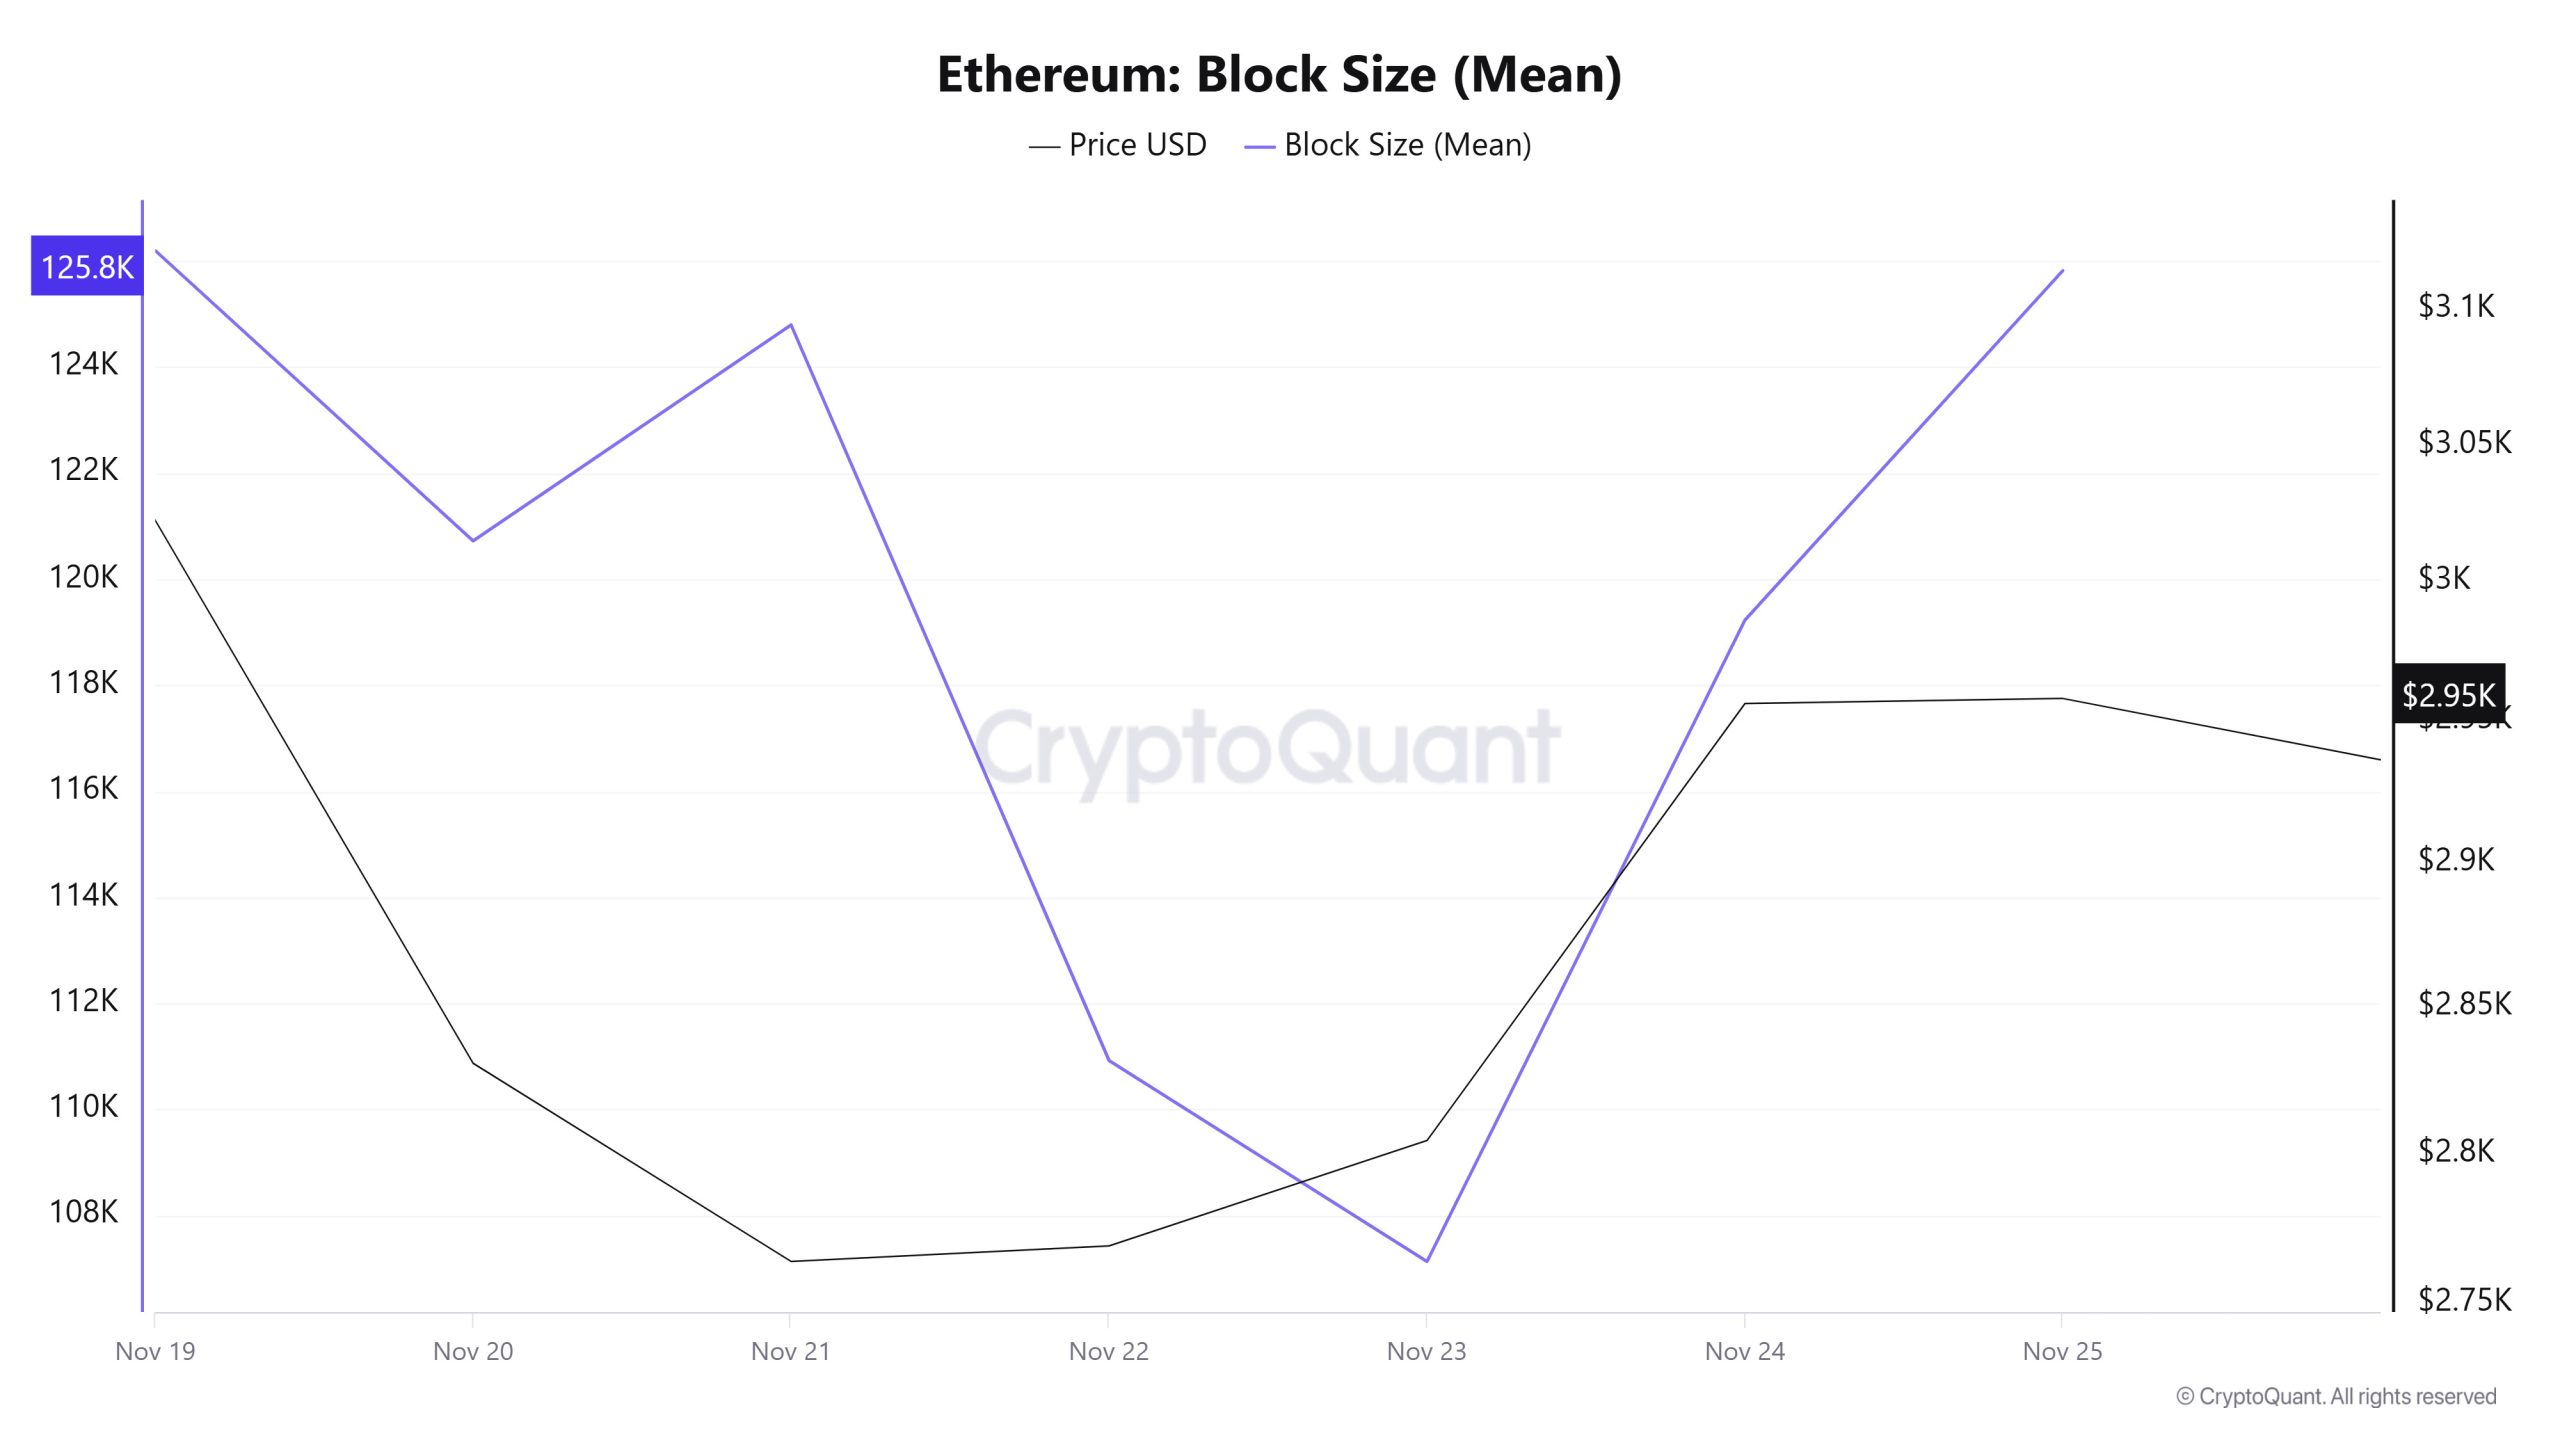
When examining Ethereum block size data between November 19 and 25, a decrease was observed throughout the week. While the average block size was measured at 126,195 bytes on November 19, this value declined to 125,816 bytes as of November 25.
During the relevant period, a time-dependent correlation structure was observed between block size and Ethereum price. However, the general trend indicates that a negative correlation between these two variables is dominant.
Block Interval
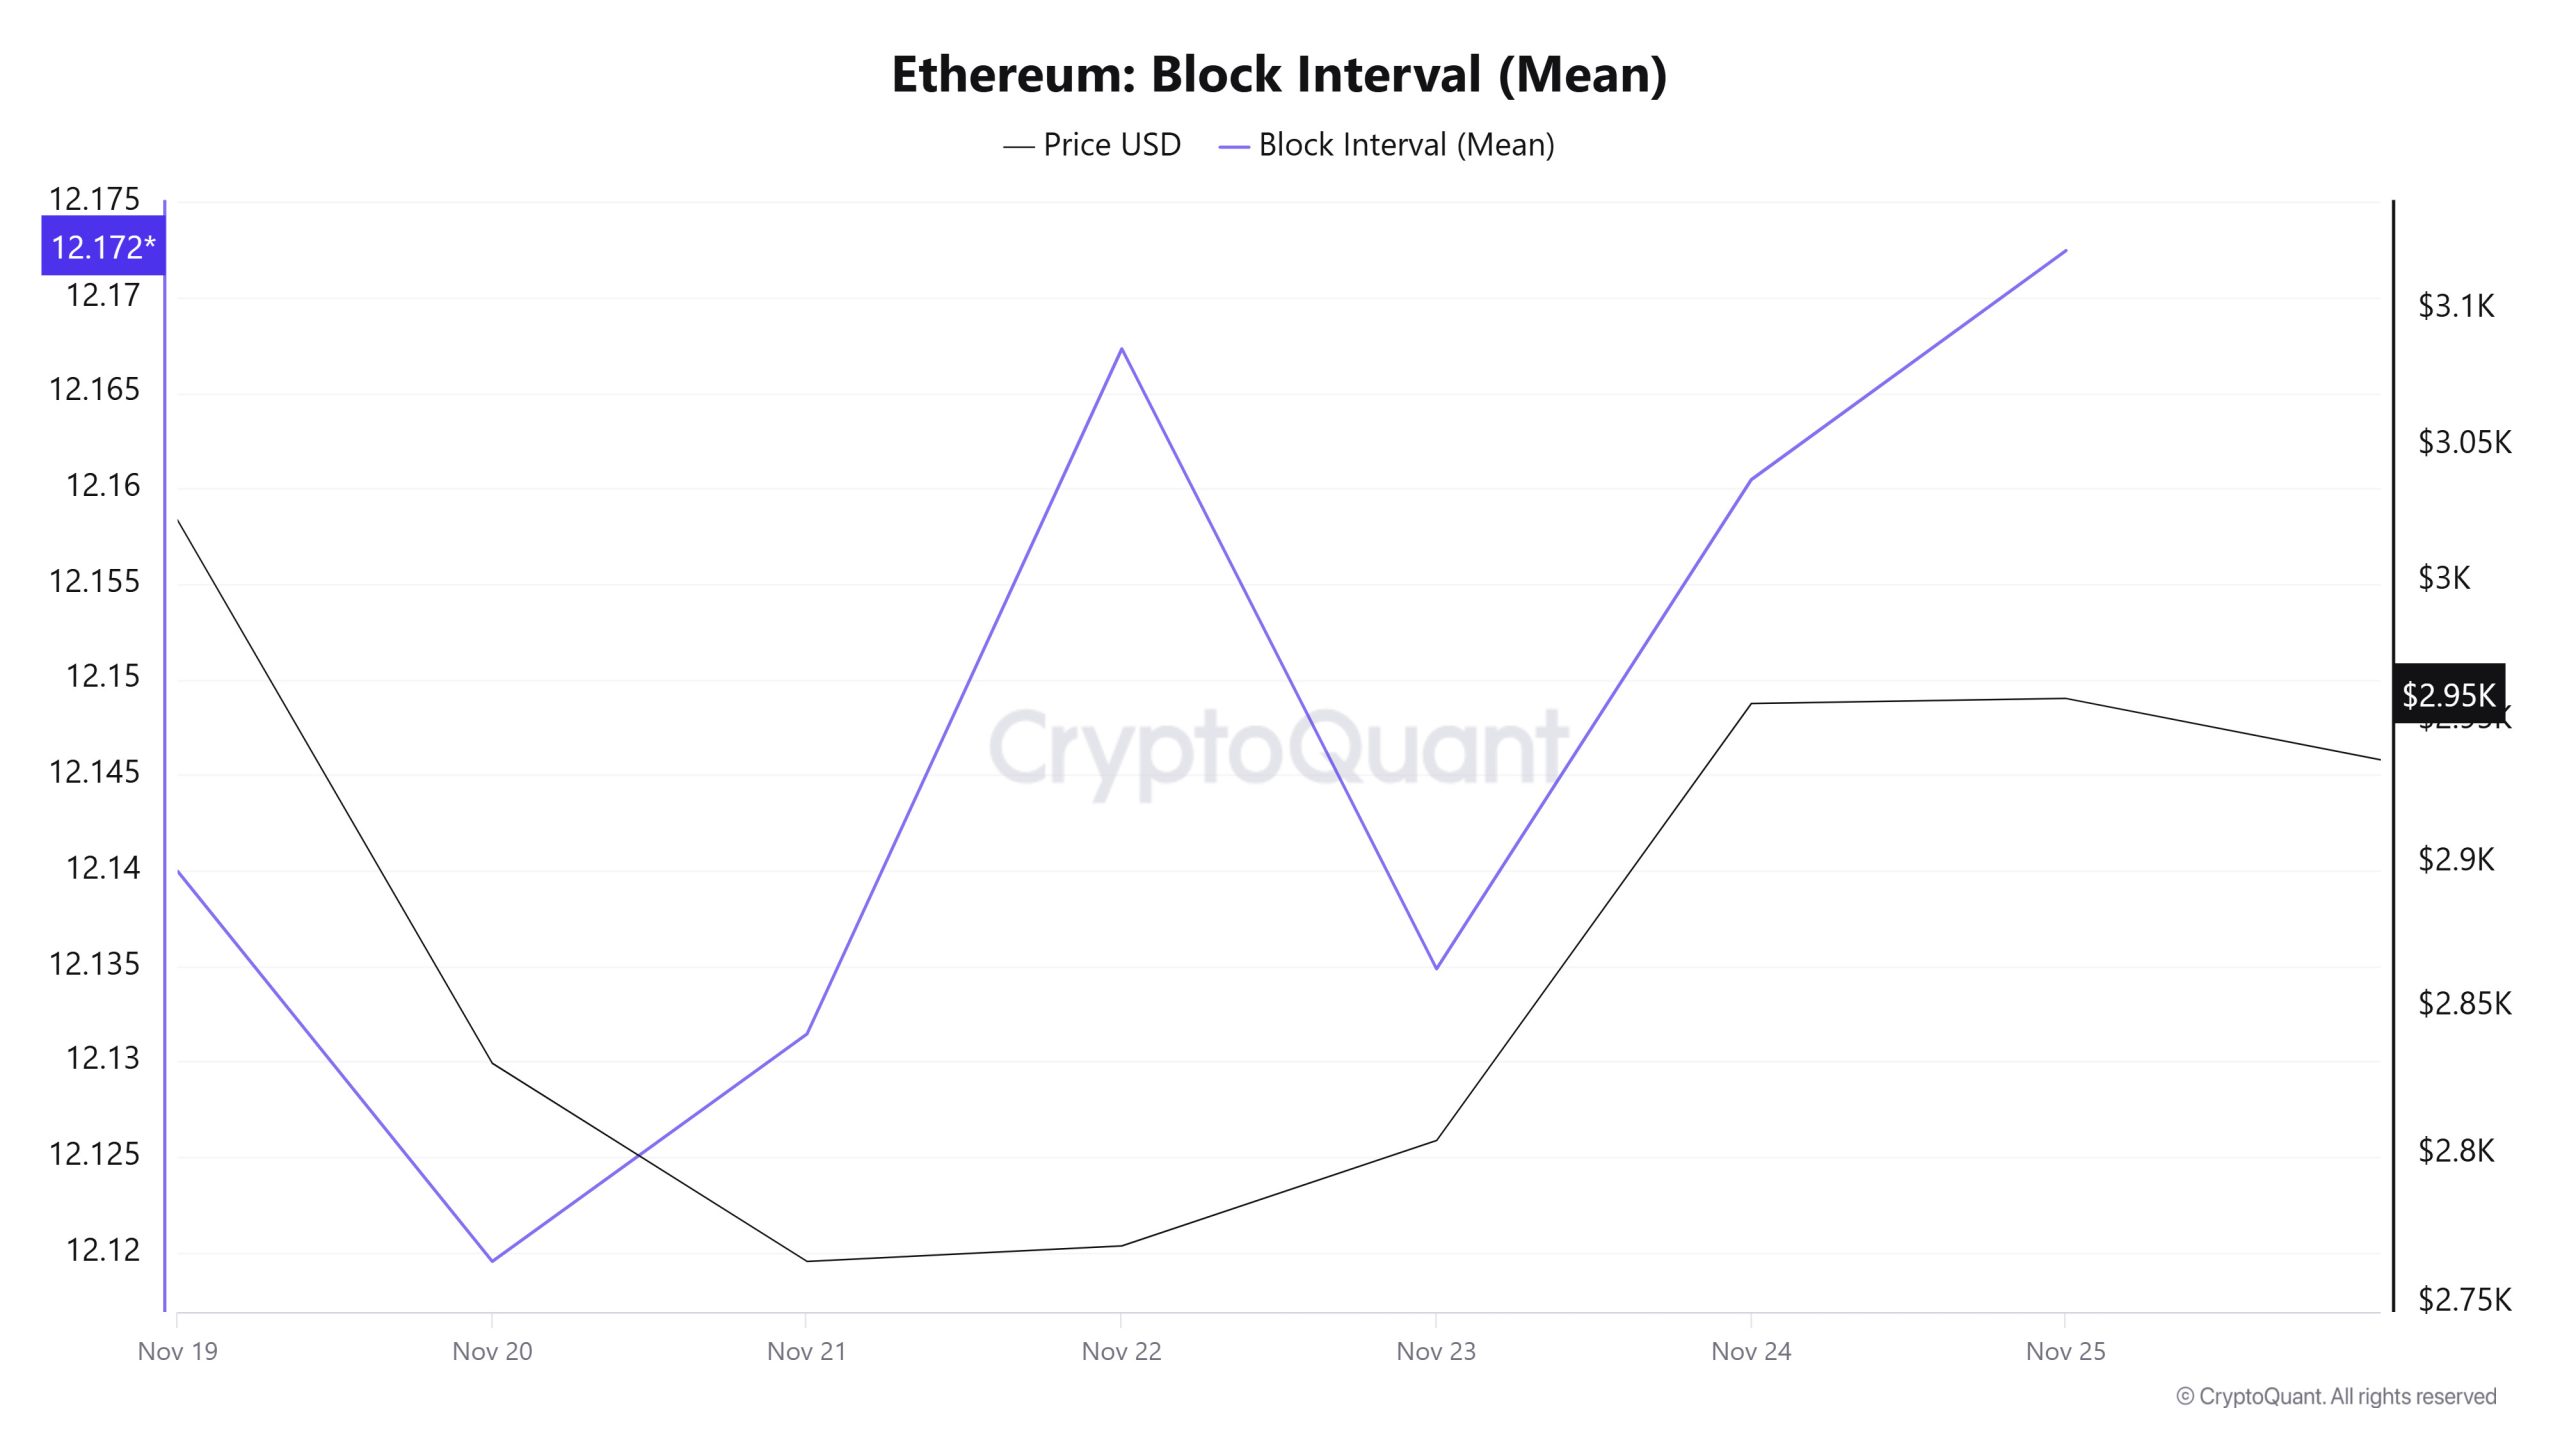
When examining the Ethereum block time between November 19 and 25, an increase was observed throughout the week. While the average block time was recorded as 12.14 seconds on November 19, this time increased to 12.17 seconds as of November 25.
During this period, a time-dependent correlation structure was observed between the Ethereum block time and price movement. However, the general trend indicates that a negative correlation between these two variables is dominant.
Transaction
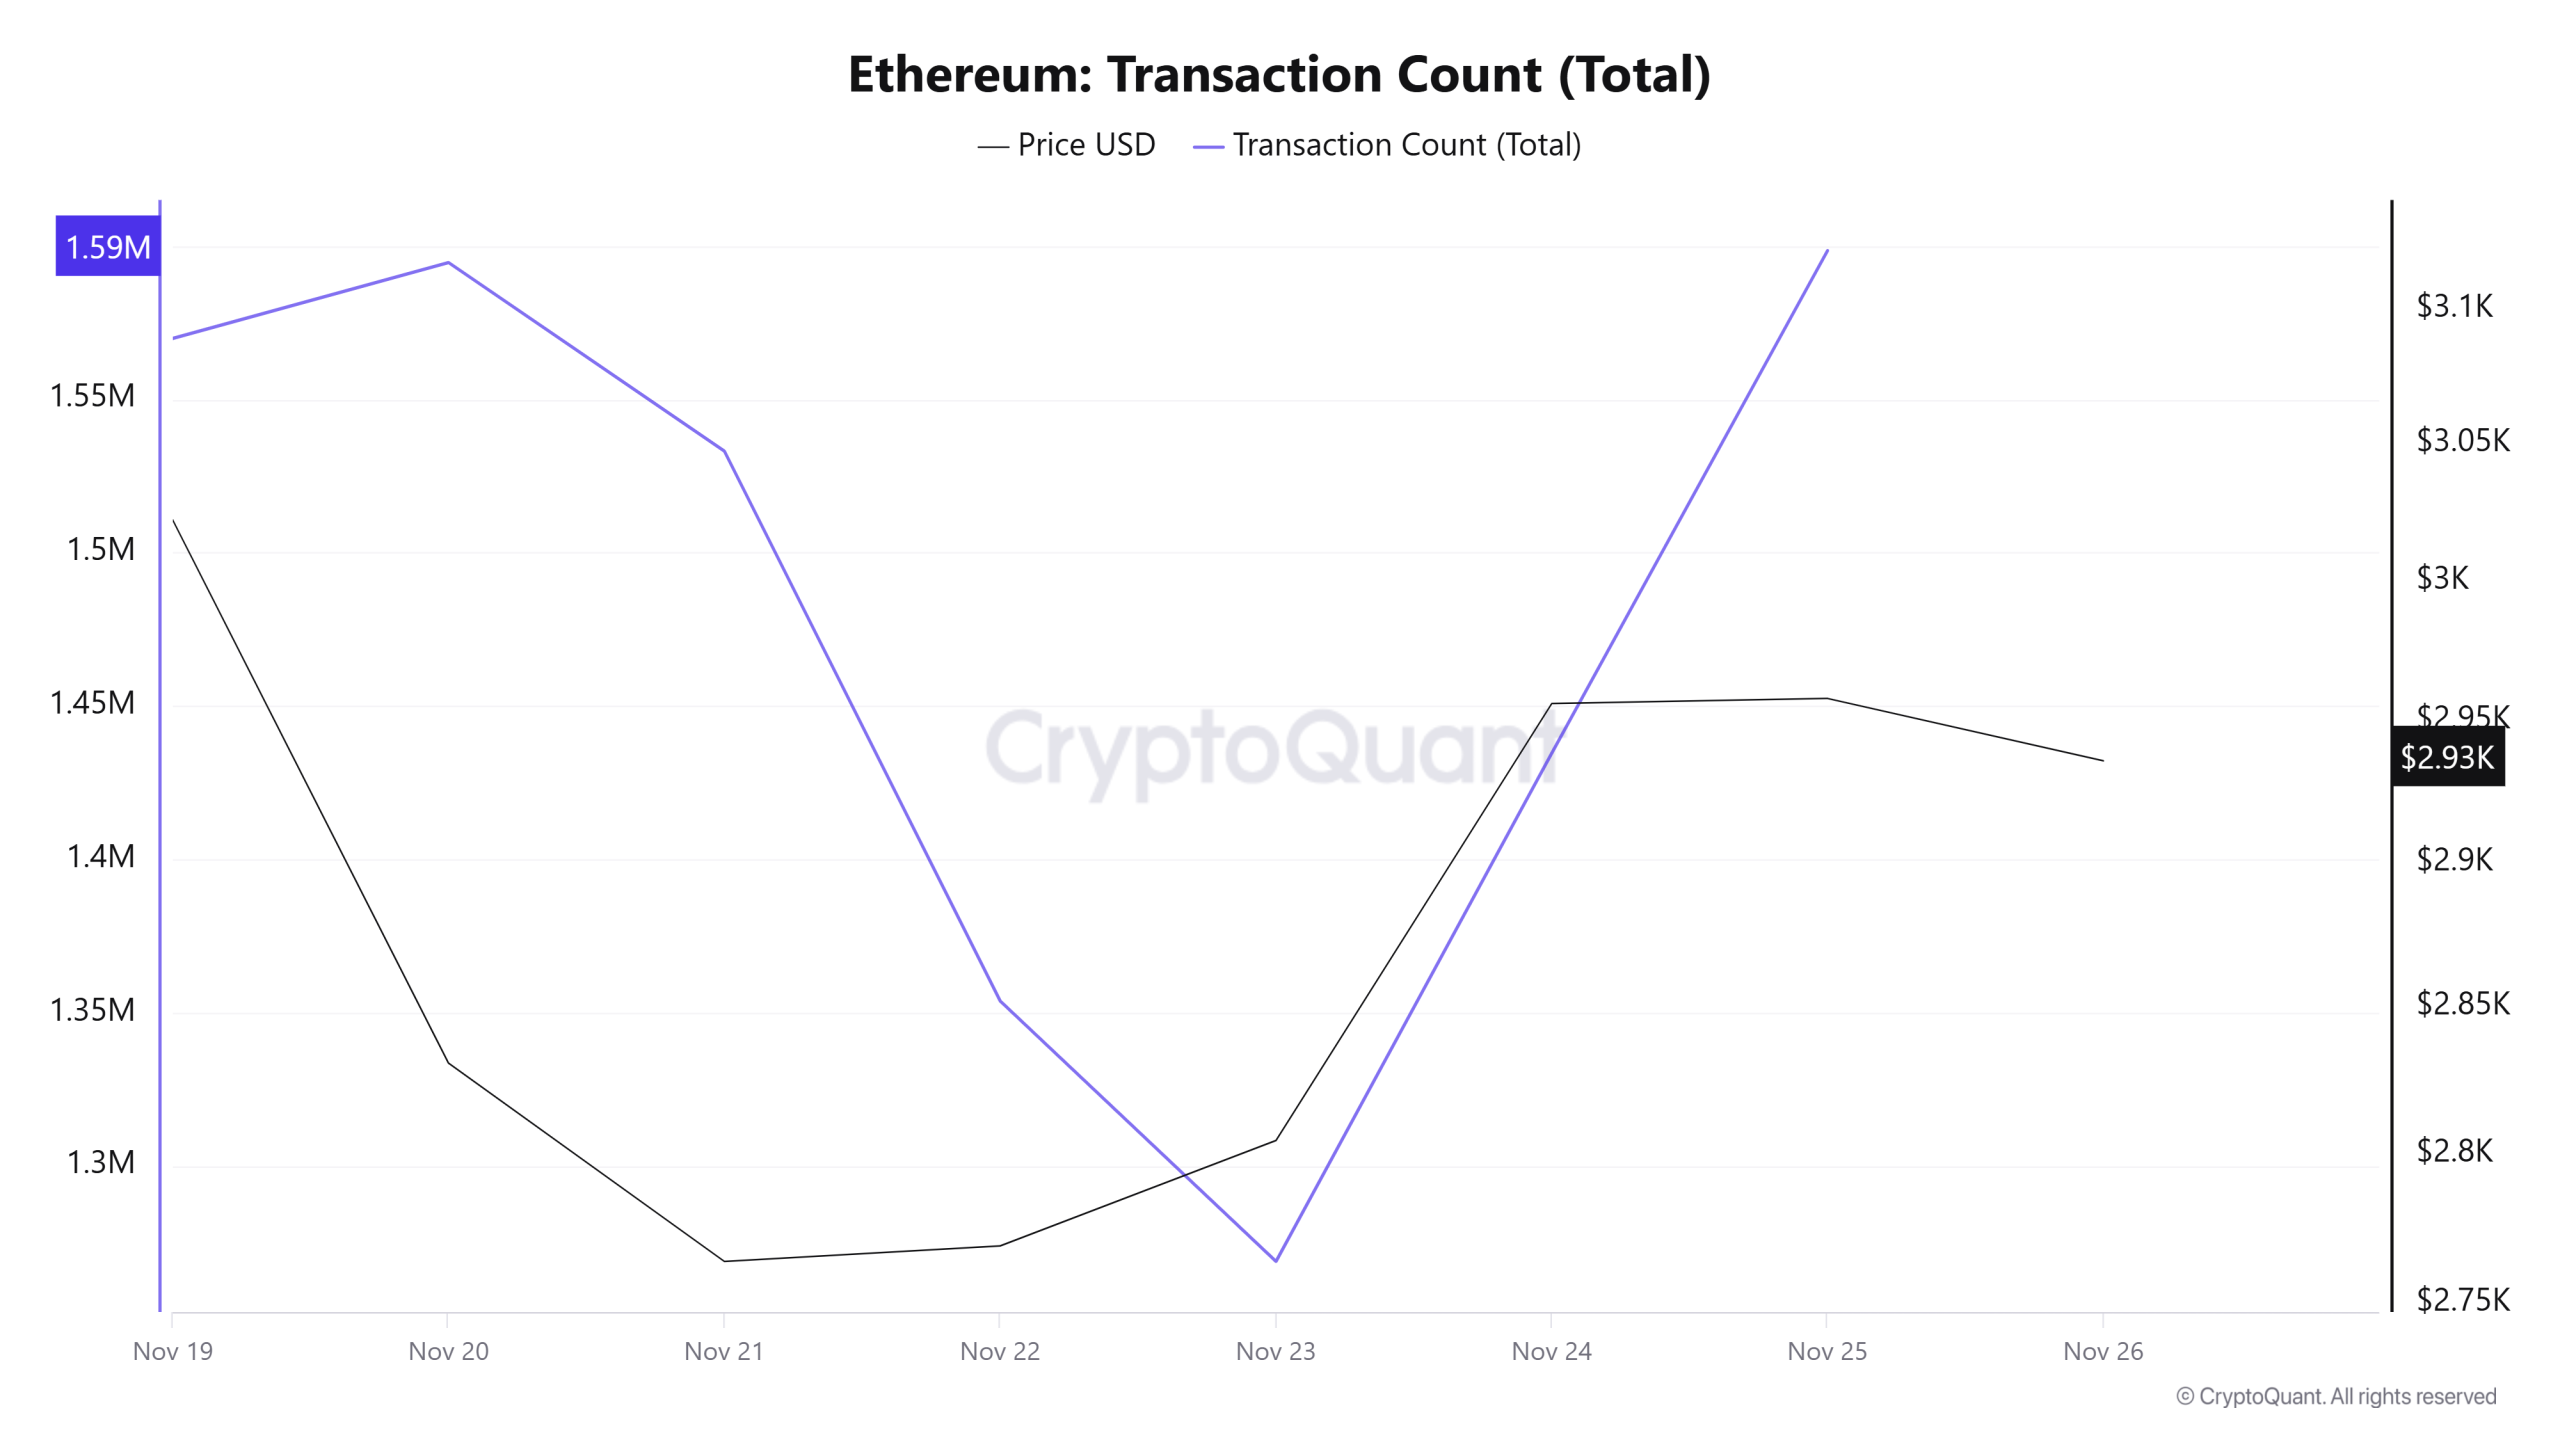
Last week, a total of 10,471,504 transactions were executed on the Ethereum network, while this week the number of transactions decreased by approximately 1.13% to 10,353,621. The highest weekly transaction count was recorded on November 25 at 1,598,545, while the lowest was on November 23 at 1,268,889. The correlation between transaction volume and price remained balanced throughout the week. However, the lower network activity compared to the previous period indicates a weakening transaction momentum on the Ethereum network.
Tokens Transferred
The total amount of ETH transferred between last week and this week increased by approximately 18%, from 14,749,071 to 17,416,974. The highest transfer during the period occurred on November 23 with 4,735,831 ETH, while the lowest transfer was on November 22 with 1,071,956 ETH.
The fluctuations of around 400% seen in daily transfers, combined with the decrease in the number of transactions and the increase in the amount transferred, indicate that, on average, more ETH is moving in a single transaction on the Ethereum network. In light of this data and considering the price movements during the period, if the price is assumed to be trending downward, it can be inferred that whales are intensifying their Ethereum sales. This inference only makes sense when evaluated solely through on-chain data.
Estimated Leverage Ratio

The metric has been declining since the beginning of the 7-day period. Starting at 0.712 on November 19, the ELR (Estimated Leverage Ratio) then rose slightly, reaching its peak on November 20 at 0.716. At the time of writing, the metric stands at 0.668, indicating a decline in investor appetite. A higher ELR implies that participants are more willing to take on risk and typically indicates bullish conditions or expectations. It should be noted that these increases may also stem from a decline in reserves. Looking at Ethereum reserves, there were 15.66 million reserves at the beginning of the process, but this figure declined further during the rest of the process and currently stands at 13.60 million. At the same time, Ethereum’s Open Interest was $38.62 billion at the beginning of the process. As of now, volume has declined during the process, and the open interest value has fallen to $35.23 billion. Along with all this data, the ELR metric has steadily declined throughout the process. The asset’s price, along with all this data, fluctuated between $3,150 and $2,650. As of now, investors’ and traders’ risk appetite appears to have decreased. Consequently, the decrease in open interest data seen throughout the process, along with the decline in reserves, indicates a decrease in risk appetite. The decrease in the ELR ratio also indicates that trading volume has decreased much more than reserves, showing us that fear prevails in the market.
ETH Onchain Overall
| Metric | Positive 📈 | Negative 📉 | Neutral ➖ |
|---|---|---|---|
| Active Addresses | ✓ | ||
| Total Value Staked | ✓ | ||
| Derivatives | ✓ | ||
| Supply Distribution | ✓ | ||
| Exchange Supply Ratio | ✓ | ||
| Exchange Reserve | ✓ | ||
| Fees and Revenues | ✓ | ||
| Blocks Mined | ✓ | ||
| Transaction | ✓ | ||
| Estimated Leverage Ratio | ✓ |
*The metrics and guidance provided in the table do not alone explain or imply any expectation regarding future price changes in any asset. Digital asset prices can fluctuate based on numerous variables. The on-chain analysis and related guidance are intended to assist investors in their decision-making process, and basing financial investments solely on the results of this analysis may lead to unfavorable outcomes. Even if all metrics produce positive, negative, or neutral results simultaneously, the expected outcomes may not materialize depending on market conditions. It would be beneficial for investors reviewing the report to take these warnings into consideration.
Legal Notice
The investment information, comments, and recommendations contained in this document do not constitute investment advisory services. Investment advisory services are provided by authorized institutions on a personal basis, taking into account the risk and return preferences of individuals. The comments and recommendations contained in this document are of a general nature. These recommendations may not be suitable for your financial situation and risk and return preferences. Therefore, making an investment decision based solely on the information contained in this document may not result in outcomes that align with your expectations.
NOTE: All data used in Ethereum on-chain analysis is based on CryptoQuant.