
June 23 – 30, 2025 – Weekly Technical Analysis Report
BTC/USDT
We left behind a busy agenda last week. While the escalating Israeli-Iranian conflict in the Middle East put global markets under pressure, diplomatic efforts and military threats continue to play out simultaneously. In an environment where Iran targeted Israeli command centers and approved the closure of the Strait of Hormuz, the June 23rd deadline for possible negotiations with the US came to the fore. On the other hand, while the US Federal Reserve kept interest rates unchanged, Chairman Powell drew attention to the uncertainty created by tariffs; Trump demanded Powell’s resignation if there is no interest rate cut. On the crypto side, BTC reached a new threshold in institutional demand with Strategy’s massive purchase. While the basic 10% tariff was accepted in the Europe-US trade negotiations, tensions in the global trade environment remain on the agenda.
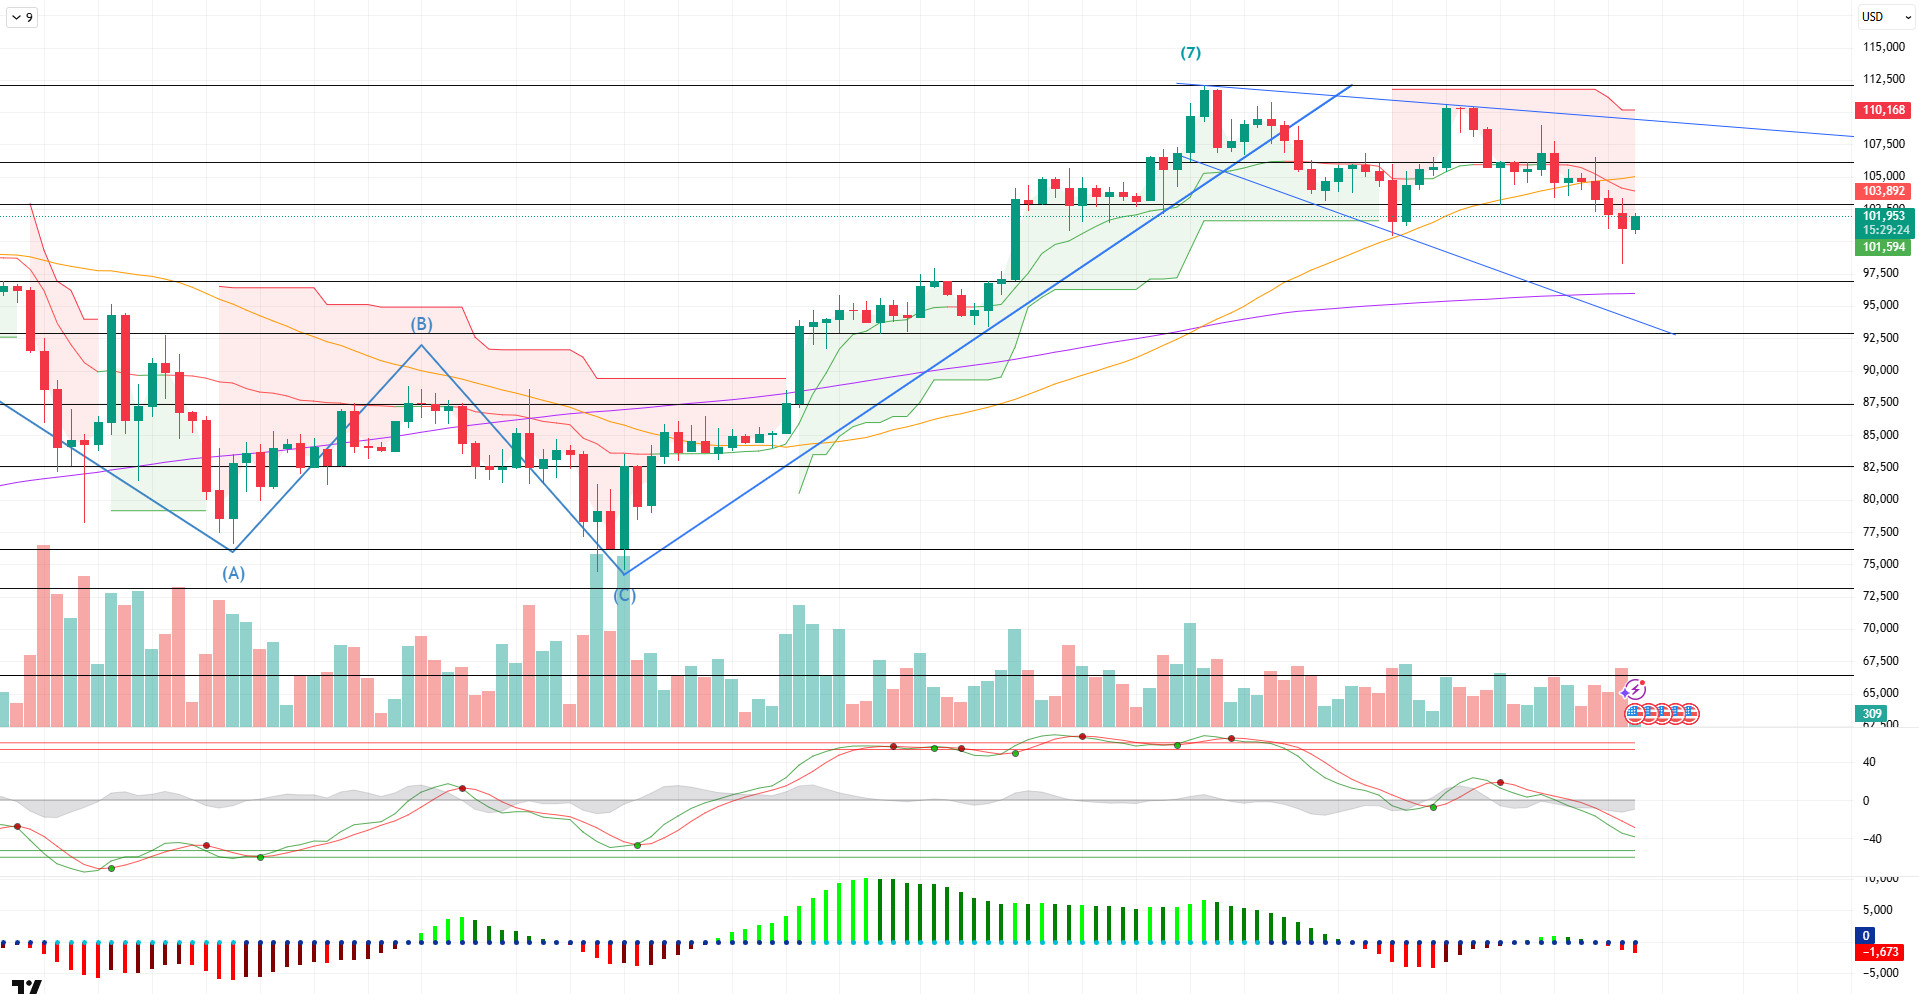
After all these developments, when we look at the daily technical outlook, it is seen that BTC entered into a falling wedge pattern after the peak at the 7th point it reached with the golden cross structure and declined within this structure. BTC, which started the week at 106,000 levels, recovered to 102,000 levels after falling as low as 98,200 during the week. With this move, BTC is set to close the week with a decline of about 3.43%.
When we look at the technical indicators, we can say that the WT oscillator is approaching the ovelsold zone on a daily basis, while the SM indicator is in the negative area. On the moving averages, the golden cross structure continues as the 50-day SMA crosses the 200-day SMA upwards.
When the weekly liquidity data is analyzed, it is observed that the buy-side positions have been liquidated, while the sell-side positions still continue to accumulate and accumulate within the 104,000 – 105,000 band.
Overall, while the technical structure shows a weak bullish outlook, liquidity data suggests that short-term upward attacks may not be permanent. The negative scenario on the fundamental developments side supports this. Sustainability on the upside may depend on the support of fundamental developments. In this context, 105,000 level is followed as a resistance point, while 100,000 may be seen as important in terms of holding at six-digit levels in a possible new bearish scenario. In this context, technical breakouts can be followed.
Supports 101,400 – 100,000 – 99,000
Resistances 102,800 – 105,000 – 109,000
ETH/USDT
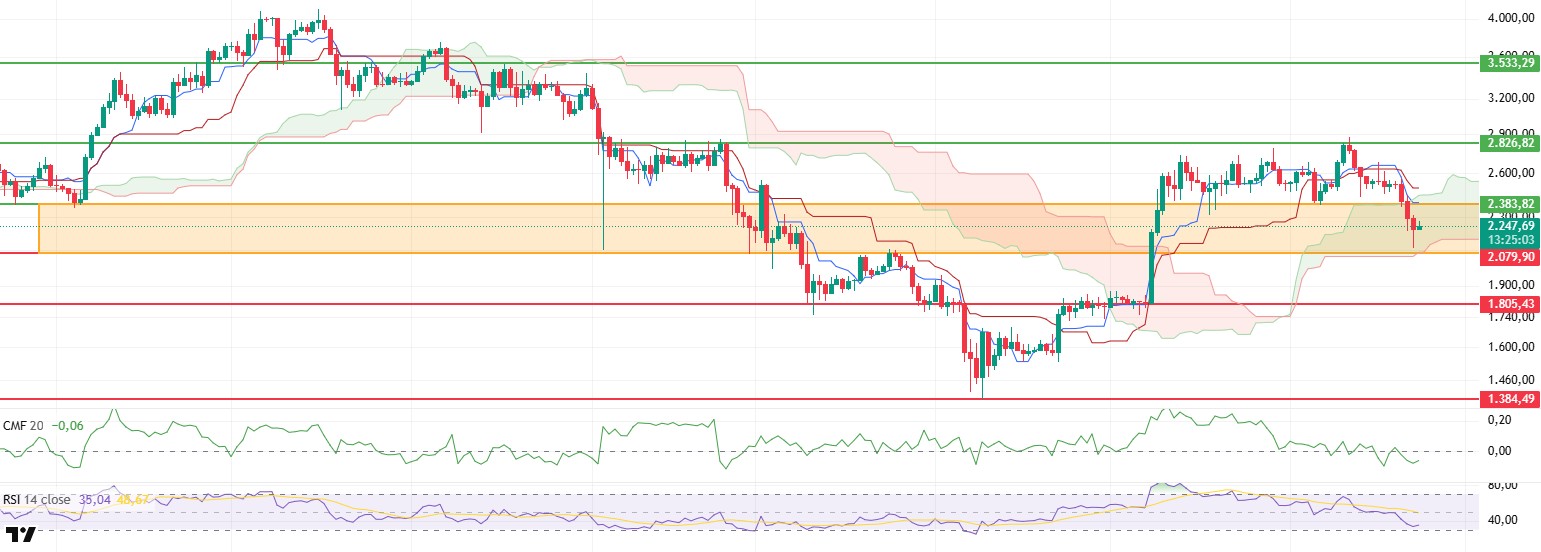
The rapid escalation of tensions between Israel and Iran last week, coupled with the direct involvement of the US in targeting Iran’s nuclear facilities, sharply raised the perception of geopolitical risk in global markets. The attacks on facilities in strategically important regions such as Natanz, Isfahan and Fordo had serious repercussions not only in the Middle East but also globally in terms of energy and security policies, paving the way for high volatility in the markets. In this atmosphere, crypto assets were also directly affected. With the deepening selling pressure, especially on Bitcoin and Ethereum, the Ethereum price gradually declined from Friday to the orange zone, which stands out as technical support on the chart. However, the purchases that came into play at this point enabled the price to recover in the short term and rise above $2,200 again. This move can be considered a short-term reaction because geopolitical developments are still in high tension, causing investors to act cautiously.
Despite the price pressure, on-chain data shows that Ethereum investors remain confident from a long-term perspective. The total amount staked on the Ethereum network has increased from 35.02 million units to 35.25 million units in the last week. This increase indicates that despite the falling price, investors are strengthening their positions on the network and maintaining faith in the sustainability of the system. This data suggests that network fundamentals remain strong despite the short-term weakness in prices.
The Ichimoku indicator shows that the price retreated to the border areas of the kumo cloud after losing both tenkan and kijun levels. Especially during yesterday’s decline, the price came very close to the lower band of the cloud, but the fact that it continues to price inside the cloud for the moment shows that the negative trend has not yet been fully confirmed. However, the fact that the tenkan level, which reflects the short-term trend, cuts down the kijun level, which represents the longer-term average, stands out as a short-term weakness signal. This structure serves as a warning that upside reaction movements may remain limited.
The Cumulative Volume Delta (CVD) indicator points to intense selling pressure on both spot and futures. This suggests that the decline was fueled not only by short-term investors but also by leveraged trades. However, what is noteworthy at this point is that the funding rate, which was in negative territory at the end of the week, turned positive again at the beginning of the week as the price recovered. This change can be considered as an important signal that the market has started to strengthen its upside expectations for the short-term direction. Similarly, the upward acceleration in the Chaikin Money Flow (CMF) indicator, which started after crossing into negative territory, indicates that capital inflows have regained momentum and liquidity flows have turned positive.
The Relative Strength Index (RSI) also signaled a limited recovery after falling to 33 with the recent decline and approaching the oversold zone. This reaction in the RSI suggests that the weakness in momentum has been broken to some extent and short-term buying has come back into play. However, the fact that the indicator is still well below the neutral zone reminds us that upward movements need to be supported by strong volume.
In the overall outlook, technical indicators suggest that price action has not yet fully recovered and cautious optimism prevails in the market. Although there are signs of a short-term recovery, the escalation of geopolitical risks stands out as the most important factor determining the direction of the market. The risk of deepening the decline in ETH may become evident if the critical level of $2.079 on the chart falls below it. On the other hand, a permanent movement of the price above the $2,383 level will be very important for the market to regain an upward trend. In this context, the direction of geopolitical developments will continue to be one of the key factors that will determine the technical outlook of Ethereum in the coming days.
Supports 2,079 – 1,805 – 1,384
Resistances 2,383 – 2,826 – 3,533
XRP/USDT
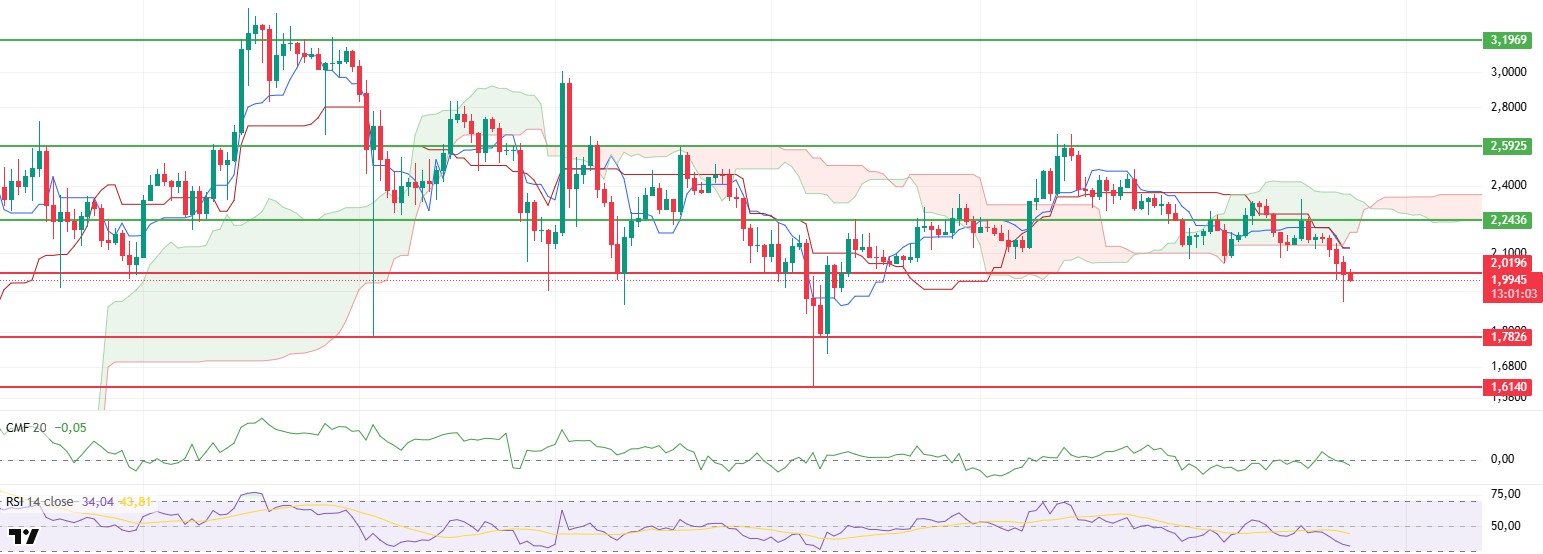
XRP turned down last week with the sell-off from the $2.24 level and technically entered a downtrend. In addition to this technical weakness, rising geopolitical tensions globally also deepened the pressure on the market. The conflict between Iran and Israel reached a critical level when the US directly intervened in the process and targeted Iran’s nuclear facilities. In the light of these developments, increasing uncertainty and the search for safe havens increased the selling pressure in the cryptocurrency market and XRP fell below an important support level of $2.01. This breakthrough indicates that the weakening in the technical outlook has deepened.
When the indicators are analyzed in detail, it is noticeable that the Chaikin Money Flow (CMF) indicator has made a strong transition to the negative zone. This outlook indicates that the liquidity flow in the market is shaped in the direction of selling and investors tend to close positions or avoid risk. This trend of CMF suggests that the market is struggling to find new buyers and the possibility of a recovery in the short term remains weak.
Similarly, the Relative Strength Index (RSI) indicator is also not supportive of price action. The RSI’s decline to the 34 level suggests that the price is approaching the oversold zone and the weakness in momentum continues. Even if reaction buying comes from these levels, the fact that the RSI does not gain upward momentum strengthens the possibility that possible rebounds may remain limited.
Looking at the Ichimoku indicator, it is seen that the technical structure has turned completely negative. The fact that the price is sagging under the kumo cloud indicates that this structure, which previously served as support, may now become resistance. At the same time, both the tenkan and kijun levels have broken significantly downwards, making it clear that the market has now entered a negative structure on a trend basis. These intersections and directional changes confirm that the market is facing strong resistance in the short to medium term.
In general terms, we are facing a picture where the technical structure on the XRP side is deteriorating and the price is more likely to test lower levels. The $2.01 level remains the main threshold for short-term recovery. Unless there is no permanence above this level, it seems difficult for the market to reassure. In order to talk about upward movements in the short term, first of all, daily closures above the $2.01 level must come on a daily basis, and then the kumo cloud must break upwards. Otherwise, it stands out as a technically strong possibility that the price will continue its downward trend and retreat to the level of $1.78. In this process, the course of geopolitical developments and the change in global risk perception will continue to play a decisive role in pricing.Top of the FormBottom of the Form
Supports 2.0196 – 1.7826 – 1.6140
Resistances 2.2436 – 2.5925- 3.1969
SOL/USDT
Last week in the Solana ecosystem;
- Coinshares moved to launch the Solana ETF.
- VanEck’s Solana was listed on the DTCC with the stock code $VSOL.
- SOL Strategies files Form 40-F for listing on the Nasdaq exchange.
- Meme Strategy bought 2,440 Solana tokens.
- FTX bought 252,847 Solana (SOL) tokens on a centralized exchange.
- fun sold 741 million SOL worth $4.1 million.
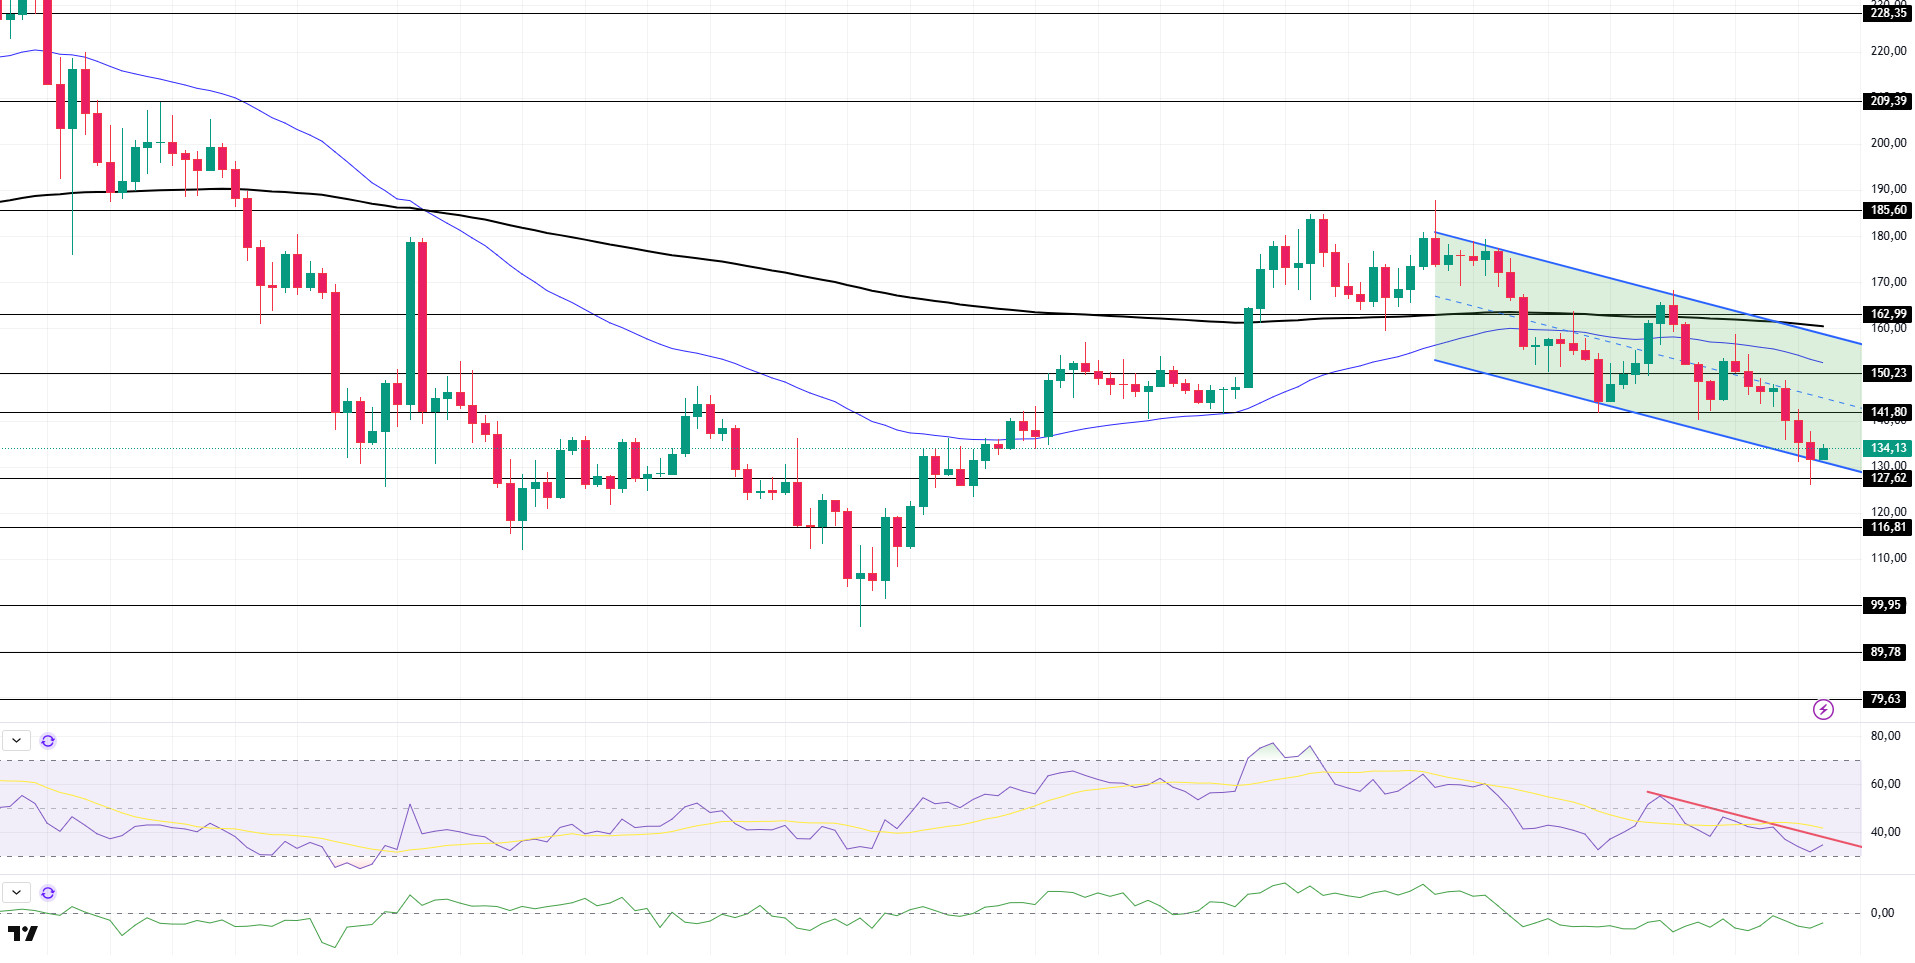
The SOL price has retreated 14% this week to the base level of the downtrend that formed on the daily chart and started on May 23. The price, which is currently testing this as support, may retreat to $99.95 on the closure of sub-trend candles. If the rises continue, the 50 EMA (Blue Line) moving average should be followed.
The asset is trading below the 50 EMA (Blue Line) and the 200 EMA (Black Line), indicating that the asset is bearish. Moreover, the fact that the 50 EMA continues to remain below the 200 EMA indicates that a “death cross” continues to form from a technical perspective. This suggests continued bearish potential in the medium term. RSI (14) rose from the oversold zone to the neutral level. Additionally, it remained below the downtrend that started on June 10. This may mean that the decline may continue. Chaikin Money Flow (CMF-20) remained in the negative territory; the decline in money inflows may push the CMF-20 indicator deeper into the negative territory. If macroeconomic data remains positive and ecosystem developments remain positive, the first major resistance point of $150.23 could be retested. Conversely, in case of possible negative news flow or deterioration in macro data, the $116.81 level can be monitored as a potential buying opportunity.
Supports: 127.62 – 116.81 – 99.95
Resistances: 141.80 – 150.23 – 162.99
DOGE/USDT
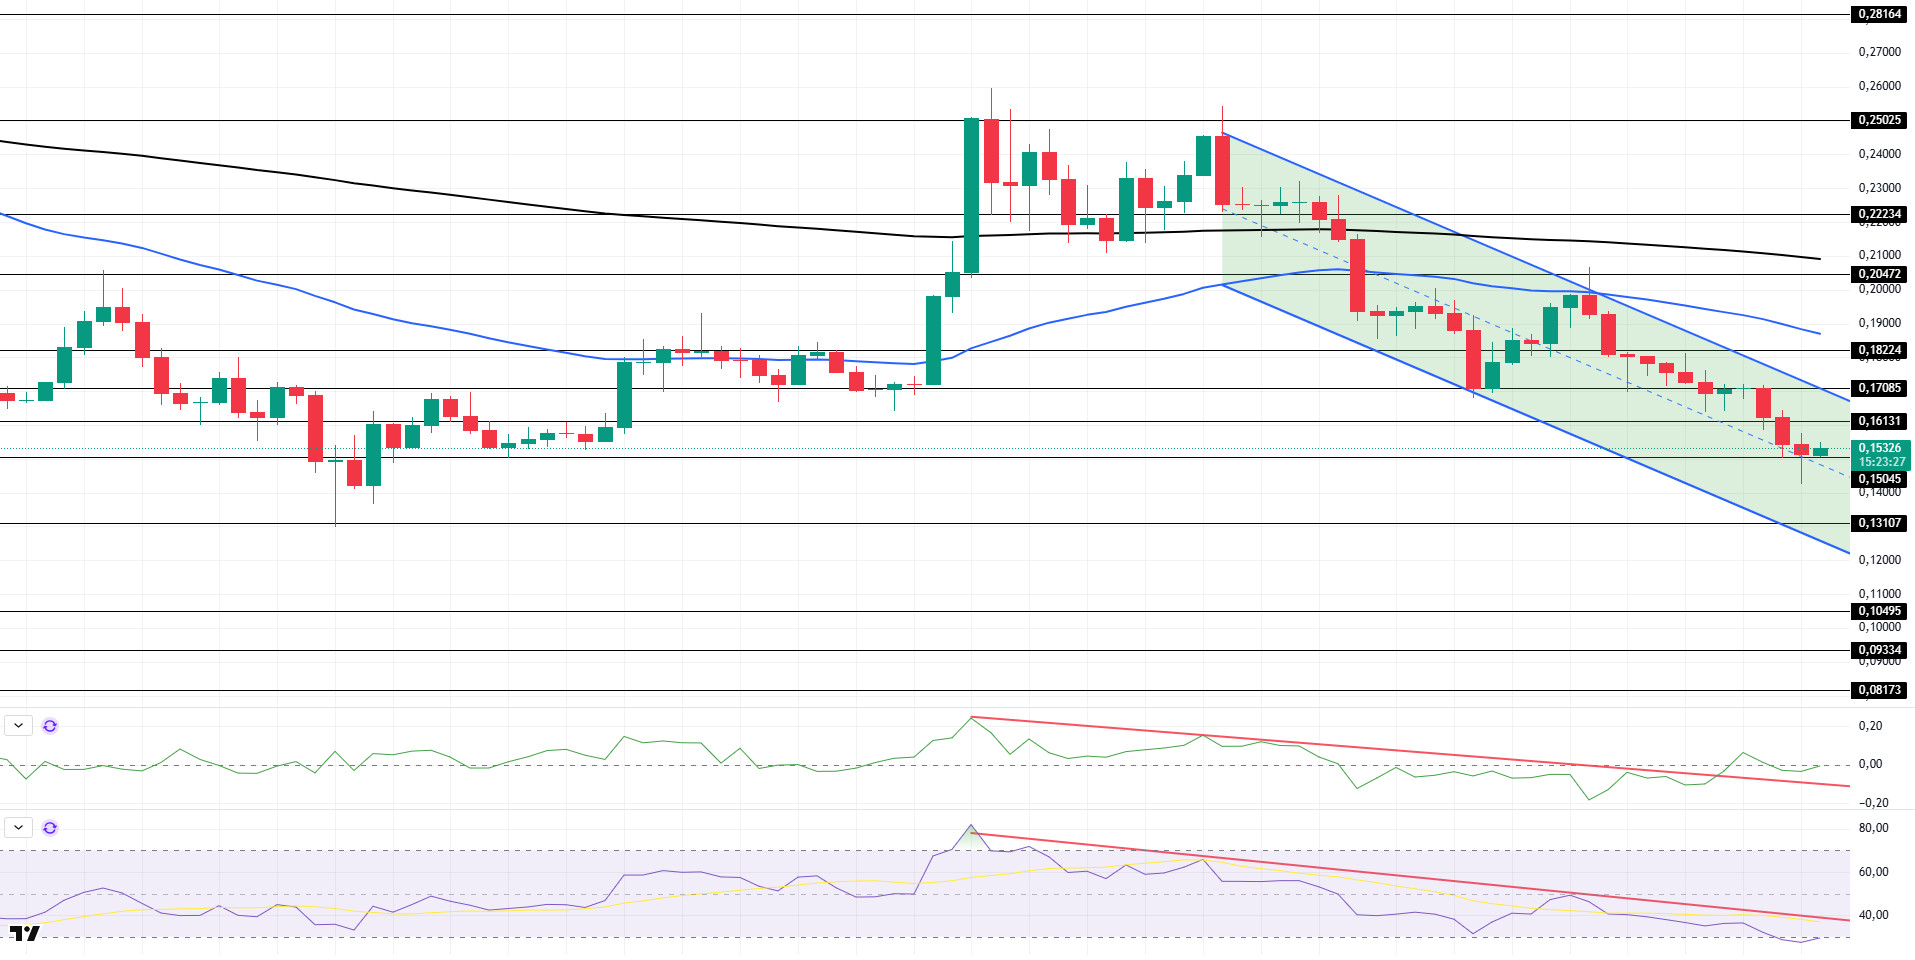
DOGE has declined on the daily chart since last week. Breaking the downtrend that started on May 23 with a fake breakout to the upside, the price deepened its retracement with resistance from the 50 EMA (Blue Line) and continued to be in the downtrend. The price, which is currently testing the strong support level of $ 0.15045, has accelerated from here. If it breaks this level downwards, the support level of $ 0.13107 may be triggered.
The asset continued to remain below the 50 EMA and 200 EMA (Black Line), indicating that the death cross pattern remains valid. This suggests that bearish pressure may continue in the medium term. Chaikin Money Flow (CMF-20) indicator rose to neutral. In addition, the downtrend that started on May 10 broke to the upside. This may lead to a price increase. Money inflows continue to decline. This may move the CMF-20 indicator into negative territory. The Relative Strength Index (RSI-14) is at the oversold level of the negative zone and remains below the downtrend since May 10. If it breaks upwards, the 50 EMA moving average could be tested. In case of macroeconomic risks or negative news from the ecosystem, the $0.13107 level can be monitored as a strong support. On the other hand, the $0.17085 level stands out as the first strong resistance level if the upward movement gains strength.
Supports: 0.15045 – 0.13107 – 0.10495
Resistances: 0.16131 – 0.17085 – 0.18224
TRX/USDT
TRON’s plans to conduct a reverse merger with Nasdaq-listed SRM Entertainment has caused great excitement among its investors. Within the scope of this strategic partnership, the company is expected to implement a model similar to the coin-based capital structure adopted by Strategy by buying and holding TRX.
Last week, another 2 billion USDT were minted on the Tron network, bringing the total supply of USDT on the network to $80.7 billion. Thus, while Tron maintained its clear leadership among the networks holding USDT, it further strengthened its central position in the stablecoin ecosystem.
During the week of June 16-22, 2025, a total of 47.4 million TRX were burned on the TRON network. This process continues to put deflationary pressure on TRX by reducing the circulating supply.
During the week, the TRON network generated a total of $79.4 million in revenue, maintaining its position as the highest revenue-generating ecosystem among all blockchain networks. This revenue level reflects the strong performance of key network efficiency indicators such as transaction volume, total locked assets (TVL), daily active addresses, and user interaction on DeFi protocols.
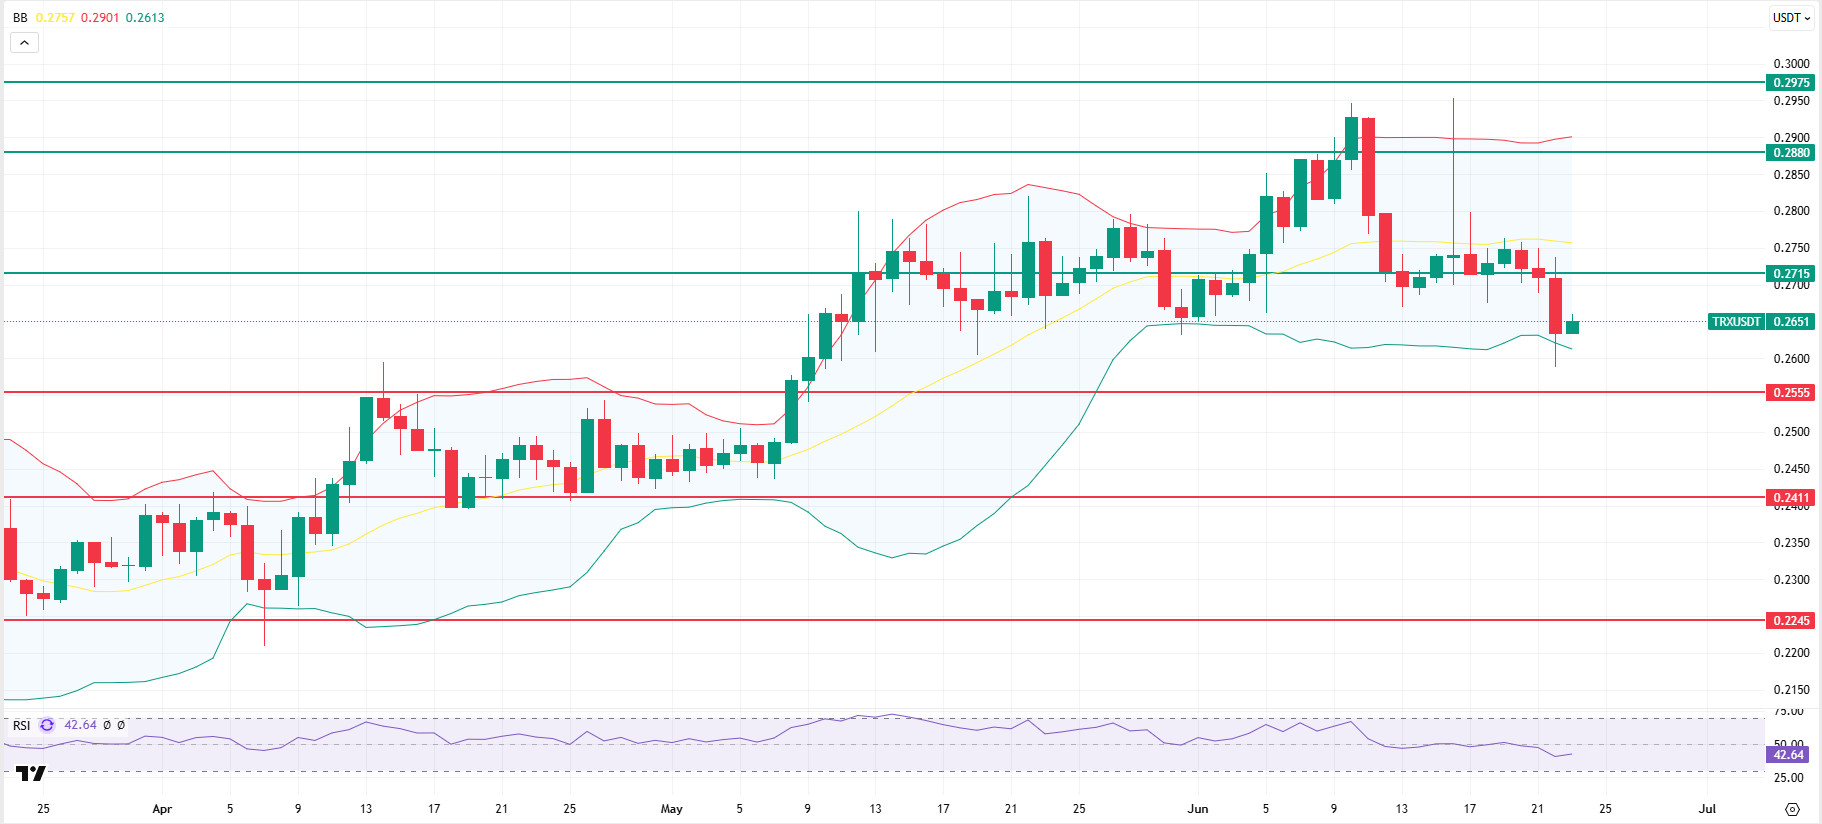
TRX, which started last week at 0.2738, fell by about 4% during the week to close the week at 0.2635. TRX, which is currently trading at 0.2651, is in the Bollinger lower band on the daily chart. The Relative Strength Index (RSI) value has approached the oversold zone with 42, and TRX price can be expected to move up from its current level and move towards the Bollinger middle band. In such a case, it is expected to test the 0.2715 resistance. If it closes daily above the 0.2715 resistance, it may continue to rise and may want to test the 0.2880 resistance. If it fails to close daily above the 0.2715 resistance and news flows about the increasing tension in the Middle East, it may decline with the selling pressure that may occur. In such a case, it may test the supports of 0.2555 and 0.2411 respectively. On the daily chart, 0.2245 is an important support and as long as it remains above , the bullish demand can be expected to continue. If this support is broken, selling pressure may increase.
Supports 0.2555 – 0.2411 – 0.2245
Resistances 0.2715 – 0.2880 – 0.2975
AVAX/USDT
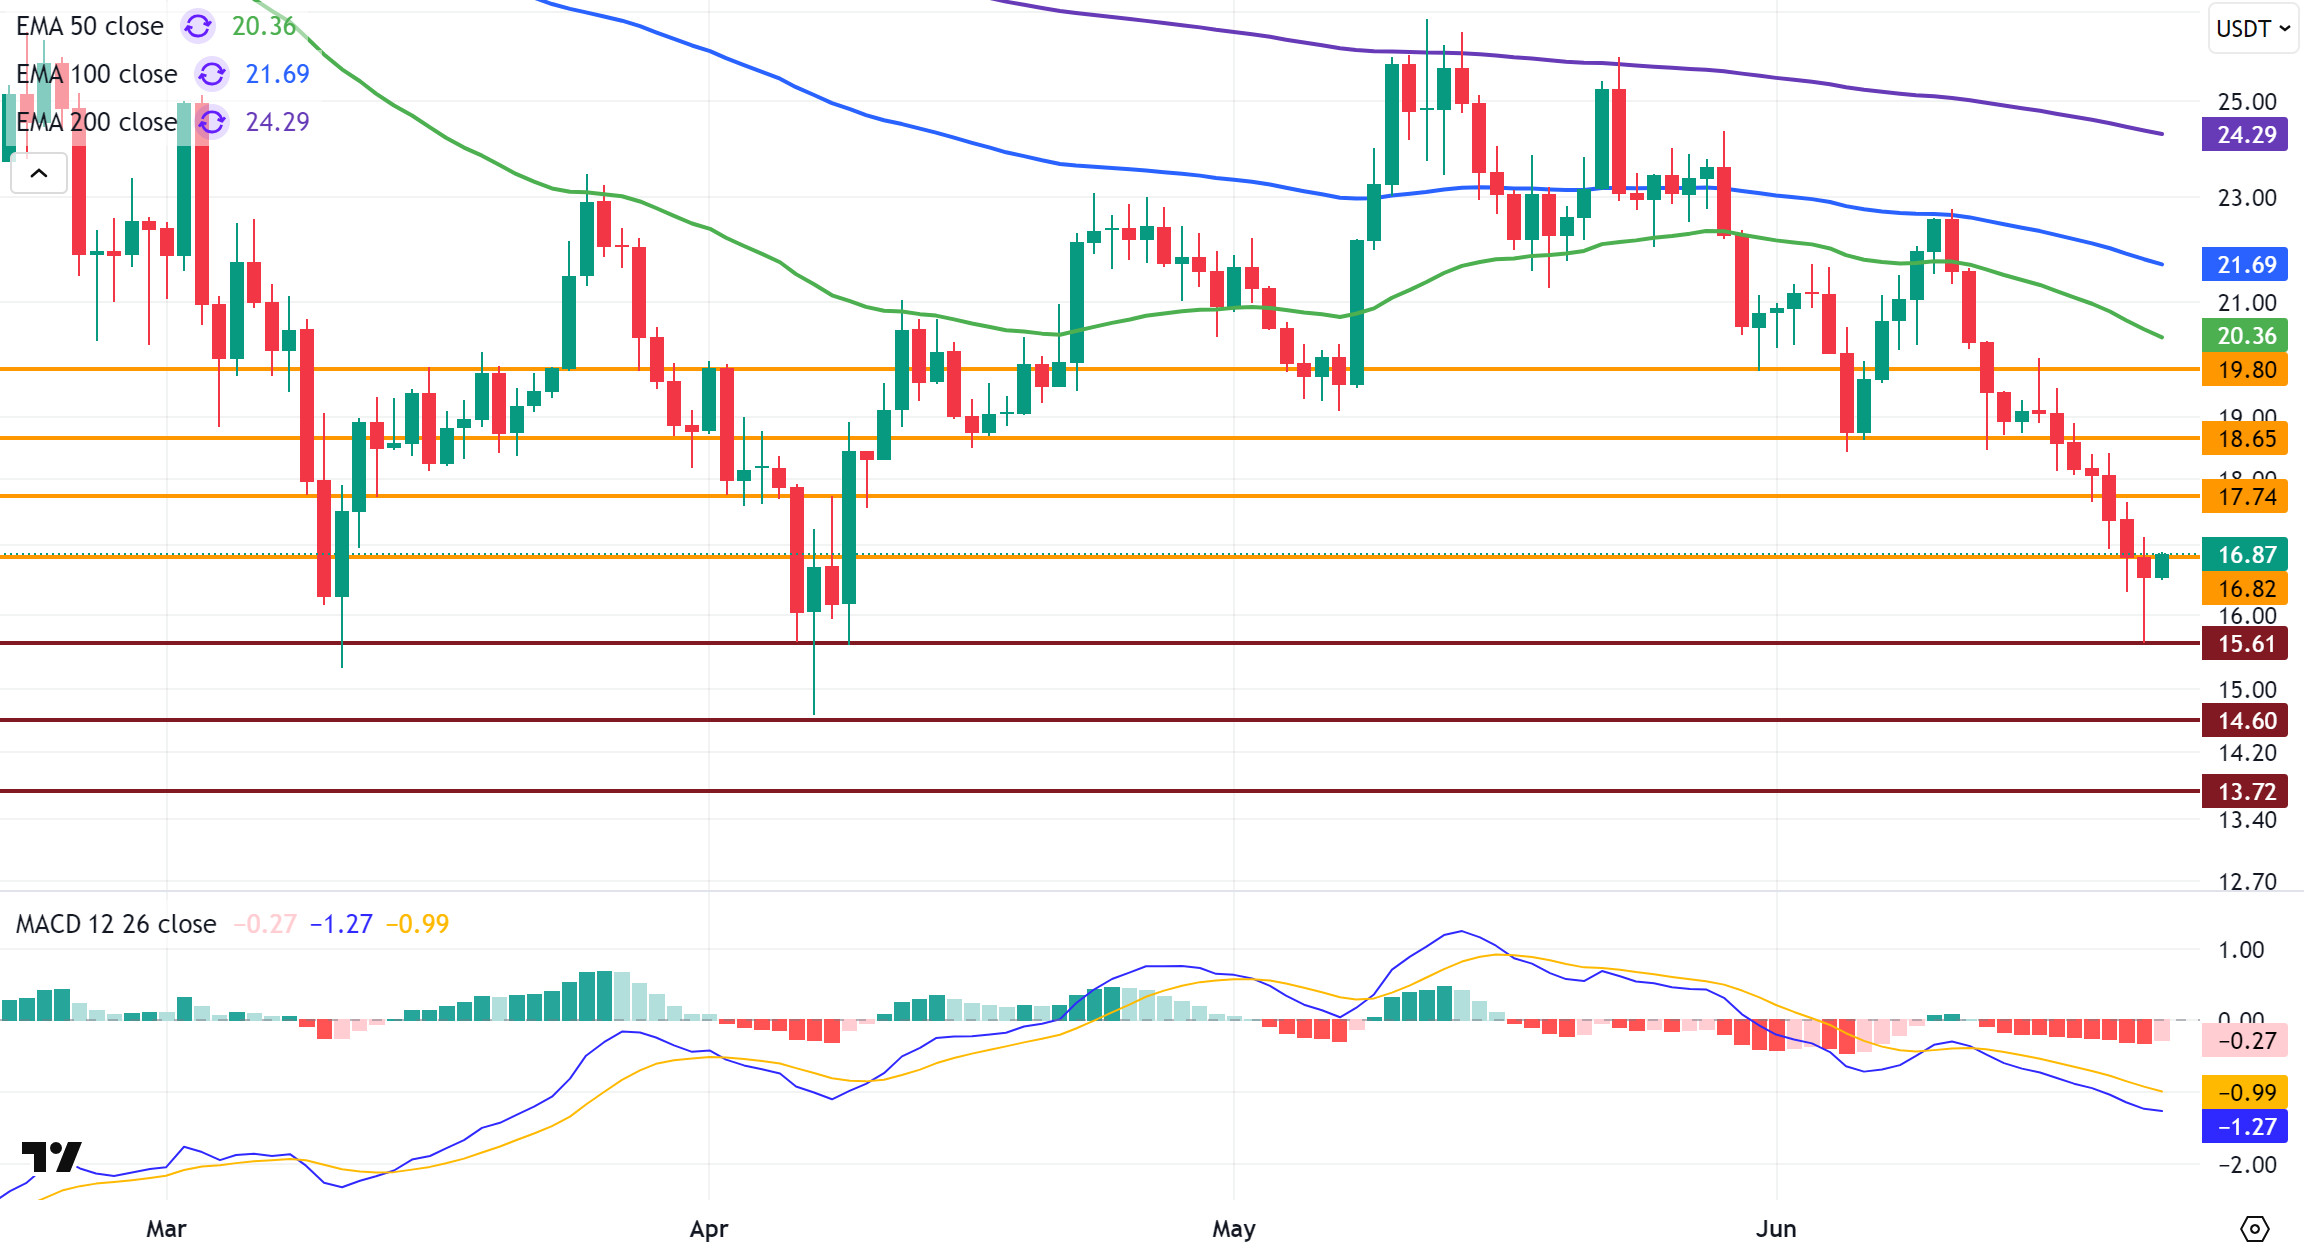
AVAX, which started last week at $19.09, lost approximately 13.5% during the week and closed the week at $16.51. In this period of weak momentum, the ongoing geopolitical tension in the Middle East caused sharp sales in the crypto market. AVAX fell as low as $ 15.60 in this process. Although it started the new week with a rise, we see that the momentum is still not strong enough.
On the daily chart, the Moving Average Convergence/Divergence (MACD) line remains below the signal line and in negative territory. This suggests that the downside momentum is maintained and buying reactions are yet to turn into a lasting uptrend.
AVAX is testing the $ 16.82 level with its rise on the first day of the new week. In case of persistence above this level, it may test the $ 17.74 level in the continuation of the rise. If the $ 17.74 level is exceeded, the resistance levels of $ 18.65 and $ 19.80, respectively, will come back to the agenda. On the contrary, if the selling pressure shows its effect again, support levels of $ 15.61, $ 14.60 and $ 13.72 will come to the agenda if it closes below the $ 16.82 level and the decline continues. In particular, a closing below the $ 15.61 level may trigger a process in which the downtrend may deepen. The uncertainty created by the ongoing geopolitical risks in the Middle East may cause fluctuations in AVAX price in the coming period.
(EMA50: Green Line, EMA100: Blue Line, EMA200: Purple Line)
Supports 15.61 – 14.60 – 13.72
Resistances 16.82 – 17.74 – 18.65
SHIB/USDT
The volume of on-chain transactions in the last 24 hours has increased significantly, with a total of 15.05 trillion SHIBs changing hands. This rapid rise in trading volume signals the reactivation of large investors and high-dollar transactions in the ecosystem. This activity is often interpreted as a precursor to strategic moves and possible structural changes in the network. On the supply side, SHIB burn continued to be sustained by the community. Approximately 552.5 million SHIBs were removed from circulation for the week, down 19.84% from the previous week. On a daily basis, a different picture emerged, with 13.5 million SHIBs being burned on the last day, an increase of 1,906.84% in the daily burn rate. However, the total circulation is still above 584 trillion, limiting the impact of burns on supply in the long run. A measured reduction in supply could increase demand for SHIB by reinforcing the perception of scarcity in the community, and the rise in trading volumes could deepen the network’s liquidity and adoption.
This week, the Shiba Inu price first broke below the $0.00001190 and $0.00001085 supports and then formed a second bottom at $0.00001020, completing a double bottom pattern. This pattern signaled that the buy side was still in the field, allowing the price to recover to around $0.00001070. However, the decline in momentum indicators and the decrease in trading volume suggest that participants are uncertain. The contraction in volatility reveals that the price is still moving in a narrow consolidation band. The positive mismatch (Black Line) on the Commodity Channel Index (CCI) oscillator indicates the potential for buyers to gain momentum, and in this case, the $0.00001285 level stands out as the first resistance point if the upward movement gains momentum. On the other hand, if the 0.00001020 dollar support is lost again, the 0.00000975 dollar level stands out as the new critical support zone. The holding or breaking movements at these critical levels will give clear signals about the next direction of Shiba Inu
Supports 0.00001020 – 0.00000975 – 0.00000910
Resistances 0.00001285 – 0.00001380 – 0.00001480
LTC/USDT
Litecoin (LTC) closed last week with a 7.06% drop, ending a five-week negative streak. It started the new week at $80.21. LTC, which also lost 2.93% against Bitcoin in the same period, has a market capitalization of approximately $6.01 billion and moved up one spot to 20th place in the crypto market. This shows that Litecoin is keeping pace with the overall market movements and is partially resisting the downtrend. On the futures side, open interest decreased by $28 million compared to last week, bringing the total open interest to $236 million. Funding rates remain positive at most points.
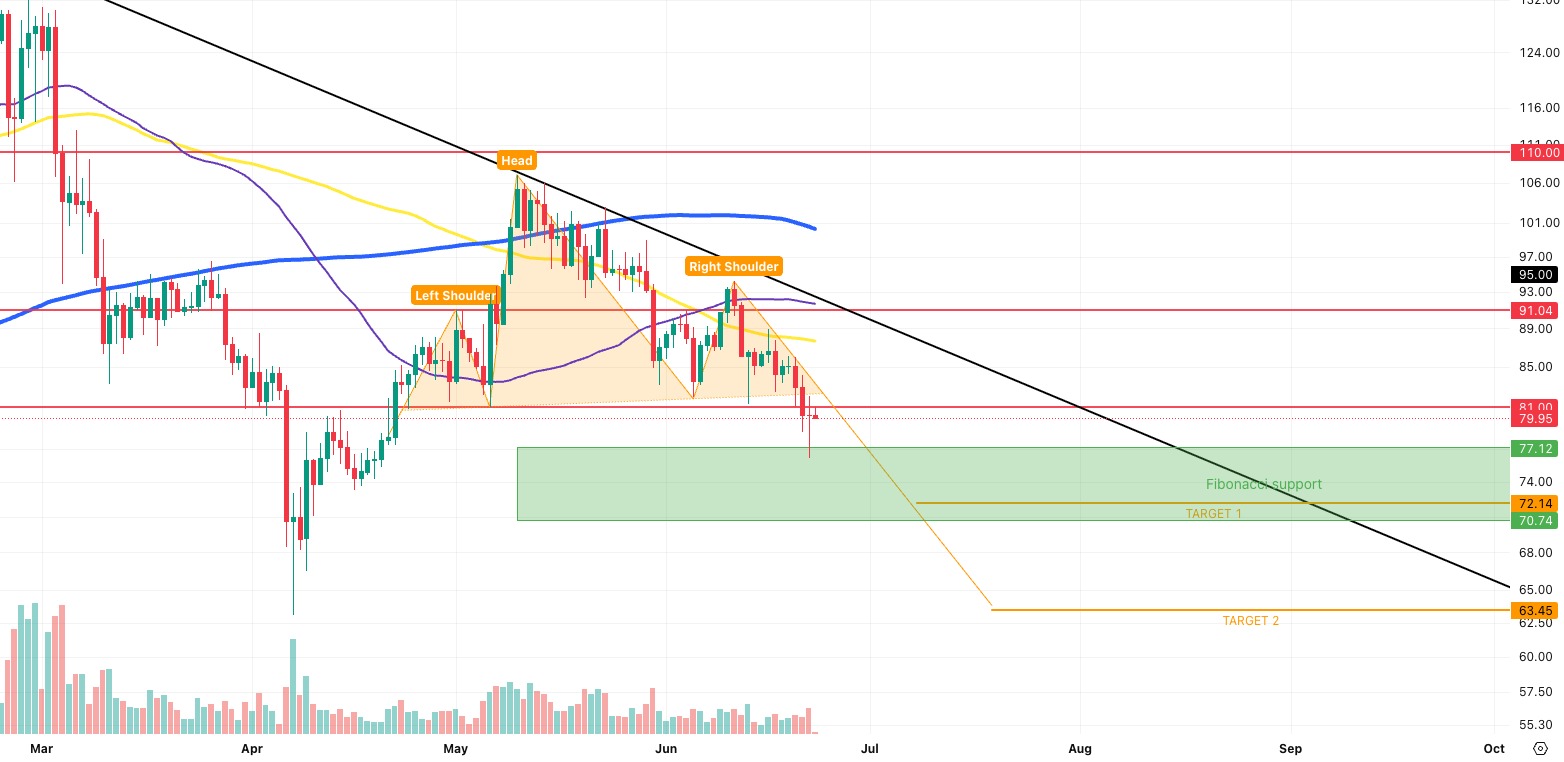
As of this week, Litecoin is trading below its 50-period moving average (purple), 100-period moving average (yellow) and 200-period moving average (blue). This technical structure suggests that the price remains under pressure and upside may remain limited. At the same time, a potential H&S (Head and Shoulders) pattern is being observed (orange formation). This pattern was partially confirmed by the break of the support at $81.00 last week and appears to be heading towards its first target. In this potential downtrend, the first area to react is the range starting from the upper point of the Fibonacci support zone and extending to the lower band (green zone). The 72.12 level, which is the starting point of this zone, can be classified as support due to the previous day’s reaction. Subsequently, 72.14, the first target of the pattern, and 63.45, the final target, are the points where a reaction can be expected in possible declines.
On the upside, the first resistance level is 81.00, which is determined by the red line on the horizontal. Further, if the falling trend line (black) and the red horizontal resistance at 91.21 are broken upwards, an acceleration up to 110.00 can be expected.
Resistances 81.00 – 91.21 – 110.00
Supports 77.12 – 72.14 – 63.45
LINK/USDT
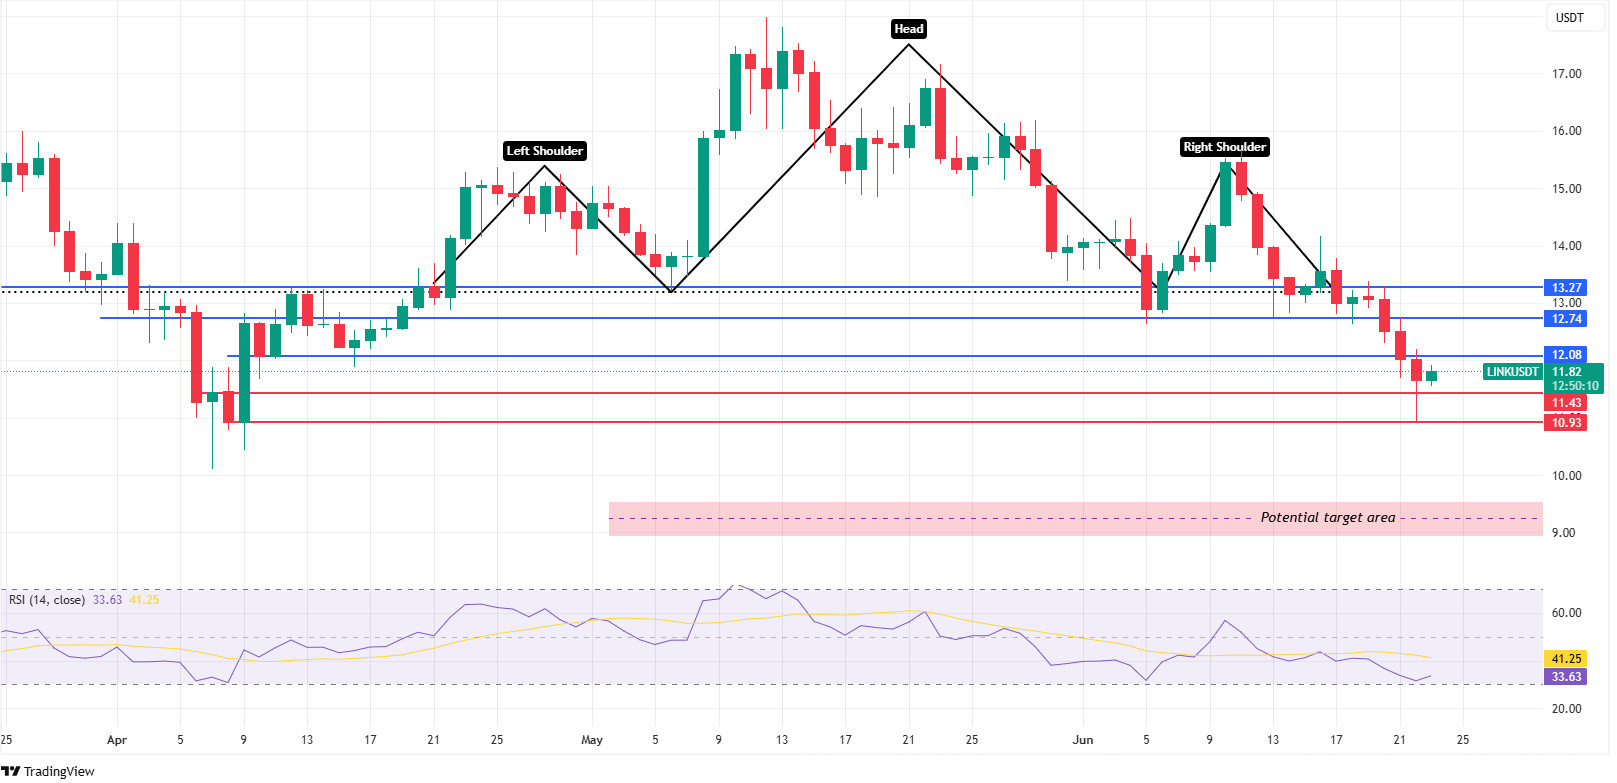
While LINK moved in line with the uptrend we mentioned last week, it broke the $13 level, which stands out as a horizontal support line, downwards and lost about 20% of its value. With the loss of this level, the Shoulder-Head-Shoulder pattern, which is a “bear” pattern on the price chart, emerged. When we examine possible scenarios within the framework of the current outlook, the $ 11.43 level stands out as the first support line. In possible upward reactions, the resistance levels that the price may encounter are 12.08 – 12.27 and 13.27 dollars, respectively. Especially the $ 13.27 level stands out as a critical resistance zone if the upward movement gains momentum. This level also corresponds to the Fibonacci 0.5 level, which is the first correction point of the bearish movement starting from the right shoulder. Therefore, it may be an important reference point in terms of direction.
If the downward movements continue, it is observed that buyers come into play at the level of 10.93 dollars. However, the loss of this level in the short term may make it likely that the price will retreat to the $ 9 levels, which is the potential target zone. This implies an additional depreciation of approximately 25% from the current price level. On the technical indicators side, the Relative Strength Index (RSI) is still in negative territory and remains correlated with the price action. Therefore, it is important to carefully monitor these critical resistance and support levels and formulate strategies accordingly.
Supports 11.43 – 10.93 – 9.00
Resistances 12.08 – 12.74 – 13.27
BNB/USDT
In the BNB ecosystem this week, the LAYER and SPK projects were listed on Launchpool. These listings are expected to have an overall positive impact on the BNB price as they increase demand for BNB used in transaction fees and reduce the supply in circulation as users stake BNB.
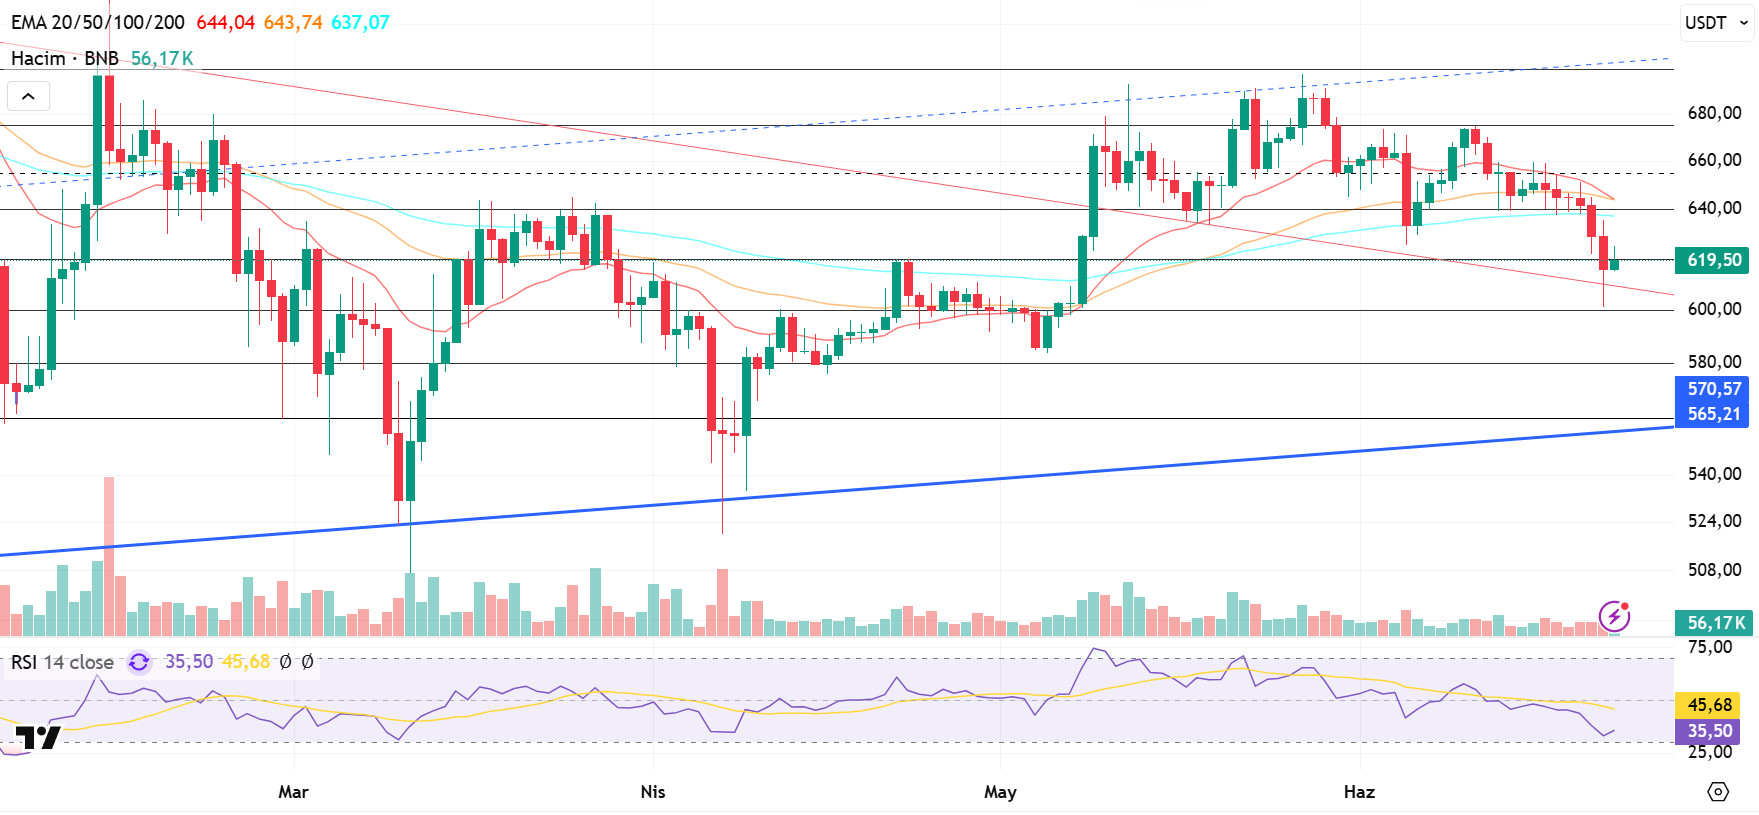
From a technical perspective, BNB/USDT made a positive start to the week on Monday, June 16. However, BNB, which entered a retracement process due to geopolitical developments, was pressured to the $ 600 level and recovered again by finding support at this level. In this context, the asset, which started the new week positively, rose to the $ 620 level.
When BNB/USDT, which is currently trading in the range of $ 600-640, is analyzed in terms of technical indicators, a decrease in trading volume is observed in the last one-week period. This indicates a weakening in the market’s appetite for buying. On the other hand, Relative Strength Index (RSI) exhibited a downward trend and fell below the average due to the recent pullback. This outlook reveals that negative trends are effective in the short term.
Within the framework of the current technical structure, if the positive momentum continues, the BNB price is expected to test the $ 640 resistance in the first place. If this level is exceeded, the $ 675 and $ 700 levels should be followed as the next strong resistance zones. On the other hand, if the $ 640 level cannot be exceeded and selling pressure increases, the price is likely to retreat back to the $ 600 support. If this support is broken downwards, the levels of 580 and 560 dollars stand out as important support zones, respectively.
Supports 600 – 580 – 560
Resistances 640 – 675 – 700
SUI/USDT
Sui started the week with network updates and supply dynamics. Momentum made a fast start to the week with partnerships with important platforms such as Wormhole and OKX. These collaborations have the potential to increase liquidity in the Sui ecosystem. On the other hand, total value locked (TVL) and daily DEX trading volumes have increased in recent quarters. This growth reflects the robustness of the network’s underlying structure and an uptick in user activity. The effects of the large number of Sui coin unlocks in recent weeks are expected to last until June 30th. The Sui development team remains committed to improving the Move-based smart contract infrastructure. New tools and updates allow developers to more easily and securely build decentralized applications (dApps) on Sui. Particularly noteworthy are new projects in the areas of gaming, DeFi and NFT. In addition, due to recent network issues and vulnerabilities, the Sui Foundation continues to conduct regular audits and remediation efforts to improve the security and stability of the network.
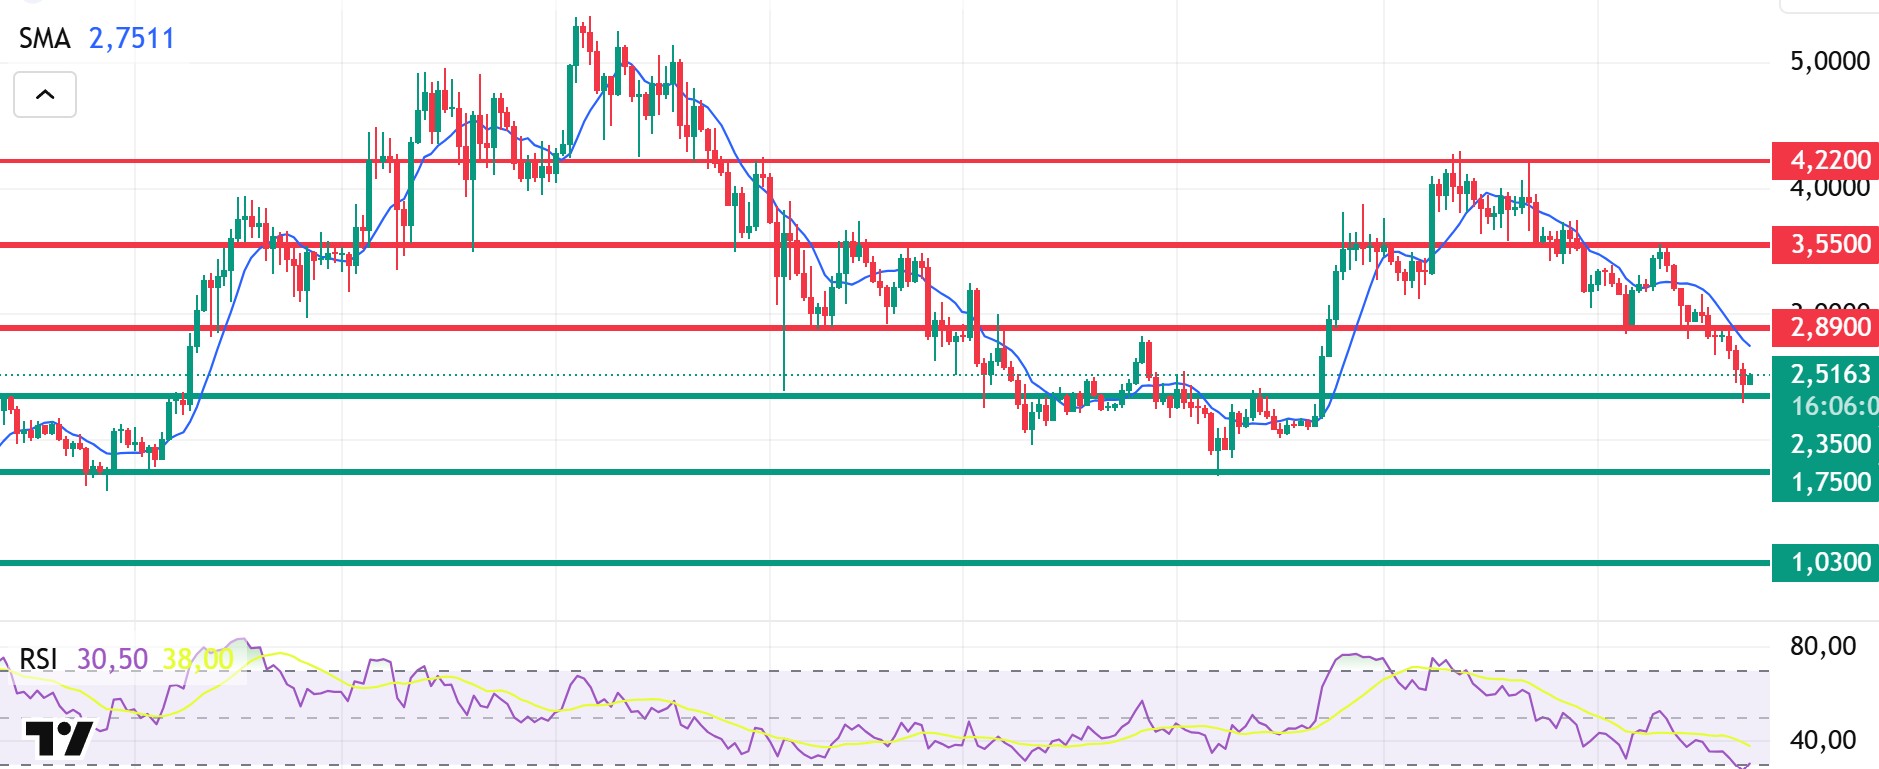
When we look at the technical outlook of Sui after the recent developments, it is seen that the price is balanced at around $ 2.51 on a weekly basis due to fundamental developments. The Relative Strength Index (RSI) is currently in the range of 30.50 – 38.00. While this value range indicates that the market is close to the oversold zone, a rise in the RSI to the range of 45.00 – 55.00 may signal a potential buying opportunity. If the price moves upwards, the levels of 2.89 – 3.55 – 4.22 dollars can be followed as resistance points, respectively. However, if the price falls to new lows, the RSI falling to the 20 – 30 band may indicate that selling pressure may deepen. In this case, the $2.35 and $1.75 levels stand out as strong support zones. Especially based on the trend line, a pullback to $1.75 seems technically possible. According to Simple Moving Averages (SMA) data, Sui’s SMA is currently at $3.21. If the price maintains above this level and crosses the SMA line upwards, the uptrend may regain strength.
Supports 1.03 – 1.75 – 2.35
Resistances 2.89 – 3.55 – 4.22

ADA/USDT
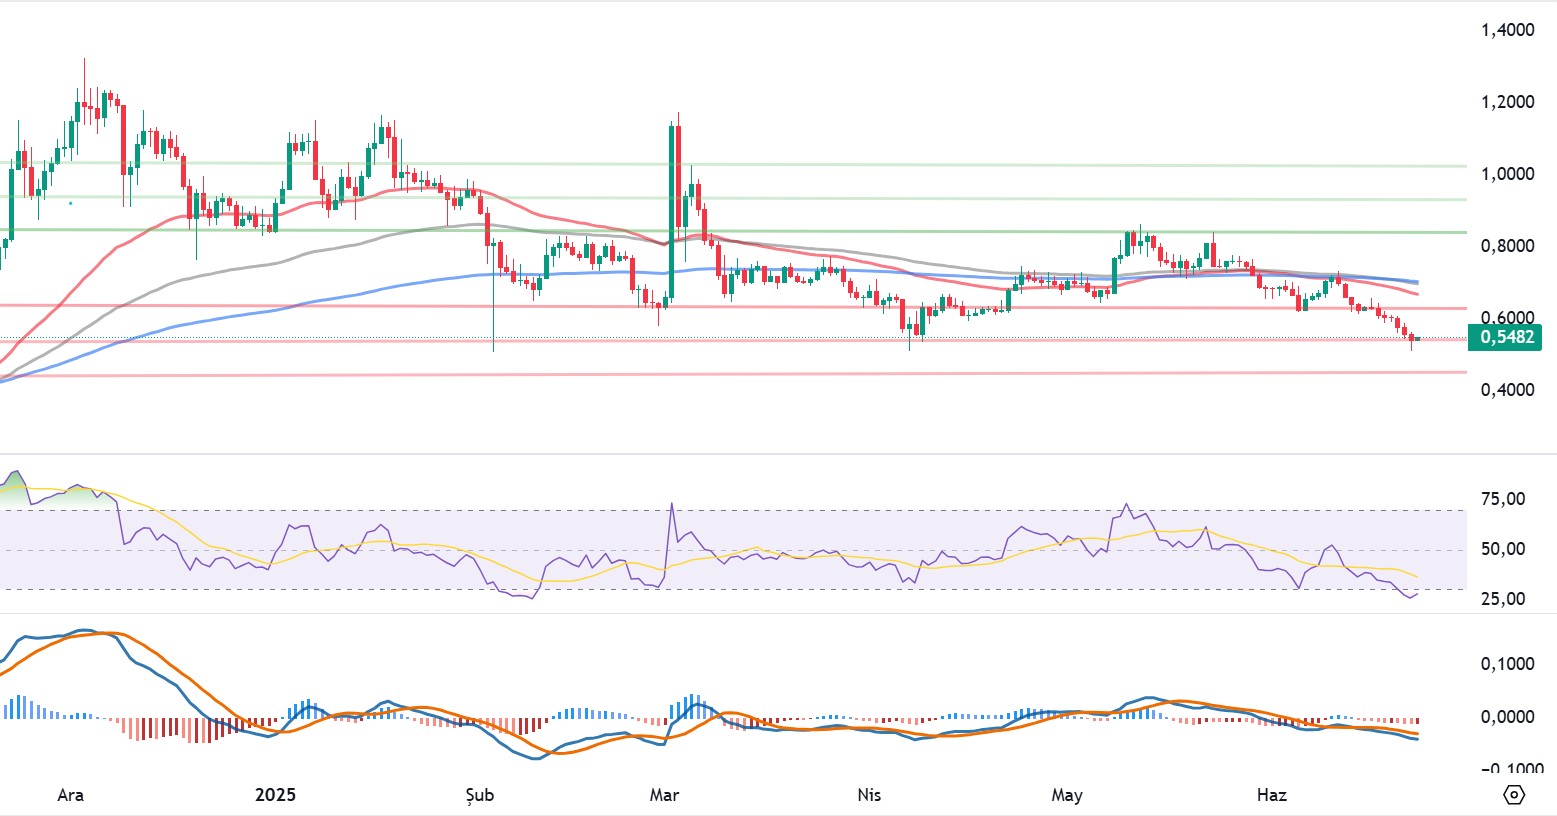
The Cardano ecosystem fell this week due to tensions in the Middle East (US-Iran), first falling to the support level of $ 0.582 and then to $ 0.5478. On June 21, a 3.8% decline was observed; on June 22, the decline deepened and a sharp retreat of 6.45% was recorded. Trading volume was 37-38% above the 30-day average. There was a significant increase in profit-taking and token flows, characterized by liquidation pressure on long positions, with a weekly decline of nearly 15%, supporting the selling bias.
Technically, ADA is currently around $0.547, having broken below the $0.582 support zone. On the daily chart, it is below all EMAs (20/50/100/200); MACD is in negative territory, confirming the downtrend. Relative Strength Index (RSI) is showing oversold signals, but the reversal signal is not clear. Although technical indicators are fragile, staking and on-chain developments offer positive signals. Leios update and stake increase may support the technical recovery. Return above the EMA (Exponential Moving Average) and breakouts of 0.6200-0.6500 may strengthen the possibility of a positive reversal in the short term. For ADA’s price, if the $0.7000 level breaks the nearest uptrend, the $0.8200 levels stand out as an area of strong selling pressure where the price has been rejected several times in the past. The 50-day moving average (Red Line) and the 200-day moving average (Blue Line) provide support above the price. If the price moves above these averages, a bullish signal may come. In a contrary scenario, if the price of ADA falls, the support levels of $0.4837 and $0.4587 may be retested. If these supports are broken, the decline may deepen.
Supports 0.4837 – 0.4587 – 0.4158
Resistances 0.8200 – 0.7320 – 0.7000
Legal Notice
The investment information, comments and recommendations contained in this document do not constitute investment advisory services. Investment advisory services are provided by authorized institutions on a personal basis, taking into account the risk and return preferences of individuals. The comments and recommendations contained in this document are of a general type. These recommendations may not be suitable for your financial situation and risk and return preferences. Therefore, making an investment decision based solely on the information contained in this document may not result in results that are in line with your expectations.