
Bitcoin Cycle Analysis: Has the 2025 Bull Market Reached Its Peak?
In the cryptocurrency markets, Bitcoin (BTC) acts as a barometer that single-handedly determines whether the market is bullish or bearish. As the leading asset, Bitcoin’s direction directly shapes the performance of altcoins. Even when some altcoins attempt to rise, sharp declines in Bitcoin quickly nullify these movements, making it difficult to speak of a sustained upward trend across the market.
Therefore, as we approach the end of 2025, accurately analyzing whether Bitcoin is still in a bull market or has shifted to a bear market is more critical than ever.
When examining the BTC/USD monthly chart for temporal (time-based) and structural (price behavior-based) analysis to find a clear answer to this question, interesting results emerge. Bitcoin’s price movements appear to follow a specific cyclical pattern. In other words, the price exhibits a seasonal structure, advancing at a similar rhythm in each cycle.
Cycles
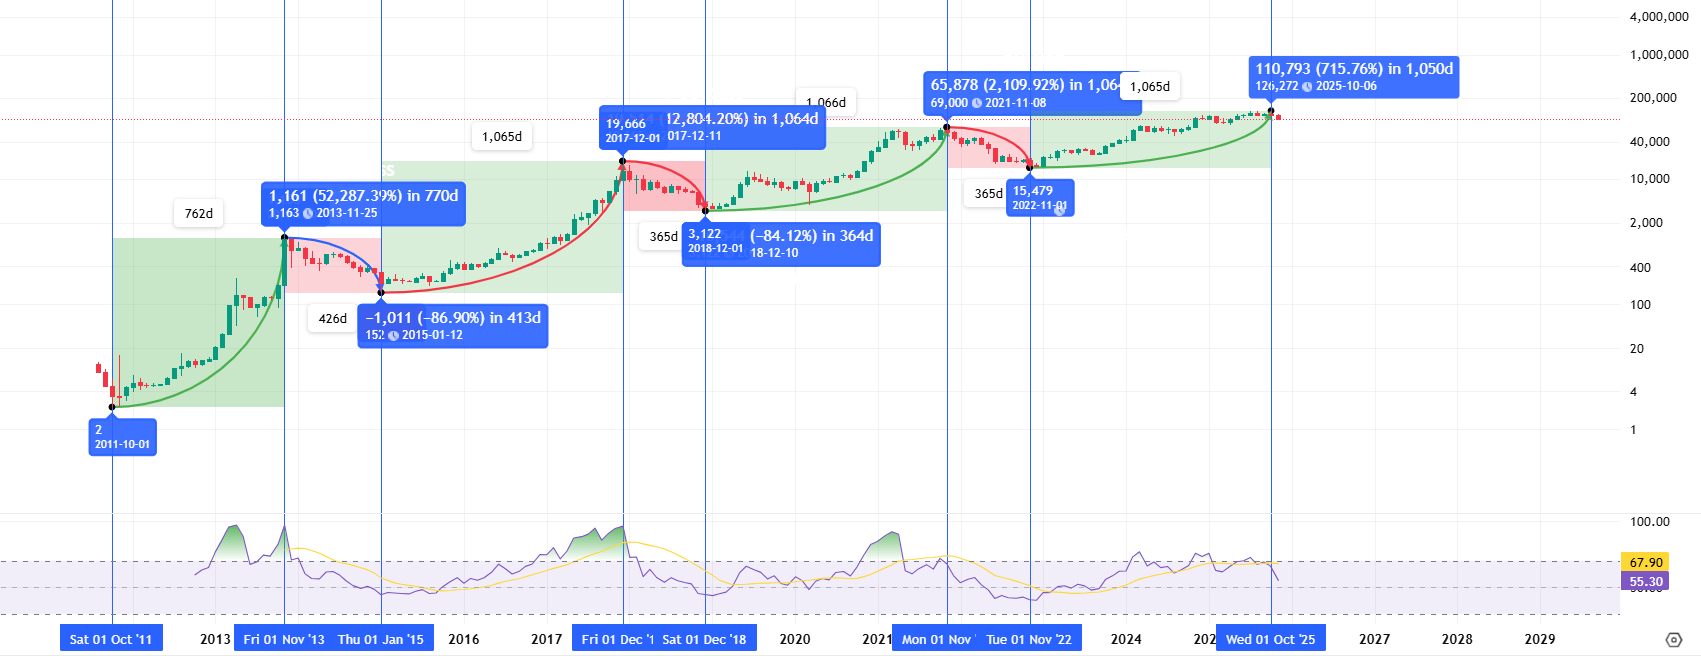
Looking at the Bitcoin chart, it is observed that the price first experiences a strong rise from the bottom to the top, followed by a significant pullback after forming this peak. However, this pullback does not fall below the previous main bottom level; on the contrary, it balances by forming a new bottom above it. In other words, the structure produces a very characteristic cycle that progresses as “peak → higher bottom → new peak.”
When we examine this cycle on the BTC/USD chart since 2011, we see that similar formations are repeated and that there is a certain pattern in Bitcoin’s price behavior. In our analysis, assuming that the same mathematical structure will continue approximately in the future, we find that we have 3 completed cycles, each with its own specific characteristics.
Cycles
The first cycle, lasting 1,188 days,
a total increase of 52,287% from bottom to new peak over 762 days.
Over 426 days, it completed a new low from the peak with a decline of -86.90%.
Cycle 2
The second cycle of 1,491 days,
A total increase of 12,804% from the bottom to the new peak over 1,065 days
Completed over 364 days with a decline of -84.12% from the peak to the new low.
Cycle 3
The third cycle, lasting 1,431 days,
A total increase of 2,109% from the bottom to the new peak over 1,066 days.
A 77.57% decline from peak to new trough over 365 days.
Common Points of the Cycles
Similarities exist in full cycles:
Rise duration: 762 → 1065 → 1066 days
Rise percentage: 52.287% → 12.804% → 2,109%
Decline percentage: -86.90% → -84.12% → -77.57%
Decline duration: 426 → 364 → 365 days
From this table, we can see that volatility is decreasing in each cycle, the rise percentage is falling, and the decline is becoming less severe. In other words, BTC is becoming increasingly stable.
Cycle Uptrend Percentages
Cycle 1 → 52.287%
Cycle 2 → 12.804%
Cycle 3 → 2.109%
The data from these three cycles form a declining structure pattern. The decline is evident in both linear and logarithmic terms..
Cycle Volatility Ratios
How much has the percentage increase changed in each cycle?
Cycle 1 → Cycle 2 reduction ratio:
52.287 / 12.804 ≈ 4.08 times decrease.
Cycle 2 → Cycle 3 reduction ratio:
12.804 / 2.109 ≈ 6.07 times decrease.
If we take an average reduction factor between the two
(4.08 + 6.07) / 2 ≈ 5.07 times
So, Bitcoin’s cycle volatility is decreasing by approximately 5 times on average, which is our key data point.
Current Cycle (4th Potential Cycle)
The rise of the previous cycle,
Cycle 3: 2,109%
If the volatility trend continues,
2,109% / ~5 ≈ 420%
such an upward expectation would be ideal for this cycle, but additional factors exist:
The decline in volatility is not perfectly linear and becomes less severe over time.
Therefore, this 420% represents the lower bound.
What if the decline is not as sharp as before?
- If K = 4 → 2,109 / 4 = 527%
- If K is 3 → 2,109 / 3 = 703%
- If K is 2 → 2,109 / 2 = 1,054%
- If K is 1.5 → 2,109 / 1.5 = 1,406%
Therefore, the expected potential range is:
It can be said to be between ~500% and ~1400%.
Why is 1400% the upper limit?
The “collapse curve” may move slower than average in some cases. This is because the rate of price decline gradually decreases as cycles progress. Theoretically, this coefficient could approach 1; that is, an extreme scenario where volatility behaves as if it never decreased could be imagined. However, considering Bitcoin’s current market value, this scenario is statistically almost impossible.
Therefore, instead of k=1, which is a completely extreme scenario, k≈1.5 is accepted as a theoretically possible but quite difficult upper limit.
When this value is applied,
2,109% / 1.5 ≈ 1,400%
That is, 1,400% represents the band level corresponding to the rise in the most extreme scenario, where volatility reduction has almost stopped.
420% (lower limit):
From Cycle 1 to Cycle 2, it gave us approximately 4.08, and from Cycle 2 to Cycle 3, it gave us 6.07;
their average was ~5.07.
If K = 5 is taken,
2109/5 = 421.8 Therefore, ~420% is the approximate lower limit of the “fully sustained trend.”
500–700% (most likely region):
If this region corresponds to a moderately optimistic scenario, where the K value ranges between 3 and 4:
k = 4 à 527.25%
k = 3 à 703%
Thus, the approximate range of 500–700% finds a reasonable scenario where the observed rate of decline is slightly weaker (smaller k value) but still lacks irregularity.
1000–1400 (upper limit):
k = 2, ~1,000%
k = 1.5, ~1400%
This describes the high-end scenario where the reduction factor drops into the 1.5–2 range, meaning the decline in volatility has nearly stopped and growth potential is preserved. Rare, but not impossible.
This ultimately yields the following projection:
- 2,109% / 5 ≈ 420% → core of the lower band
- 2.109% / 4 ≈ 527% → reasonable lower middle
- 2.109% / 3 ≈ 703% → midpoint
- 2.109% / 2 ≈ 1,054% → upper middle
- 2.109% / 1.5 ≈ 1,406% → upper band
At present, the bottom-to-top increase has reached 715.76%, which aligns with the midpoint and upper-middle bands in this projection.
From a temporal perspective, the rise has not been disrupted as in previous cycles. Evaluating the internal structural changes of the current cycle, it is considered likely that Bitcoin may have reached its peak for this cycle at $126,272 in November 2025, potentially marking the end of the upward trend.
Where Could the Target Lows Be?
After establishing a mathematical framework for Bitcoin cycle peaks, we can apply the same approach to the statistical modeling of bottom regions. There is a common structure in both the decline percentages and decline durations of the three cycles, and this structure provides a fairly broad range for the question “where could the bottom form?” in the current cycle.
Common Pattern in Decline Percentages
Just as volatility decreased from bottom to peak across the three cycles, the severity of the decline from peak to bottom also steadily lessened in the same manner.
Cycle 1: –86.90%, Cycle 2: –84.12%, Cycle 3: –77.57%
These three numbers form a “declining collapse curve.” While the decline intensity eased by approximately 1.033 times between Cycle 1 → 2, the easing coefficient between 2 → 3 was 1.084. The average of these two values gives us approximately 1.058; that is, declines in Bitcoin occur on average 5.8% weaker from cycle to cycle. Applying this trend to Cycle 3’s data;
77.57% / 1.058 ≈ 73%–74% expected decline band, which corresponds to the “fully sustained” version of the decline trend and is the central reference value in the bottom calculation.
Cyclical Structure of Decline Periods
When examining decline periods, a consistent compression is observed across three cycles:
426 days, 364 days, 365 days
The average of these data points is approximately 385 days, and the variance is also compressed within an extremely narrow range. This situation reveals the following temporal model:
Lower time band: ~360 days
Upper time band: ~420 days
Core average: ~385 days
Assuming that the peak of the current cycle occurs around November 2025, statistically, the trough timing corresponds to the October-December 2026 range. This time band is the period when the decline area will intensify, both in percentage and time terms.
Coefficient-Based Scenario and Bottom Target for Depth of Decline
Just as with rises, three scenarios can be created using a coefficient model for declines. The coefficients numerically reflect how much the severity of the decline has eased compared to the previous cycle and the rate of volatility reduction between cycles.
Scenarios
Conservative Scenario (k ≈ 1.1)
–77.57% / 1.1 ≈ –70%
A scenario where the severity of the decline has eased relatively quickly and market correction mechanisms are in place.
Mid-Range (k ≈ 1.05)
–77.57% / 1.05 ≈ –73.8%
The segment where the decline between cycles is mathematically most concentrated; statistically, the probability-weighted bottom is in this band.
Weak Decline / Sharp Collapse (k ≈ 1.0–1.03)
–77.57% to –75%
The extreme scenario according to the logarithmic collapse curve, where volatility reduction is minimal. This band is mathematically possible but less probable.
These three scenarios generally form the 70–80% range and are consistent with the coefficients derived from previous cycles. While 420% represents the core lower limit on the upside, around –73% represents the core central band on the downside.
Bottom Calculation with a $126,000 Peak Reference
Considering cyclical volatility contraction, crash coefficients, and historical decline depths, the probability-weighted bottom zone at the $126,000 peak level emerges as follows:
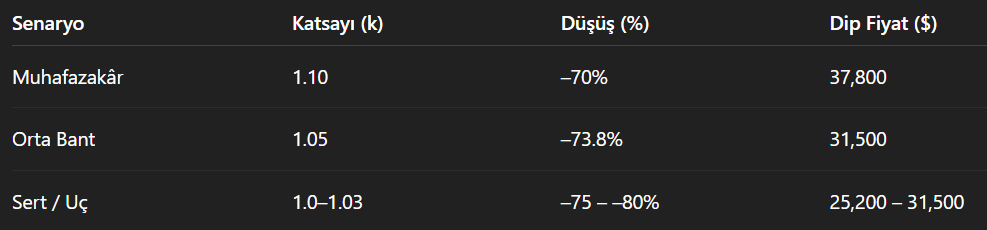
The middle band ($31,500) represents the probability-weighted bottom position that intersects the average of the decline intensities of three cycles and the logarithmic collapse curve.
Mathematically, since this band shows the highest clustering with both inter-cycle coefficients and decline variances, it can be considered the most rational price band for macro bottom formation in the current cycle.
Beyond Projections
All these numerical data, cyclical projections, and mathematical models provide a critical guide for understanding Bitcoin’s historical price behavior and anticipating possible movements in the current cycle. However, the crypto market is not limited to its own internal mechanisms.
Potential US interventions in crypto, new regulatory steps, sudden changes in central bank monetary policies, or unexpected shocks in global financial markets can quickly reverse even the most robust-looking cycles. Although the statistically most probable trough and peak ranges we observe today are calculated using volatility and crash curves, a single policy decision, macroeconomic crisis, or liquidity fluctuation can render these forecasts completely invalid. Therefore, it is not sufficient for investors to rely solely on mathematical projections; they must also closely monitor macroeconomic, political, and psychological factors that could impact the market and develop more flexible and adaptive strategies. It should be remembered that although Bitcoin’s cycles have followed a certain rhythm in the past, the certainty of future cycles is never guaranteed; at any moment, any external influence can disrupt the current trend and change the predicted upward or downward bands. Therefore, while this analysis serves as a roadmap, investors should always factor in market uncertainties and unexpected disruptions and not rely solely on past data when managing risks; because in the crypto world, exceptions and surprises can emerge at a speed and intensity far beyond what mathematics predicts.
Disclaimer
This analysis is based on historical price cycles, statistical modelling, and theoretical volatility assumptions. It does not guarantee future performance and should not be considered financial advice. Cryptocurrency markets are highly volatile, and external factors such as regulations, macroeconomic shifts, and liquidity shocks can invalidate any projection. Investors should conduct their own research and assess their risk tolerance before making decisions.