
BTC/USDT
In this week of accelerating developments on the crypto and macro fronts, institutional appetite for Bitcoin and digital assets continues to strengthen. MicroStrategy’s $1.42 billion purchase of 15,355 BTC, Metaplanet’s new bond issuance, and the state of Arizona’s passage of the Bitcoin reserve law reveal that institutional strategies are becoming clearer. Coinbase’s launch of a yield-focused Bitcoin fund for non-US institutions and Morgan Stanley’s crypto move point to the market’s integration with traditional finance. On the other hand, weak GDP and employment data from the US signals an economic slowdown, while messages that the doors to negotiations with China on tariffs have been opened soften the geopolitical agenda. All these dynamics, combined with Bitcoin’s tight supply, once again highlight the resilient nature of crypto markets. This week, eyes will once again be on the US interest rate meeting, after which Powell and Fed officials’ statements will give an important message about the medium-term course.
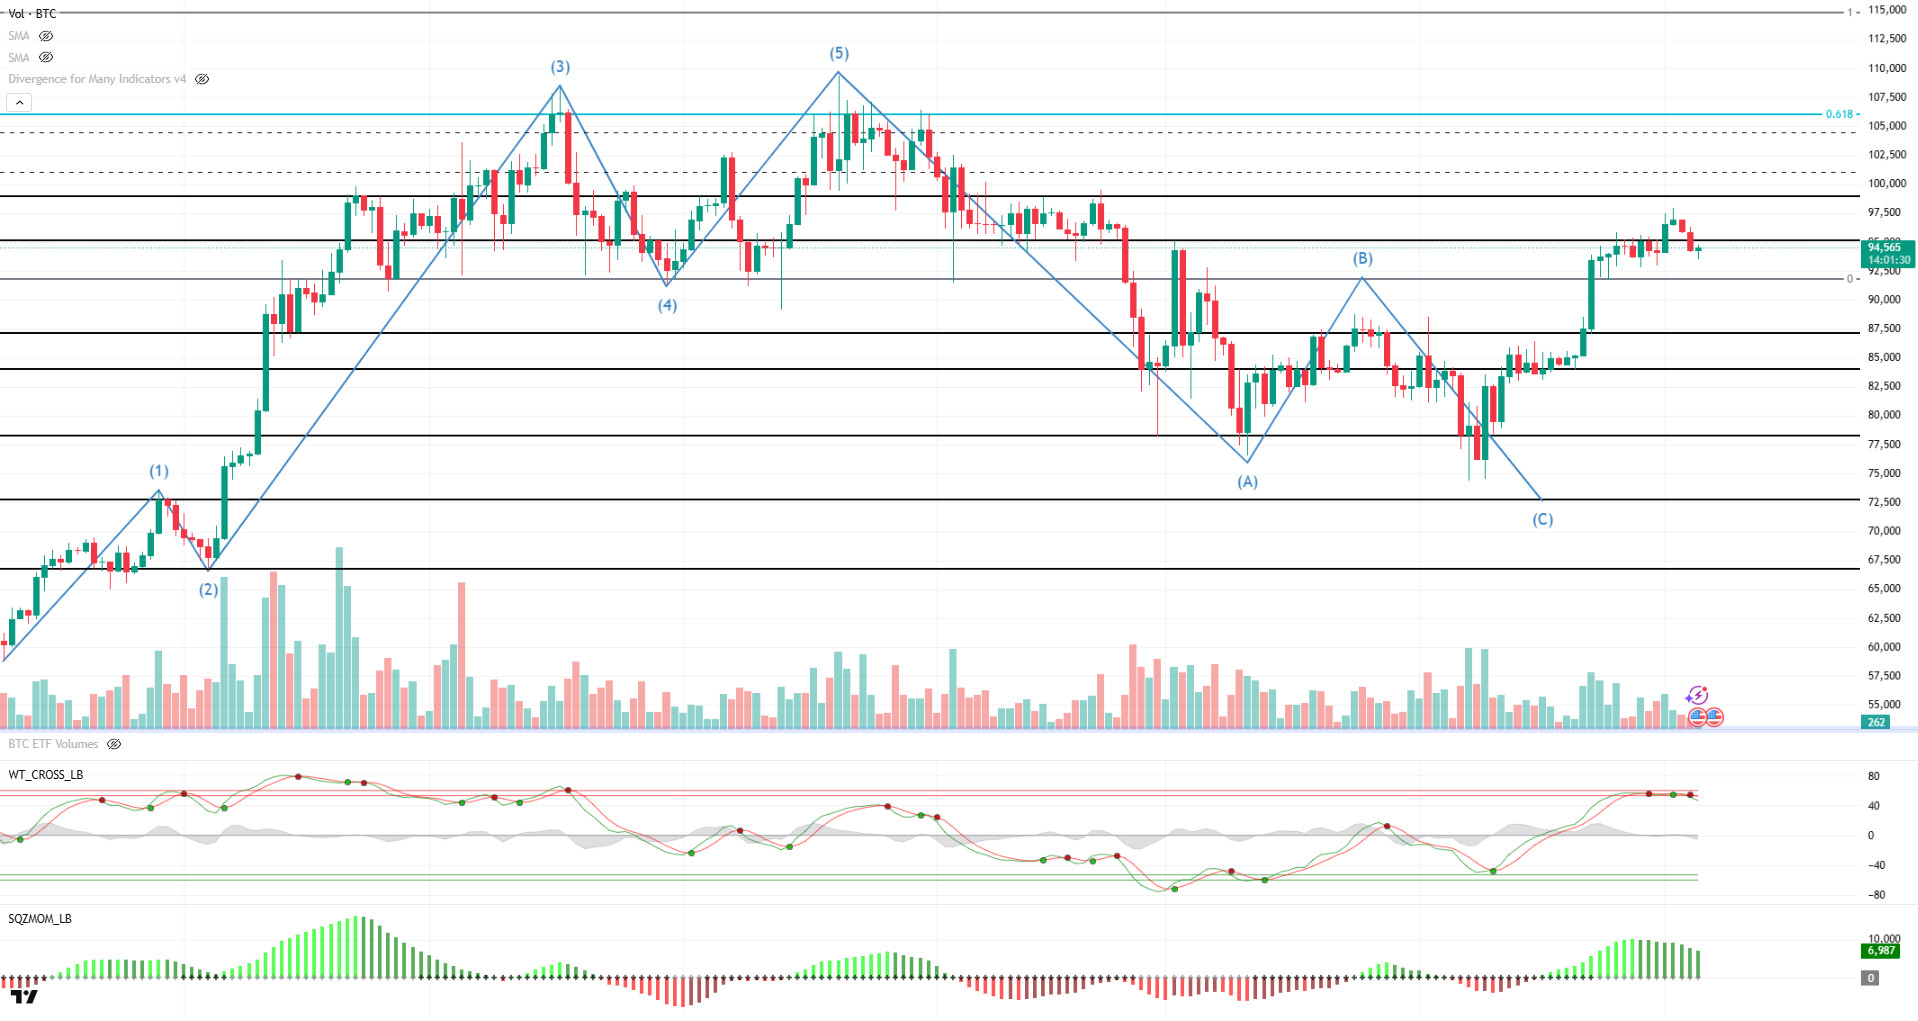
Looking at the technical outlook, it seems that BTC has left behind a week in which it entered the consolidation phase with low volatility. BTC, which started the week at 95,000, tested the 97,900 level during the week, then corrected and fell below the 94,000 level once again. The price, which managed to recover afterwards, continues to push the 95,000 level again and is preparing to close the week with a limited rise of about 0.92%. It is noteworthy that BTC, which draws a chart in line with the Elliott Wave Theory, turned its direction up again after the pattern. BTC, which forms a bullish pennant pattern with the uptrend on the daily chart, may move towards the previously tested 3rd and 5th wave peaks if it breaks in line with the pattern after the consolidation phase. In this context, while persistence above the 95,000 level is seen as critical for regaining momentum, closures below this level stand out as a factor that increases selling pressure. On the technical indicators side, it is noteworthy that the wave trend oscillator gives weakening buy-sell signals in the overbought zone on a daily basis, while momentum indicators tend to weaken significantly. This indicates that there is a favorable ground for a possible technical correction. While it is noteworthy that selling positions are relatively rare in liquidation data, it is seen that unrealized short orders started to accumulate at the 98,000 level. On the other hand, it is also noteworthy that long positions are concentrated above the 92,000 band. This indicates that selling pressure may increase if the price heads towards 98,000 levels again, while the optimistic perception in the market can be maintained with the increase in buying positions after a possible correction.
Supports 92,000 – 87,000 – 84,000
Resistances 95,000 – 99,000 – 101,400
ETH/USDT
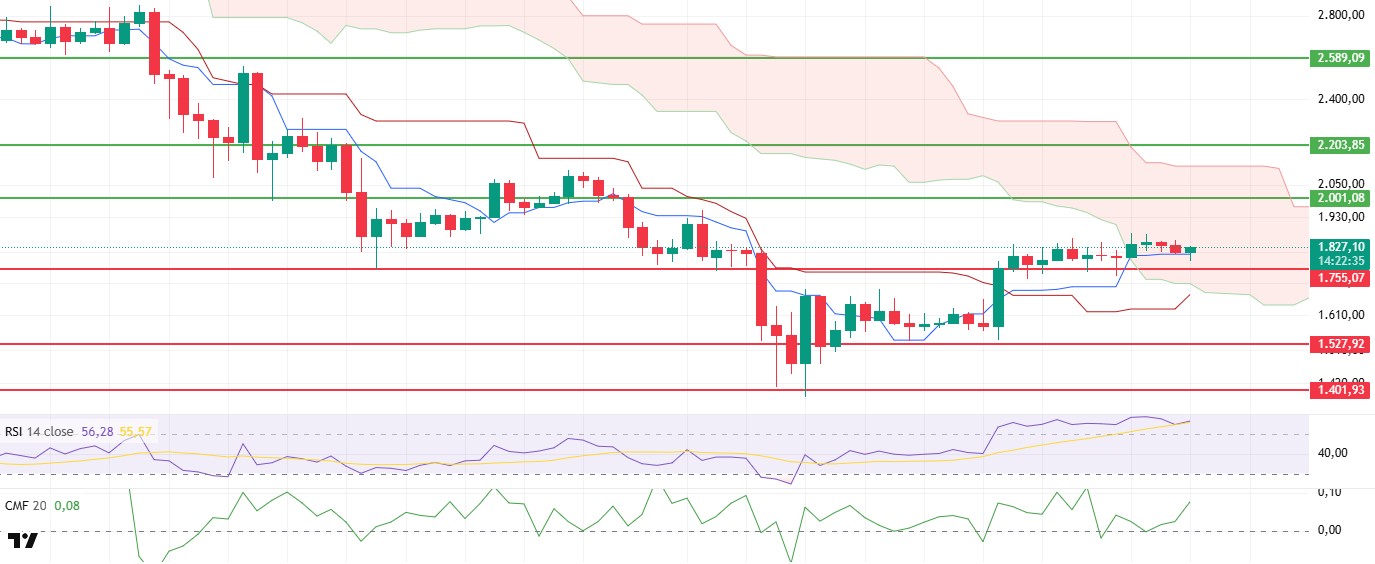
Last week, ETH managed to overcome an important technical resistance by breaking above the $1,755 level and then moved sideways. Remaining above the Tenkan level, the price is still priced inside the kumo cloud according to the ichimoku indicator. This structure suggests that the current trend remains positive and upside potential remains. The price’s position in the cloud suggests that the upward trend is more dominant, although it remains in the indecision area. In particular, the tenkan level support is critical for short-term price stability. When the on-chain data is analyzed, structural weaknesses stand out in contrast to the price. According to CryptoQuant data, there is a noticeable decline in the number of active addresses on the Ethereum network. This decline reveals that user interaction is decreasing and the basic activity on the network is weakening. In addition, the amount of ETH staked on Beacon Chain is also gradually decreasing. This data points to a weakening of investor confidence and an increasing loss of interest in the fundamentals of the Ethereum network in the medium term. Therefore, even if the price follows a positive course, these weaknesses in on-chain metrics are among the warning signals that should be carefully monitored.
On the technical indicators side, a more positive picture is emerging. The Chaikin Money Flow (CMF) indicator resumed its upward movement after falling to the zero line twice last week. This shows that the liquidity entering the market has increased again and the flow of buying money continues. The fact that CMF remains in positive territory confirms that buyers are still active in the market and the price remains resistant to declines. In parallel, Cumulative Volume Delta (CVD) data also point to a remarkable divergence in the last two weeks. Although the ongoing selling pressure on the futures side may put pressure on the price in the short term despite the predominance of buying in the spot markets, in total, this structure seems to have a supportive effect on spot in the medium term. While spot investor dominance usually points to more persistent price movements, futures selling tends to remain as short-term speculative moves. In the case of the Ichimoku indicator, the fact that the price moves above the tenkan level and inside the kumo cloud indicates that the upward trend continues in technical terms. While the fact that the cloud has not descended below the cloud indicates that the support zone remains intact, it creates a ground where the positive structure can gain momentum if the short-term resistances are broken upwards. There are also supportive signals on the momentum side. The Relative Strength Index (RSI) indicator is running the 55 level as support and the RSI, which continues to hold above this level, indicates that the upward momentum continues.
Overall, ETH price may continue its uptrend this week, supported by technical indicators. However, the on-chain data, which is inconsistent with the price, reveals that the current positive outlook is not yet fully aligned with the fundamental side. Therefore, the $1,755 level stands out as a critical support. If this level is broken downwards, selling pressure may accelerate and the price may retreat to $1,527 levels again. On the other hand, if upward movements continue, the $2,000 level is key resistance. A breakout of this area on volume could be the start of a stronger uptrend for ETH, which could see the price search for direction on higher timeframes once again.
Supports 1,755 – 1,527 – 1,401
Resistances 2,001 – 2,203 – 2,589
XRP/USDT
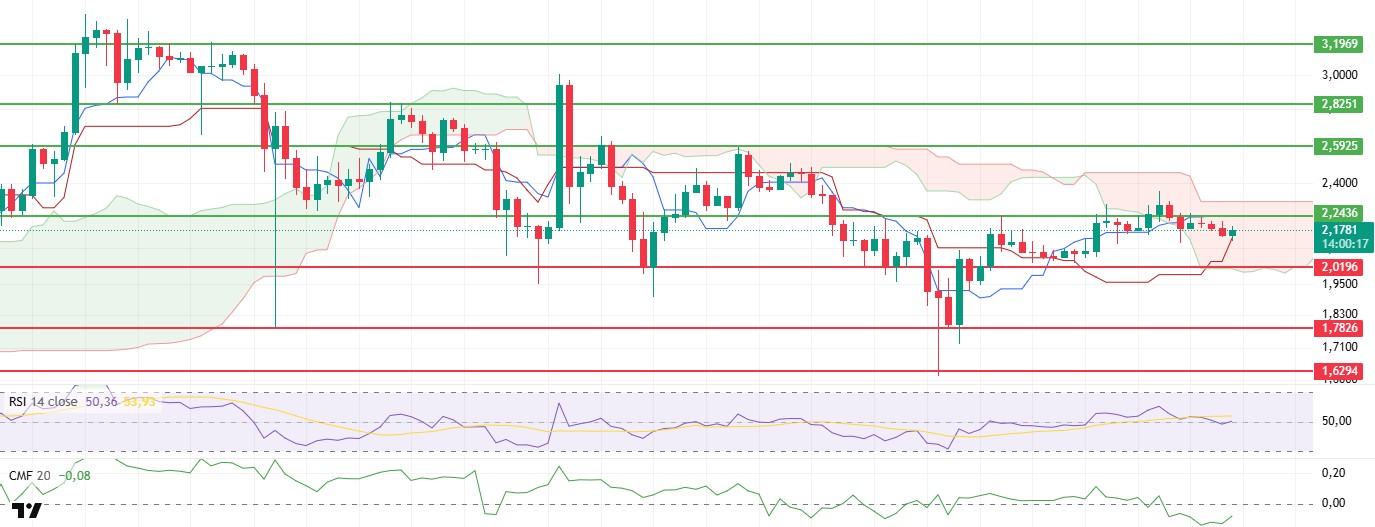
XRP, which made a strong technical breakthrough by exceeding the $2.24 level last week, started the week with a horizontal and narrow-banded price movement in the $2.18-2.20 band. The price zone in question tends to create a strong support ground while encountering resistance due to the impact of profit realizations. This outlook indicates that the short-term consolidation process continues, and investors are waiting for a new directional catalyst. On the fundamentals side, developments in Ripple’s ecosystem are giving remarkably positive signals. The adoption rate of the new stablecoin RLUSD continues to increase. With a market capitalization of over $293 million, RLUSD has been integrated into the Ripple Payments system, offering more secure and stable payment solutions for organizations. This development is extremely important in terms of expanding the usage areas of XRP. However, MasterCard’s consideration of XRP as a bridge currency for cross-border payments signals a long-term vision for the integration of traditional finance and the crypto ecosystem. Such institutional acceptance trends could have lasting effects on the price by strengthening XRP’s fundamental value proposition.
In terms of technical indicators, the data provided by the Ichimoku indicator remains remarkable. The buy signal generated by the Tenkan line crossing the Kijun line upwards is still valid. This signal is an important indication that the trend may be on the upside. However, the fact that the price is moving in a kumo cloud reveals that market participants are indecisive and the direction is not yet clear. In this case, exceeding the upper band of the kumo cloud at $ 2.30 is a critical threshold that confirms the upward breakout both in terms of Ichimoku and as a psychological resistance level. A sustained pricing above this level could bring a new bullish momentum for XRP. The Chaikin Money Flow (CMF) indicator, which monitors liquidity flow, has recently remained in negative territory. This indicates that the net outflow of money to the market continues, and the seller side is still active.
In light of all this data, it seems likely that the XRP price will continue to consolidate in the $2.18-$2.20 band in the short term. Unless there is a break below this band, this horizontal course may indicate that the accumulation process continues. On the other hand, if the $2.30 level is exceeded in volume, the possibility that the upward movement will gain momentum and a new upward wave towards the $2.45 – $2.59 range will begin is strengthening. In the opposite scenario, the loss of the $2.18 support may cause the price to head towards the lower limits of the kumo cloud again. Therefore, it is crucial that investors closely monitor these critical technical levels and practice effective risk management, especially during periods of increased volatility.
Supports 2.0196 – 1.7826 – 1.6294
Resistances 2.2436 – 2.5925 – 2.8521
SOL/USDT
Last week in the Solana ecosystem.
- DeFi Development Corp. announced that it aims to raise a total of $1 billion in capital by selling securities to purchase Solana (SOL) tokens over time.
- RockawayX has raised $125 million in funding to support Solana startups.
- Huma Finance, the first PayFi network, surpassed $4 billion in total transaction volume (TTV) two weeks after the introduction of Huma 2.0.
- Nous Research received $50 million from Paradigm to build decentralized AI on Solana.
- The US Securities and Exchange Commission (SEC) announced that it has postponed its decision on Franklin Templeton’s spot Solana (SOL) ETF application.
- Solana Policy Institute, Superstate and Orca seek SEC approval to trade securities on public blockchains. SOL Strategies Inc. announced a $5 billion Solana token purchase. The first $20 million in notes will be released on May 1, 2025.
- Classover Holdings, Inc. announced on May 1 its plan to sell up to $400 million of equity to Solana Strategies Holdings LLC and integrate Solana (SOL) tokens into its reserves.
- Janover DeFi Development Corp announced on May 1 a $24 million PIPE investment to develop its Solana holdings.
On the on-chain side;
- Solana’s stablecoin supply reached an all-time high of 12.80 billion.
- Marinade Finance has just announced the “Instant Unstake” feature, allowing staking users to shoot without waiting.
- 1inch launched on Solana plans a cross-chain swap for more than 1 million Solana tokens.
- The Solana network has crossed the 400 billion transaction mark.
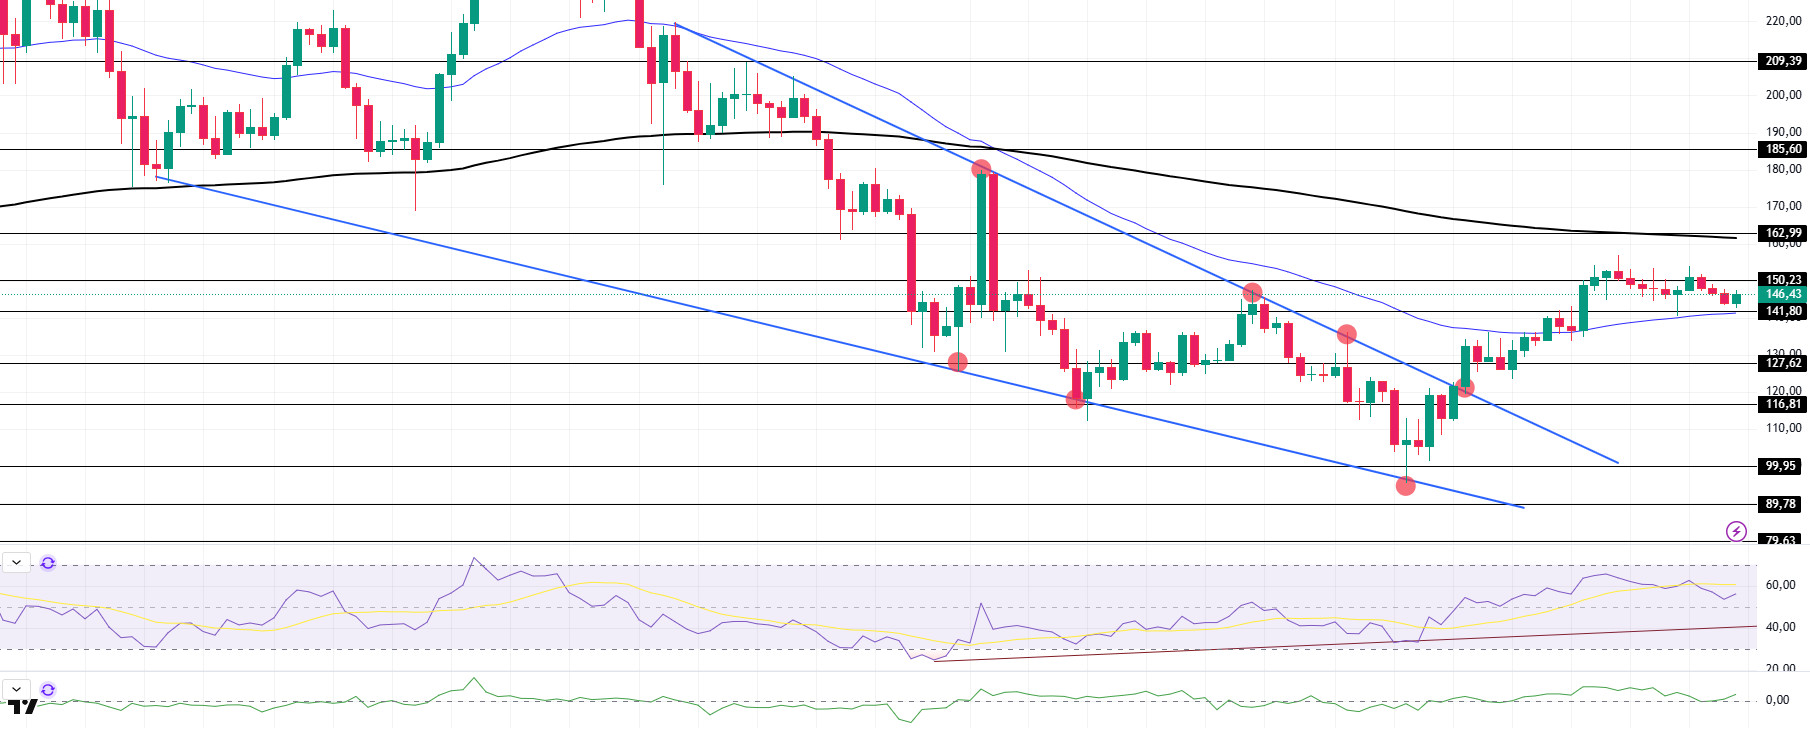
SOL managed to break the downtrend formed on March 3 on the daily chart. After testing the 50 EMA (Blue Line) as support, the price managed to stay above this level. If the strong resistance level of $150.23 is broken to the upside, $162.99 and 200 EMA (Black Line) can be targeted respectively. Otherwise, the $127.62 level should be monitored in downward movements. The asset is still trading between the 50 EMA and the 200 EMA, indicating that investors are indecisive. Moreover, the fact that the 50 EMA continues to remain below the 200 EMA indicates the formation of a “death cross” from a technical point of view, indicating that the downside potential remains in the medium term. The RSI (14) remains in positive territory while the uptrend that started on February 26 is still in effect. This means that the price may continue its upward movement. Chaikin Money Flow (CMF-20) is in positive territory; an increase in money inflows may further strengthen this indicator. If macroeconomic data remains favorable and ecosystem developments remain positive, the first major resistance point at $162.99 could be tested. Conversely, in case of possible negative news flow or deterioration in macro data, the $116.81 level can be monitored as a potential buying opportunity.
Supports 141.80 – 127.62 – 116.81
Resistances 150.23 – 162.99 – 185.60
DOGE/USDT
- 21Shares has submitted a proposal to list a spot Dogecoin (DOGE) ETF on Nasdaq in an effort to enable traditional investors to invest directly in the popular cryptocurrency.
- SEC postponed the Bitwıse spot Dogecoin ETF until June 15.
- Elon Musk shared a Doge-themed post from the X platform.
- Elon Musk told Trump on Wednesday that he would step back from DOGE and leave the cabinet.
- Nasdaq is seeking SEC approval to list the 21Shares Dogecoin ETF, while Coinbase Custody Trust will hold the fund’s tokens and serve as the official custodian for the ETF.
On the on-chain side;
Dogecoin whales have raised 100 million DOGE.
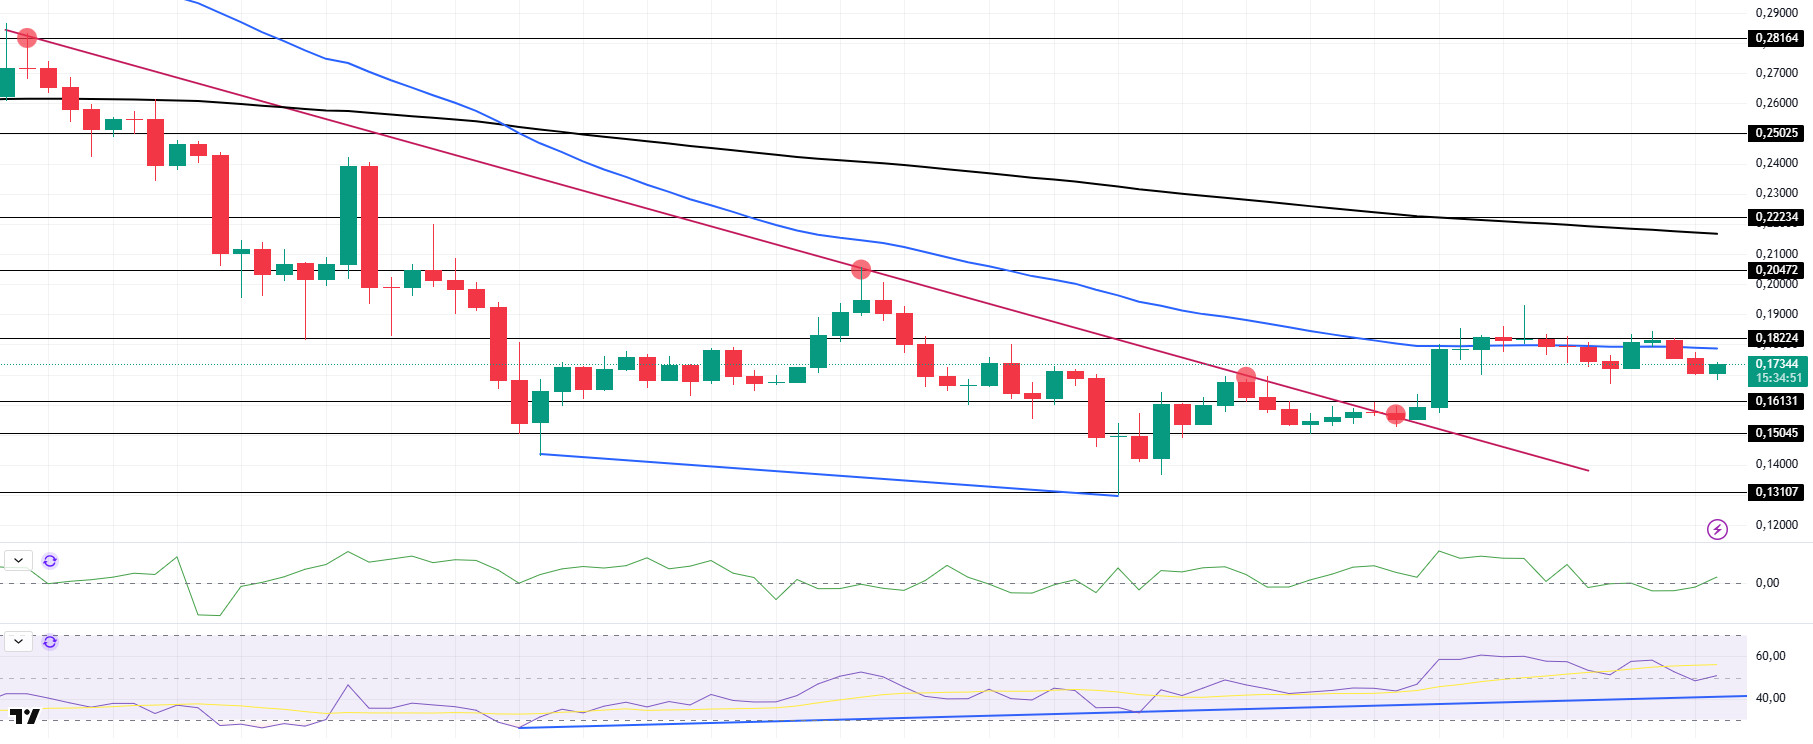
DOGE has been exhibiting a sideways price action on the daily chart since last week. The downtrend that started on February 14 was broken upwards by a candle on strong volume and the price tested the 50 EMA (Blue Line). However, it failed to break through this level. The 50 EMA remains below the 200 EMA (Black Line), indicating that the “death cross” pattern remains valid. This suggests that bearish pressure may continue in the medium term. Although the Chaikin Money Flow (CMF-20) indicator has turned positive, increased outflows suggest that this indicator may move back into negative territory and price pressure may increase. RSI (14) is still in positive territory and the uptrend since April 7 continues. This strengthens the possibility of a recovery in the short term. In case of macroeconomic risks or negative news from the ecosystem, the $0.16131 level can be monitored as a strong support. On the other hand, if the upward movement gains strength, $0.20472 stands out as the first strong resistance level.
Supports 0.16131 – 0.15045 – 0.13107
Resistances 0.18224 – 0.20472 – 0.22234
TRX/USDT
Last week, another 1 billion USDT was minted on the Tron network, bringing the total USDT supply on the network to $71.7 billion. A total of 47.58 million TRX burns took place during the week of April 28 – May 4. These burns continue to have a deflationary effect on TRX supply. Tron founder Justin Sun announced the completion of the integration of USD1, the stablecoin of Trump-backed World Liberty Financial, which he advises, on the Tron blockchain at the Token2049 conference in Dubai. USD1 currently has a total circulating supply of $2.1 billion. In addition, according to data from blockchain analytics platform Artemis, the Tron network’s total revenue for April was $51.7 million. With this revenue level, it maintained its first place among all other networks.
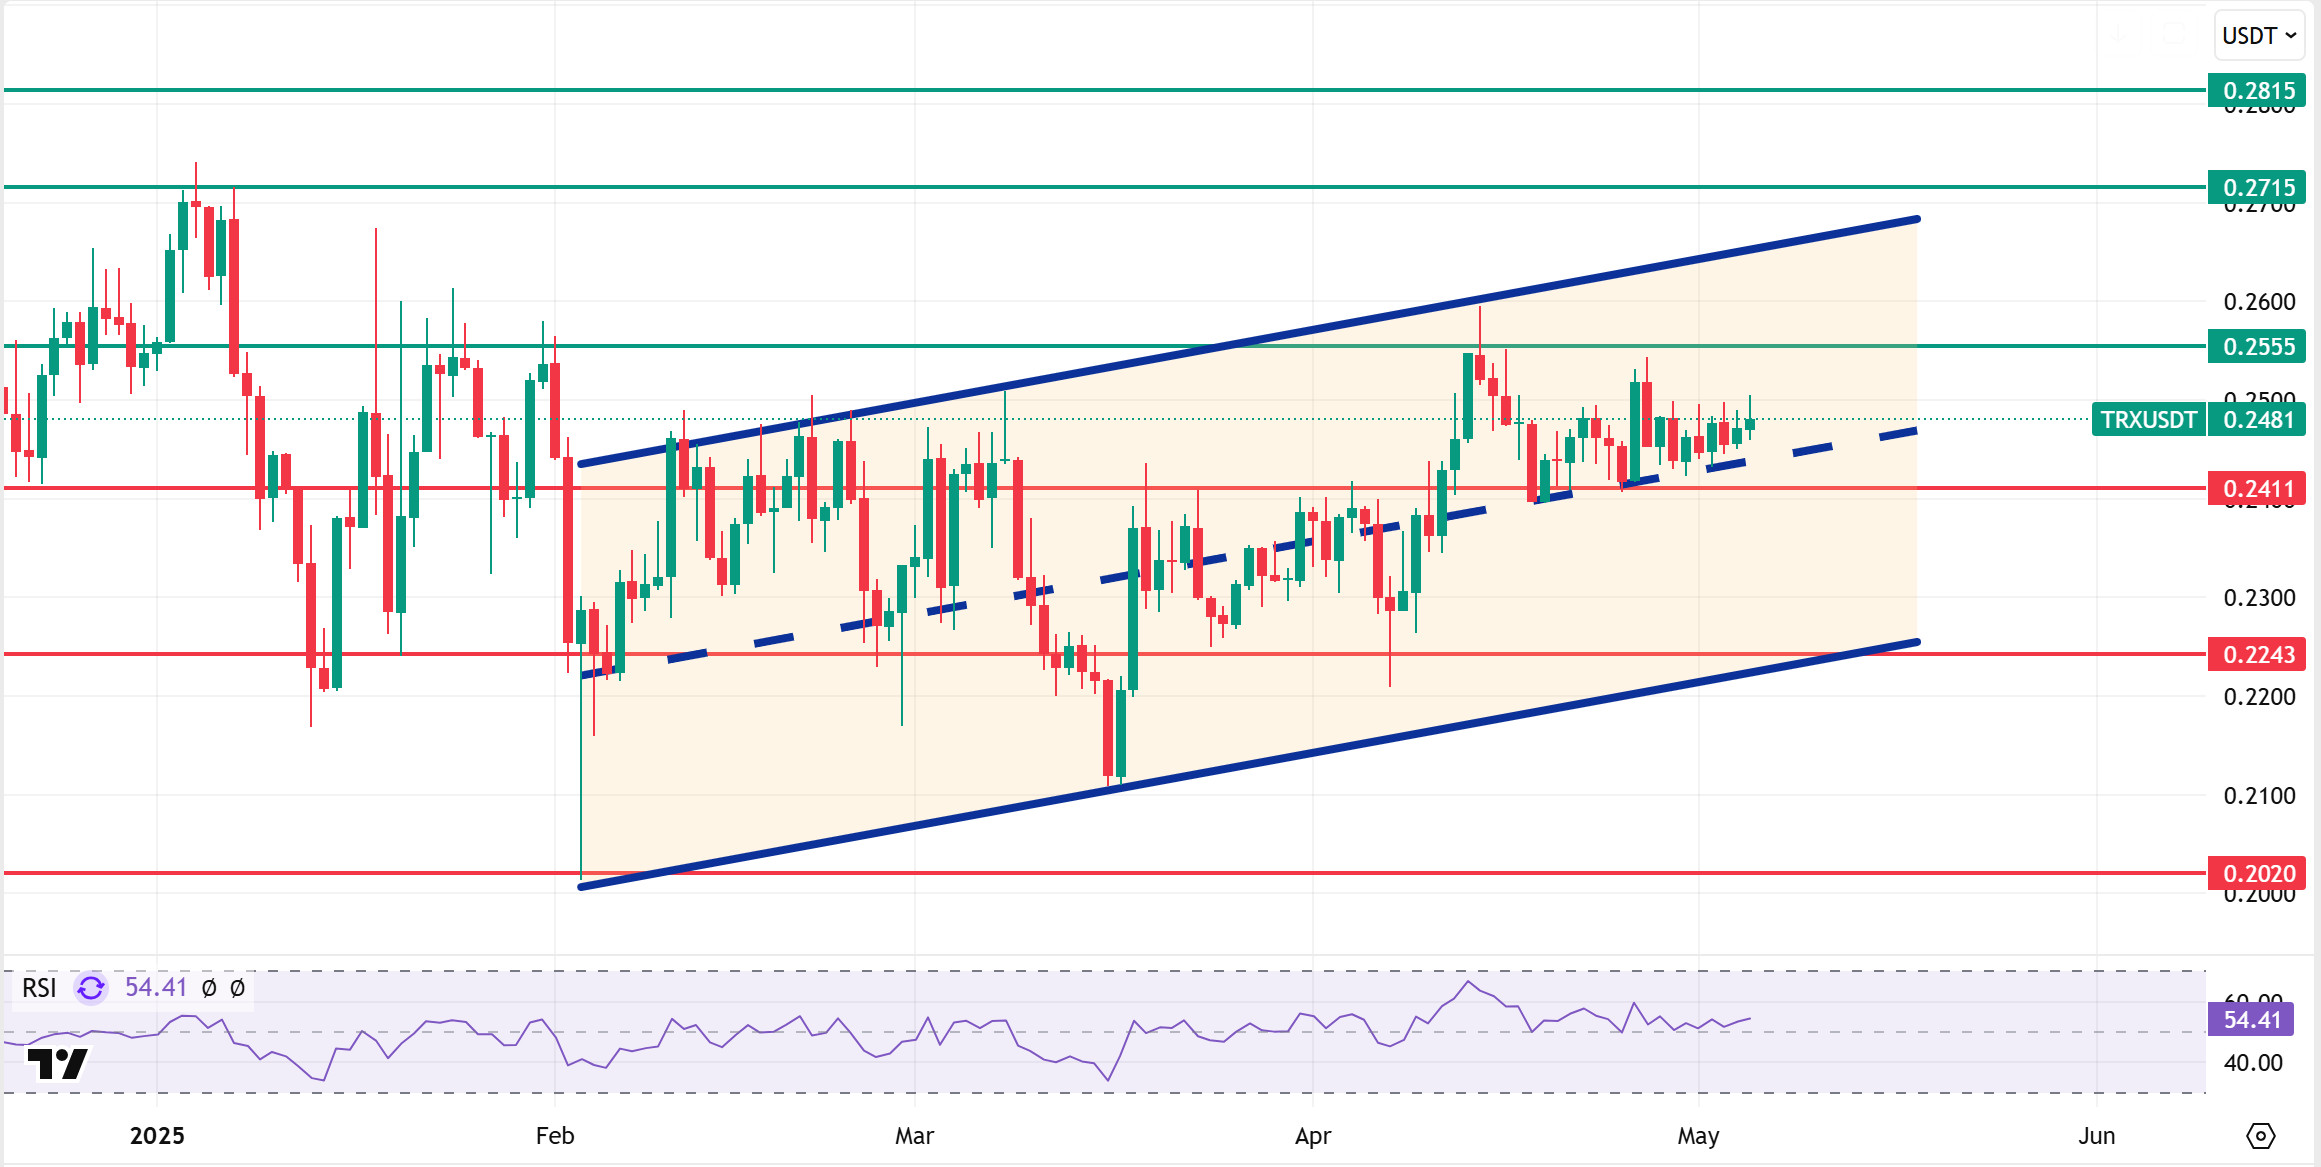
TRX, which started last week at 0.2453, rose about 0.5% during the week and closed the week at 0.2472. TRX, which is currently trading at 0.2481, continues its movement within the bullish channel on the daily chart and is in the middle band of the channel. The Relative Strength Index (RSI) value can be expected to move towards the upper band of the channel by rising slightly from the level of 54. In such a case, it is expected to test the 0.2555 resistance. If it closes daily above the 0.2555 resistance, it may continue its rise and may want to test the 0.2715 resistance. If it fails to close daily above the 0.2555 resistance, it may decline with possible selling pressure. In such a case, it may test 0.2243 support. As long as it stays above 0.2020 support on the daily chart, the bullish demand can be expected to continue. If this support is broken, selling pressure may increase.
Supports 0.2411 – 0.2243 – 0.2020
Resistances 0.2555 – 0.2715 – 0.2815
AVAX/USDT
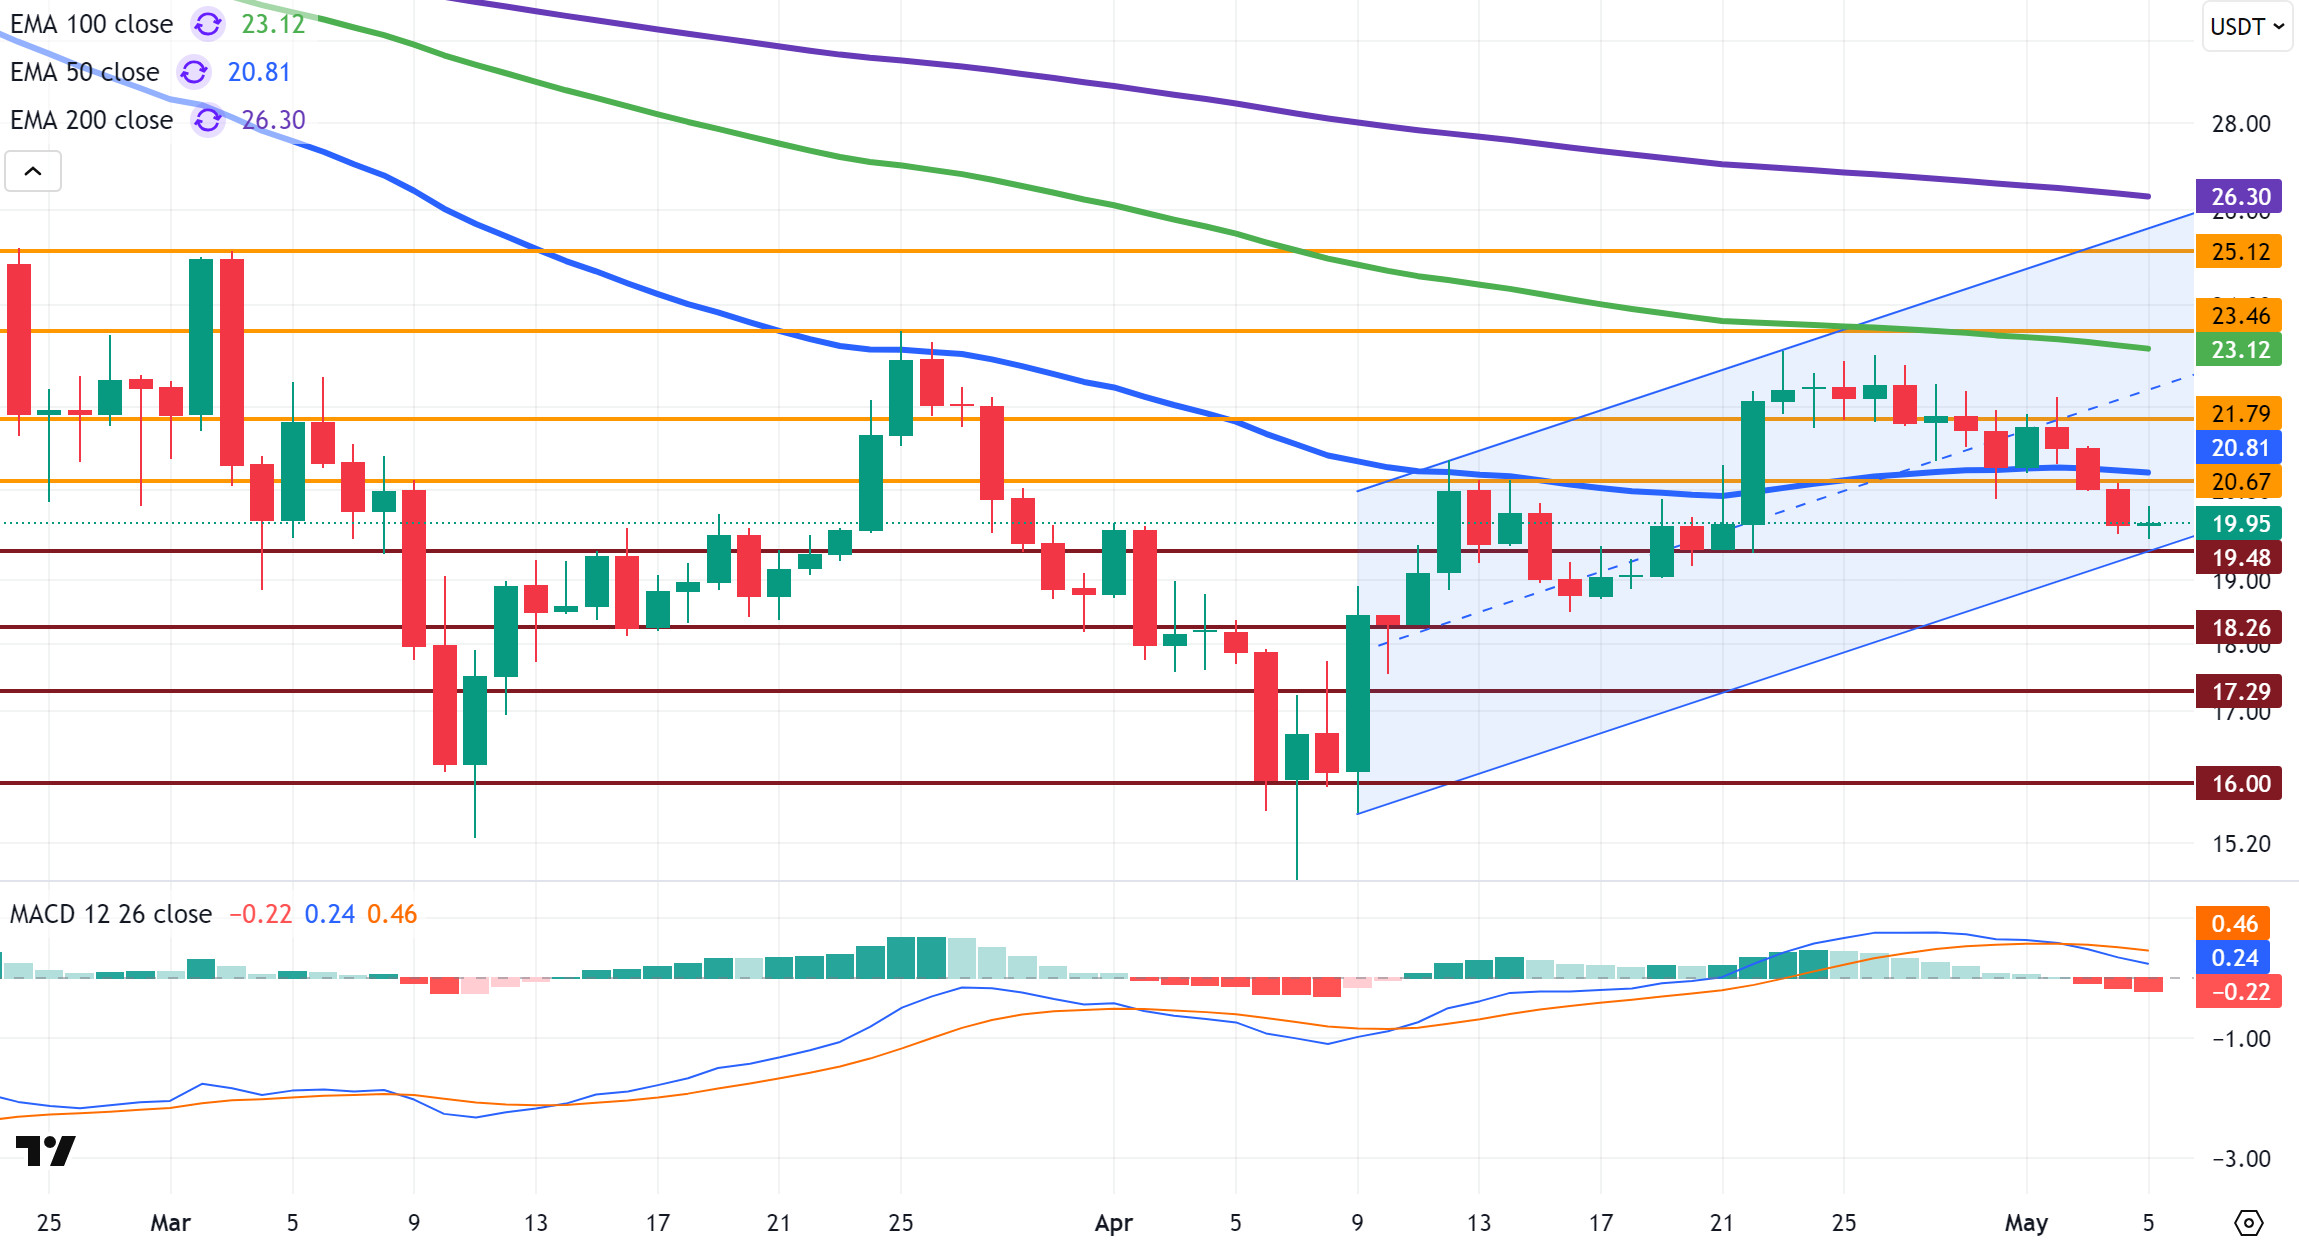
After starting last week at $21.69, AVAX could not break the resistance level of $21.79 on a daily basis for five days, despite testing it for five days. After testing and failing to break the resistance level in question, it started to decline with the incoming sales. With its decline, it broke both the 50-period Exponential Moving Average (EMA50) and the $20.67 support level and fell below $20.00. The weekly close was realized at $19.88. Although AVAX continues to trade within the bullish channel, technical indicators suggest that the positive momentum is weakening, and momentum may turn negative. AVAX is currently trading very close to the lower band of the bullish channel and if this level is broken downwards, the decline may deepen.
On the daily chart, the Moving Average Convergence/Divergence (MACD) line has broken below the signal line and this intersection indicates a downward acceleration in momentum. Although it remains in positive territory, the bearish signal is gaining weight. It is also trading below the EMA50 level, suggesting continued short-term technical weakness.
If AVAX continues to stay below the EMA50 level, it may retest the $19.48 support. In case of persistence below this level, the decline towards $18.26 and then $17.29 support levels may deepen. Especially if the bullish channel lower band breaks, selling pressure may increase further. However, if AVAX rebounds and closes above the EMA50 level at $20.67, it may retest the $21.79 resistance level with its upward movement. If this level is broken, it may test the EMA100 and $23.46 resistances. Due to the weakening momentum, this scenario will require volume buying and positive fundamental developments.
(EMA50: Blue Line , EMA100: Green Line , EMA200: Purple Line)
Supports 19.48 – 18.26 – 17.29
Resistances 20.67 – 21.79 – 23.46
SHIB/USDT
Shiba Inu (SHIB) experienced notable developments on the fundamental side over the past week. The US Securities and Exchange Commission’s (SEC) decision not to treat SHIB as a security, coupled with the Trump administration’s crypto-friendly approach, led to a week of reduced regulatory risk perception. This is a positive signal for investors who have been on the sidelines for a long time due to “regulatory uncertainty”. On the ecosystem side, the launch of SHIB Pay stands out as a concrete example of Shiba Inu’s efforts to become more functional in payment infrastructure. The vision of moving to a decentralized, direct payment system demonstrates the desire to position SHIB not only as a speculative asset, but also as a digital payment solution. However, on-chain data suggests that the market is hesitant to price in these developments. Fluctuations in daily trading volumes and large transfers suggest that institutional investors are particularly cautious. Nevertheless, the large 228% surge in trading volume seen at the beginning of May could be a clue to a potential strategic move.
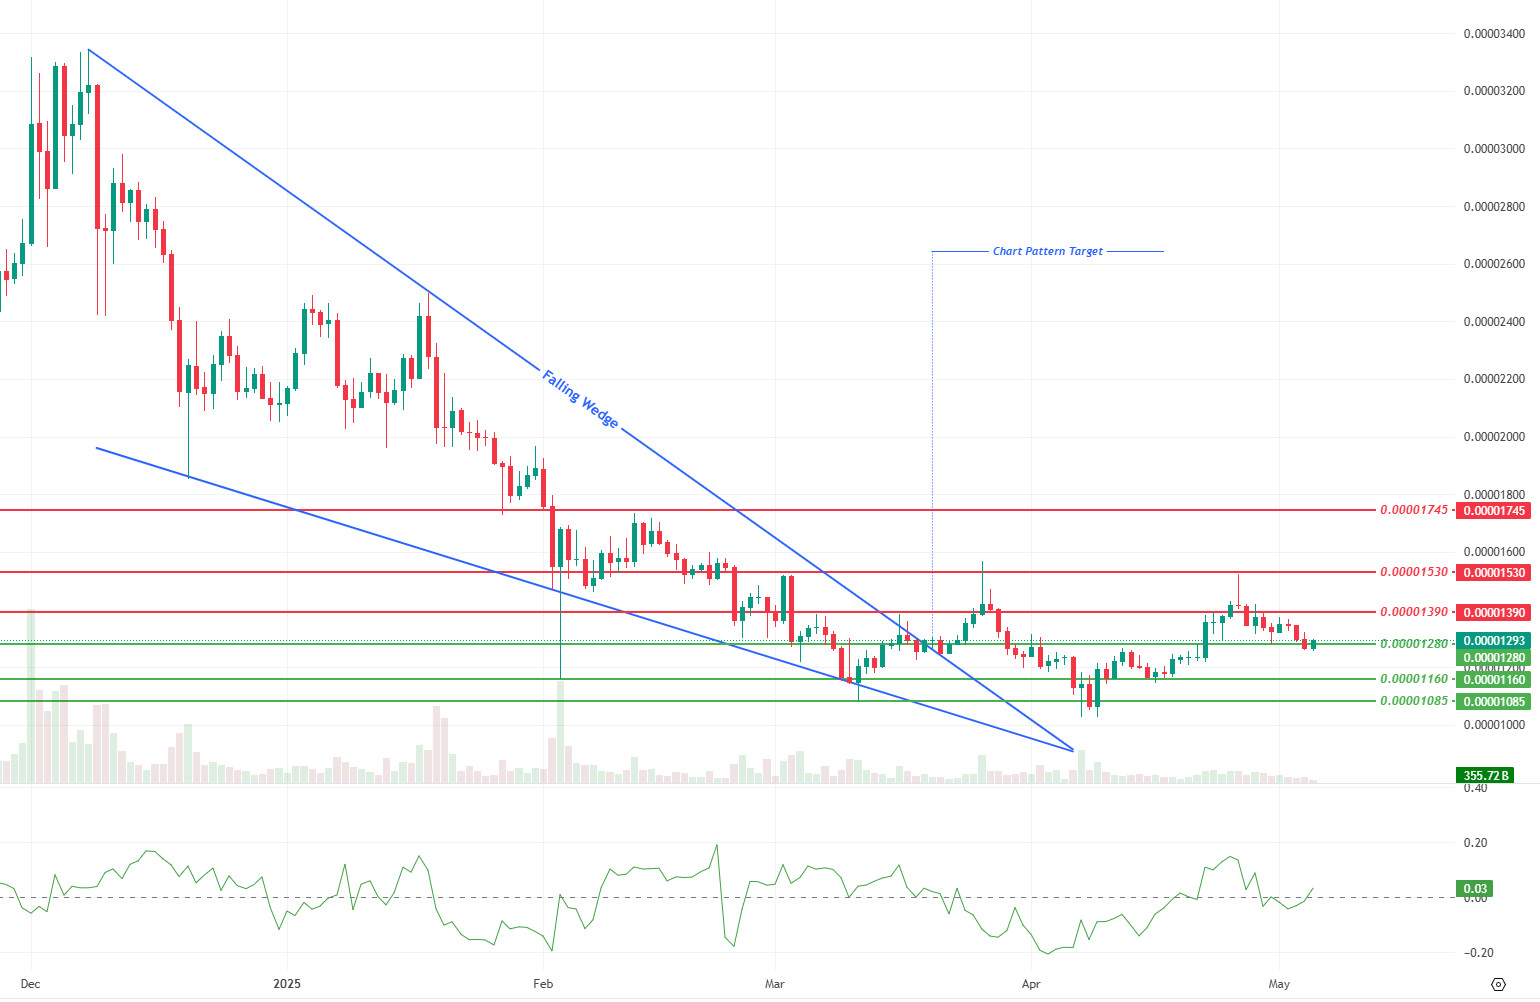
Shiba Inu exhibited a technically weakening market structure this week. After last week’s sell reaction from the $0.00001530 level, the price retreated to the $0.00001280 support level amid declining trading volume and falling volatility. This bearish process suggests that the market lacks the strength to sustain upside moves and buyers remain cautious. The significant decline in momentum suggests that the market has become indecisive about its direction and needs a new catalyst. The Chaikin Money Flow (CMF) indicator remains in positive territory, indicating that despite the selling pressure, capital inflows have not completely stopped. This suggests that buyers have not completely withdrawn from the market and the willingness to reposition at certain support levels continues. Technically, the 0.00001280 dollar level stands out as a critical support for the continuation of this trend. If this level is maintained, the possibility of an upward recovery will remain alive. The first resistance zone to be followed in a possible rise is at the level of 0.00001390 dollars. If this resistance is exceeded, it may be possible to test the 0.00001530 dollar level again. The fact that the weekly close was realized at $ 0.00001267 indicates that the support of $ 0.00001280 has fallen below the support of $ 0.00001280 and the persistence below this level has begun. This indicates that the weakening in the short-term technical outlook has been confirmed and downside risks have increased. The technical outlook suggests that short-term direction can only be determined by strong and bullish breakouts at significant support or resistance levels. In this context, it can be said that both an external triggering development and a significant increase in trading volume are needed for the market to gain a new direction.
Supports 0.00001280 – 0.00001160 – 0.00001085
Resistances 0.00001390 – 0.00001530 – 0.00001745
LTC/USDT
This week, the SEC needs to make a decision on the LTC ETF filed by Canary. If the application is accepted, a rapid rise on LTC may begin, but it should not be forgotten that the possibility of being postponed again is still on the table.
Litecoin started this week at 85.05, down 0.4% last week. In this process, it lost 0.88% against Bitcoin. While its current market capitalization hovered around $6.900 billion, it maintained its 21st place in the crypto market rankings last week. The amount of open positions on futures decreased by $6 million compared to last week, holding an open position of $233 million, while funding rates are positive. This reflects a cautious but optimistic expectation in the market.
On the technical side, Elliot Wave analysis shows that a new wave of impulse has started since June 22. In this structure, where each wave of correction corresponds to the Fibonacci “1” level, it is assumed that wave 4 is completed provided that it does not go below 63.27. In this case, it is predicted that the 5th wave may have started and if it continues with the same Fibonacci measurement, the price may accelerate to a minimum of $ 186.32.
The first resistance in upward movements is at 98.74 dollars. This point stands out as a critical zone where selling pressure may intensify. If resistance is overcome, the next target will be the horizontal resistance at the $110.00 level. If Litecoin manages to break this level, a strong resistance zone starting at the $130.00 level and extending to the $143.00 band may come to the fore. However, breaking through these levels is only possible with strong news flow such as ETF approval or general market momentum.
In downward movements, the first important support level stands out as 86.86 dollars. Below this level, the $81.89 level, which has been tested in recent weeks and works as a local bottom, is another critical support. In harder retracements, the $ 55.55 level, where the rising trend line crosses, is considered a strategic point to be monitored in terms of possible reaction purchases.
Resistances 98.74 – 110.00 – 130.00
Supports 86.86 – 81.89 – 55.55

LINK/USDT
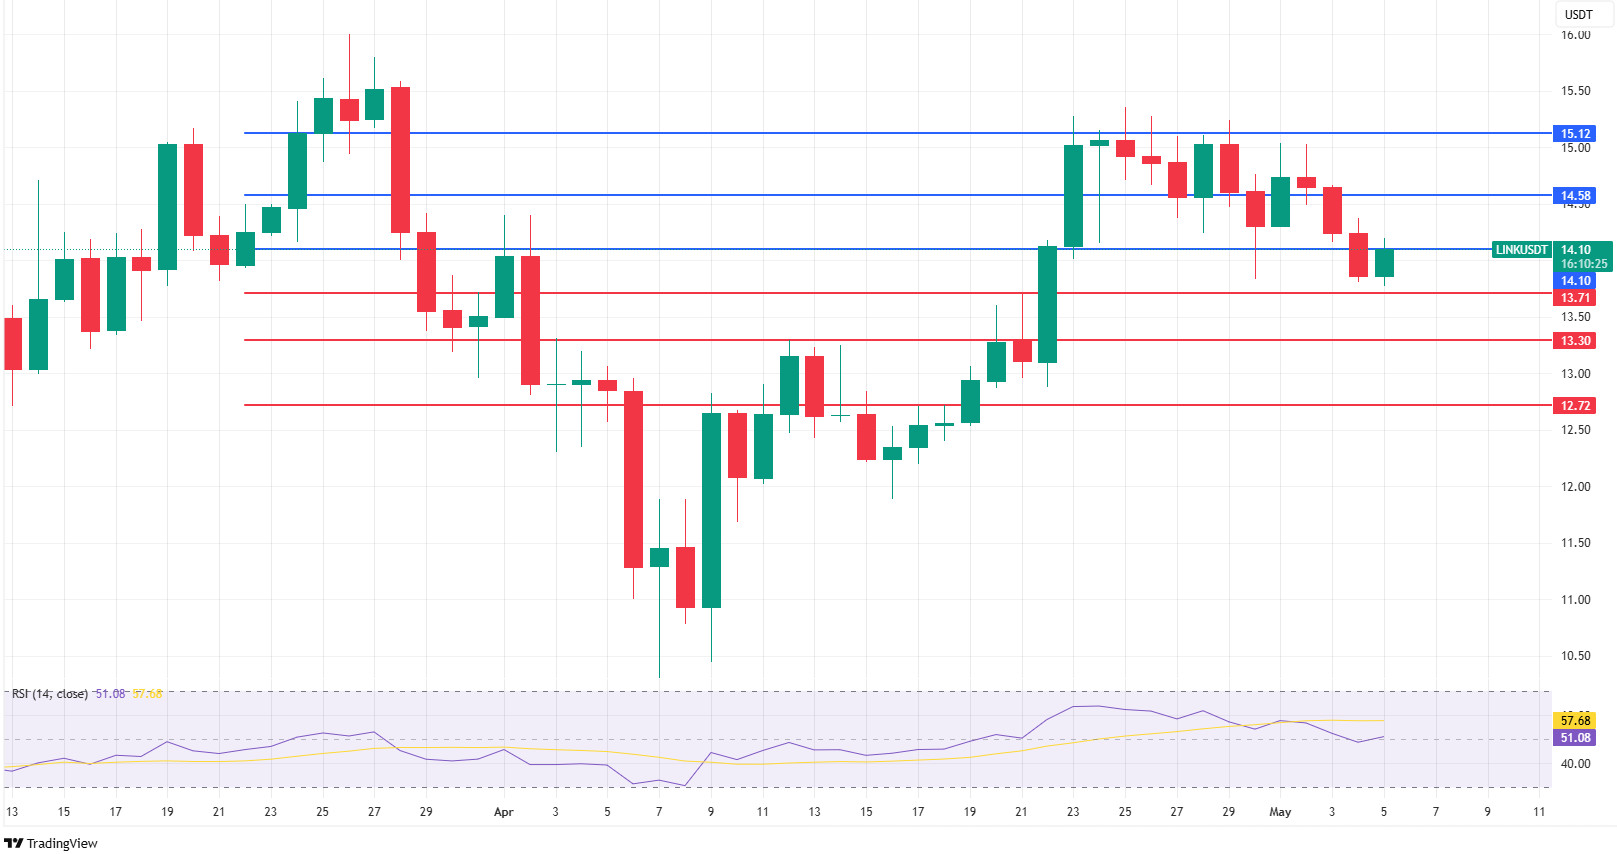
LINK has recently tested the $15.12 level, reaching an important resistance zone in the short-term uptrend. With sales from this level, the price is stuck between the $14.10 and $14.58 levels. In particular, the $ 14.10 level is a critical threshold for maintaining the current structure. Daily closes below this level may weaken the short-term technical structure and support levels of $13.71, $13.30 and $ 12.72 may become targets, respectively. In the upside scenario, the price first needs to exceed the $14.58 resistance and then the $15.12 level. Crossing these two regions will pave the way for buyers to gain weight again in the short term.
Relative Strength Index (RSI) is at 51.08, hovering in neutral-positive territory. This outlook suggests that the price has not yet generated a strong directional signal, but has not lost momentum. In case the RSI dips below the 50 level, selling pressure may increase and the price may test the support levels. The technical outlook suggests that as long as the price stays above $14.10, the recovery potential is preserved, while we can expect a new bullish momentum in the upside movements if $15.12 is exceeded.
Supports 13.71 – 13.30 – 12.72
Resistances 14.10 – 14.58 – 15.12
BNB/USDT
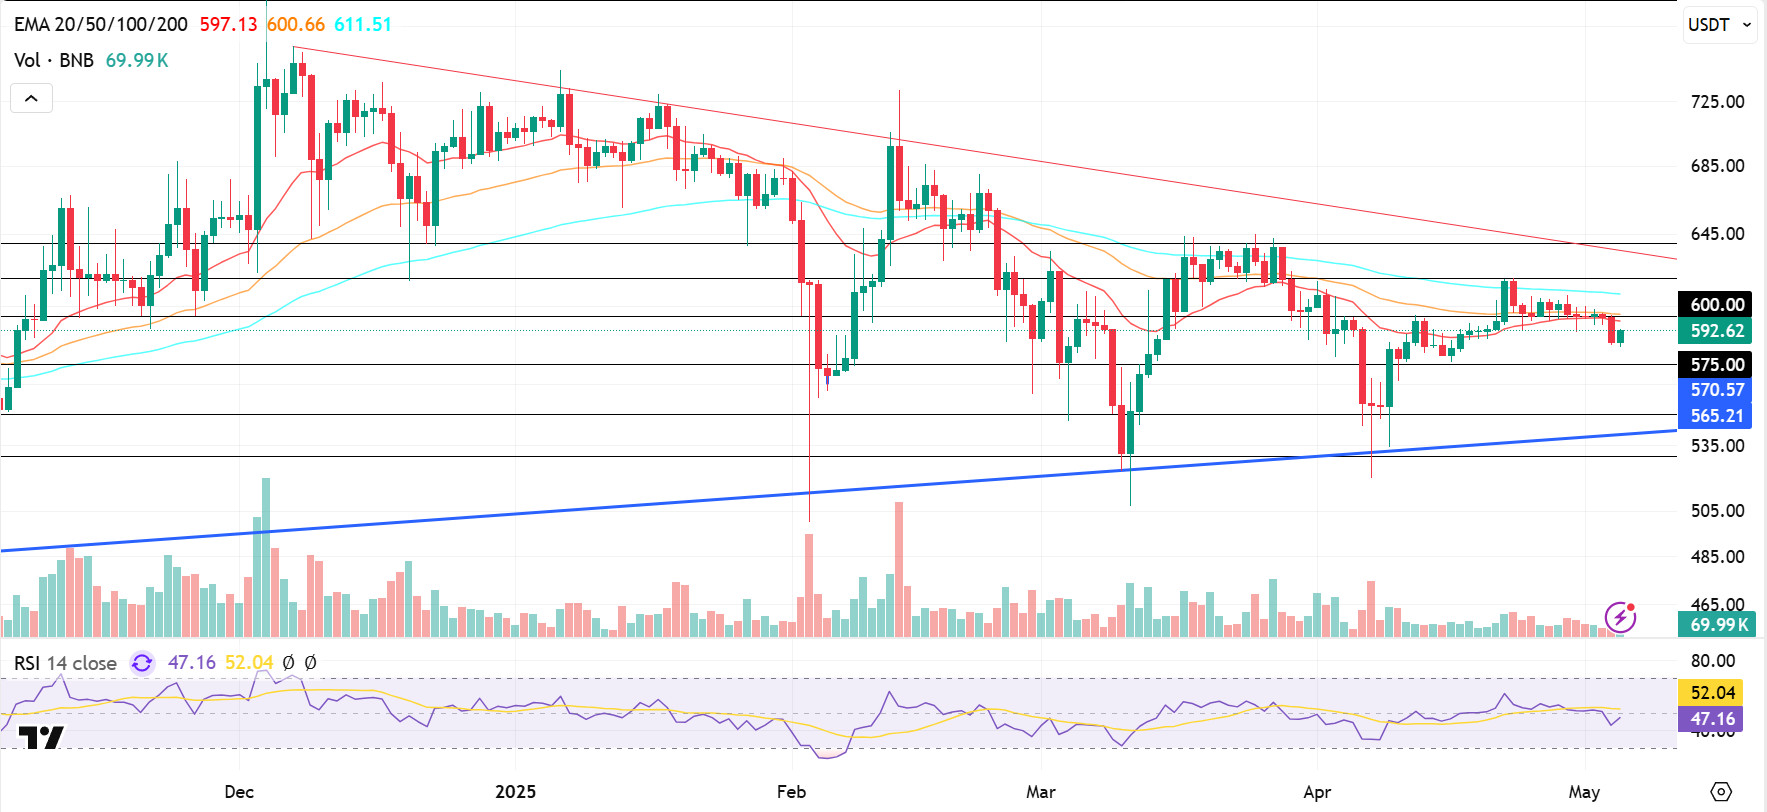
From a technical perspective, BNB/USDT, which gained positive momentum at the beginning of last week (Monday, April 28) with the support from the EMA 20 (red line), continued to see resistance below the EMA 100 (blue line). With this resistance, the asset entered a new period of suppression and retreated below the EMA 20, EMA 50, EMA 100 and $600 levels. At the beginning of the new week, BNB/USDT, which rallied with the general positive trend observed in the markets, is priced in the positive zone in the daily period.
BNB/USDT, which is currently trading in the $575-600 band, exhibits a generally negative and weak outlook in the last week, especially on the volume side, when analyzed in terms of technical indicators. This indicates that there is some willingness to sell on the asset. On the other hand, the RSI indicator has also moved below the 50 level and the average. The course of the RSI in this region indicates that the downward negative momentum may continue.
Within the framework of the current technical outlook, if the positive trend continues, the price is expected to rise to $ 600 in the first place. If this level is broken upwards, the $620 and $640 levels stand out as the next resistance zones, respectively. On the other hand, if the $600 level is not exceeded and selling pressure occurs, it is possible that the price may retreat to the $575 level. If the $575 support breaks down, the $550 and $530 levels should be monitored as support zones.
Supports 575 – 550 – 530
Resistances 600 – 620 – 640
ADA/USDT
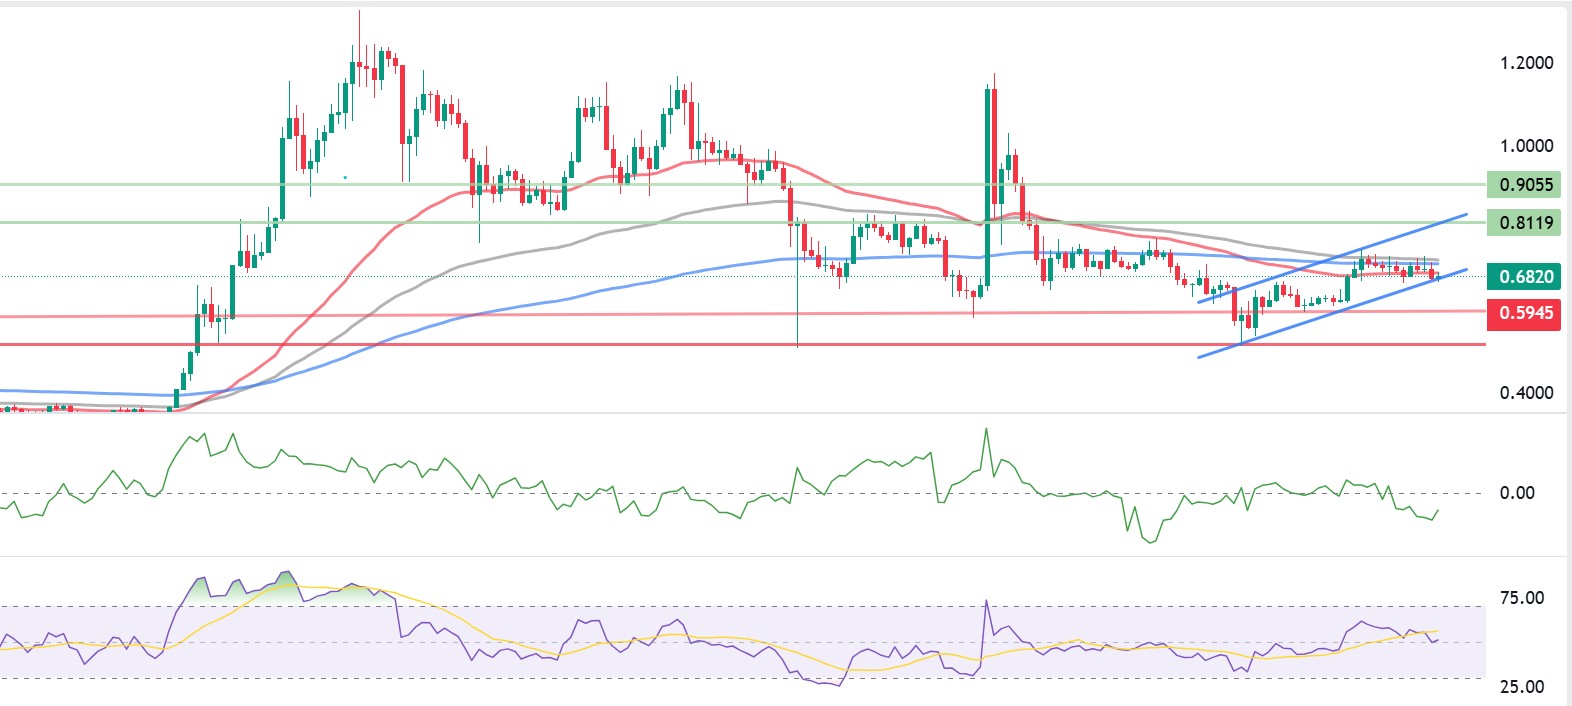
Cardano has fallen 5% since the beginning of the week to 0.6849. ADA reported that it will share its 2025 budget distribution vote. Cardano founder Hoskinson stated that Cardano will populate its new testnet with thousands of AI agents to trade between each other. The Cardano CEO said that Cardano DApps will be given the opportunity to benefit from high-speed trading with artificial intelligence, asking any Cardano DApp that might want to sign up for the new protocol to be positioned on the Face Melting Net (FMN). By introducing AI brokers, Cardano could usher in a new frontier and boost its existing positive outlook within the crypto community following the positive market sentiment.
Looking at the technical chart, ADA started sideways movements as of April 27 and momentum remained low. During the week, the price approached the 50-period (50 EMA – Red Line) average, which is the level of the 200-period Exponential Moving Average (200 EMA – Blue Line) on the daily chart, pointing to the intersection of the 100-period (EMA 100 – Black Line) average. After this intersection, it may reverse its movements from the rising channel band. The Relative Strength Index (RSI)14 indicator fell, approaching the critical level of 51, indicating that it may herald a correction. Chaikin Money Flow (CMF) is moving around the bearish zone of -0.08. This signals that the inflow of money into the Cardano network has started to decline and that the downward movement may continue with the pricing of macro data. As long as the price is within the bullish channel formed on the chart, the possibility of momentum continuing upwards can be supported by the rise to the 0.7439 level. If the rise continues, 0.8069 and 0.8432 levels can be tested as resistance levels. This week, the FED interest rate decision will be announced and Powell will make statements. In the light of these macro data , if the uncertainty increases with the fluctuations in the market, 0.5910 and 0.5125 levels can be followed as support levels. If these support levels are broken, the decline may deepen.
Supports 0.4917 – 0.5125 – 0.5910
Resistances 0.7439 – 0.8069 – 0.8432
Legal Notice
The investment information, comments and recommendations contained in this document do not constitute investment advisory services. Investment advisory services are provided by authorized institutions on a personal basis, taking into account the risk and return preferences of individuals. The comments and recommendations contained in this document are of a general type. These recommendations may not be suitable for your financial situation and risk and return preferences. Therefore, making an investment decision based solely on the information contained in this document may not result in results that are in line with your expectations.
