MARKET SUMMARY
Latest Situation in Crypto Assets
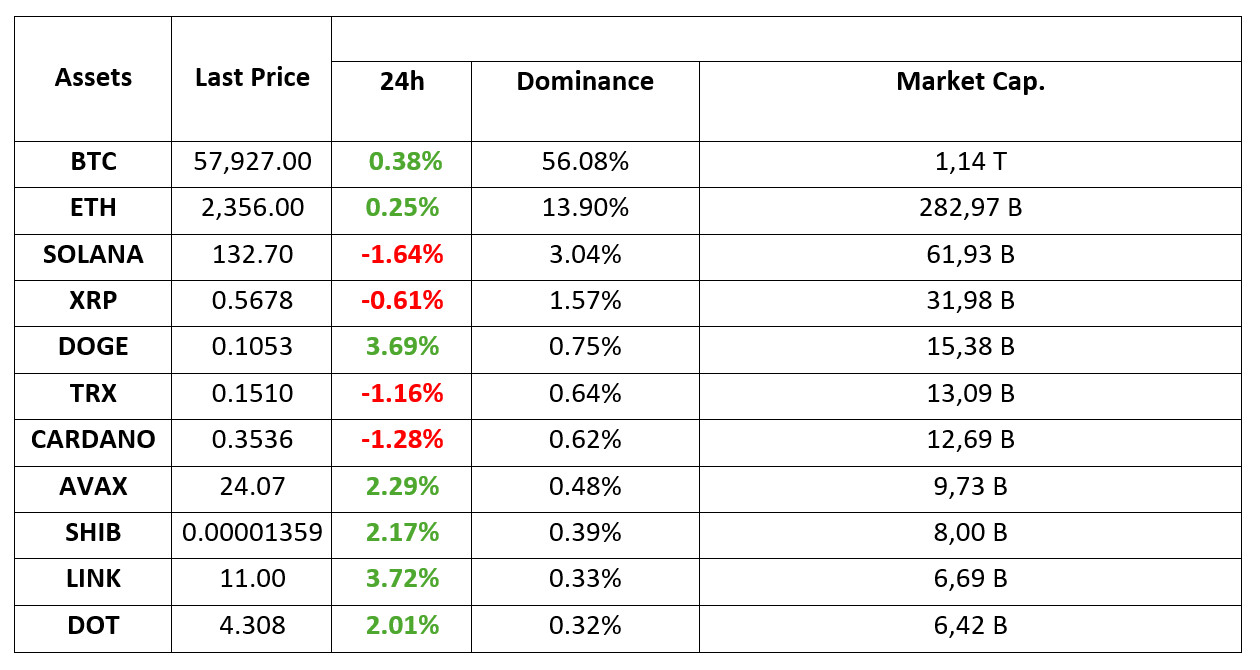
*Table prepared on 13.09.2024 at 14:00 (UTC)
WHAT’S LEFT BEHIND
Surprise FED Statement from the IMF!
International Monetary Fund (IMF) spokesperson Julie Kozack said that they think it is appropriate for the Fed to start cutting interest rates next week.
MicroStrategy Acquires Another 18,300 Bitcoins
MicroStrategy bought 18,300 Bitcoins for $1.11 billion, bringing its total reserves to 152,800. CEO Michael Saylor explained that he sees this investment as a long-term strategy. The purchase made at a time when Bitcoin is showing signs of recovery is interpreted as an indicator of confidence in the markets.
Spot Bitcoin ETFs
Bitcoin ETFs saw $39.02 million invested yesterday. The biggest contributors were ARK, Fidelity and Grayscale BTC. On the other hand, Grayscale’s GBTC saw outflows of $6.51 million.
After BlackRock and Fidelity, the firm managing $300 billion starts tokenization
Janus Henderson, which has $300 billion in assets under management, is also stepping into the world of tokenization. The company will manage an $11 million fund called “Anemoy Liquid Treasury Fund” that tokenizes short-term US Treasury bonds.
Kamala Harris leads Trump by 5 percent: Reuters poll
In the US election process, which is closely watched by the cryptocurrency world, Kamala Harris is ahead of Trump by 5 percent according to the latest poll. According to the latest Reuters poll, participants also think that Harris emerged victorious from this week’s debate program.
HIGHLIGHTS OF THE DAY
Important Economic Calendar Data

INFORMATION:
*The calendar is based on UTC (Coordinated Universal Time) time zone. The economic calendar content on the relevant page is obtained from reliable news and data providers. The news in the economic calendar content, the date and time of the announcement of the news, possible changes in the previous, expectations and announced figures are made by the data provider institutions. Darkex cannot be held responsible for possible changes that may arise from similar situations.
MARKET COMPASS
Global markets focused on the US Federal Reserve’s interest rate decision to be announced on September 18. Although the inflation data released this week did not support a “Jumbo” rate cut by the FED in September, recent statements and pricing in the bond market indicate that this issue is still on the table.
While European stock markets remained on the positive side, US indices also started the day on a positive note, albeit with a slight tone. The dollar index continued to be influenced by former New York Fed president William Dudley’s comments that he sees room for a 50 basis point rate cut at next week’s Federal Open Market Committee (FOMC) meeting. According to CME FedWatch, there is a 49% chance that the Fed will announce a 50 basis point rate cut on September 18.
Although we can say that risk appetite has been supported by recent statements and pricing, markets remain on the cautious side ahead of critical developments. The potential optimism in risk sentiment is not reflected in equity markets and digital assets. The pressure on bitcoin from the September 4 peak may be due to the fact that the cash glut is taking place on the bond side. Major global investors seem to be preparing for the Fed’s interest rate decision. In this parallel, we can say that it is thought-provoking that the rise is not strong with the 50 basis point interest rate cut coming back to the fore (although a 25 basis point cut is still seen as a greater possibility). In addition, the decline in the dollar index did not have any reflection on crypto assets. Until the September 18 FOMC meeting, this situation, which leaves a gap in the equation, can be expected to bring a rise to crypto assets. However, it is necessary to question why this gap is not reflected in current prices and does not support the rise.
We have seen many times that markets prefer to remain cautious ahead of critical developments. Exactly how big the FED will start cutting interest rates remains uncertain. Therefore, as we mentioned in our morning analysis, we can say that it will not be very surprising to see horizontal price changes, occasional sharp and short-term rises and falls for no reason.
TECHNICAL ANALYSIS
BTC/USDT
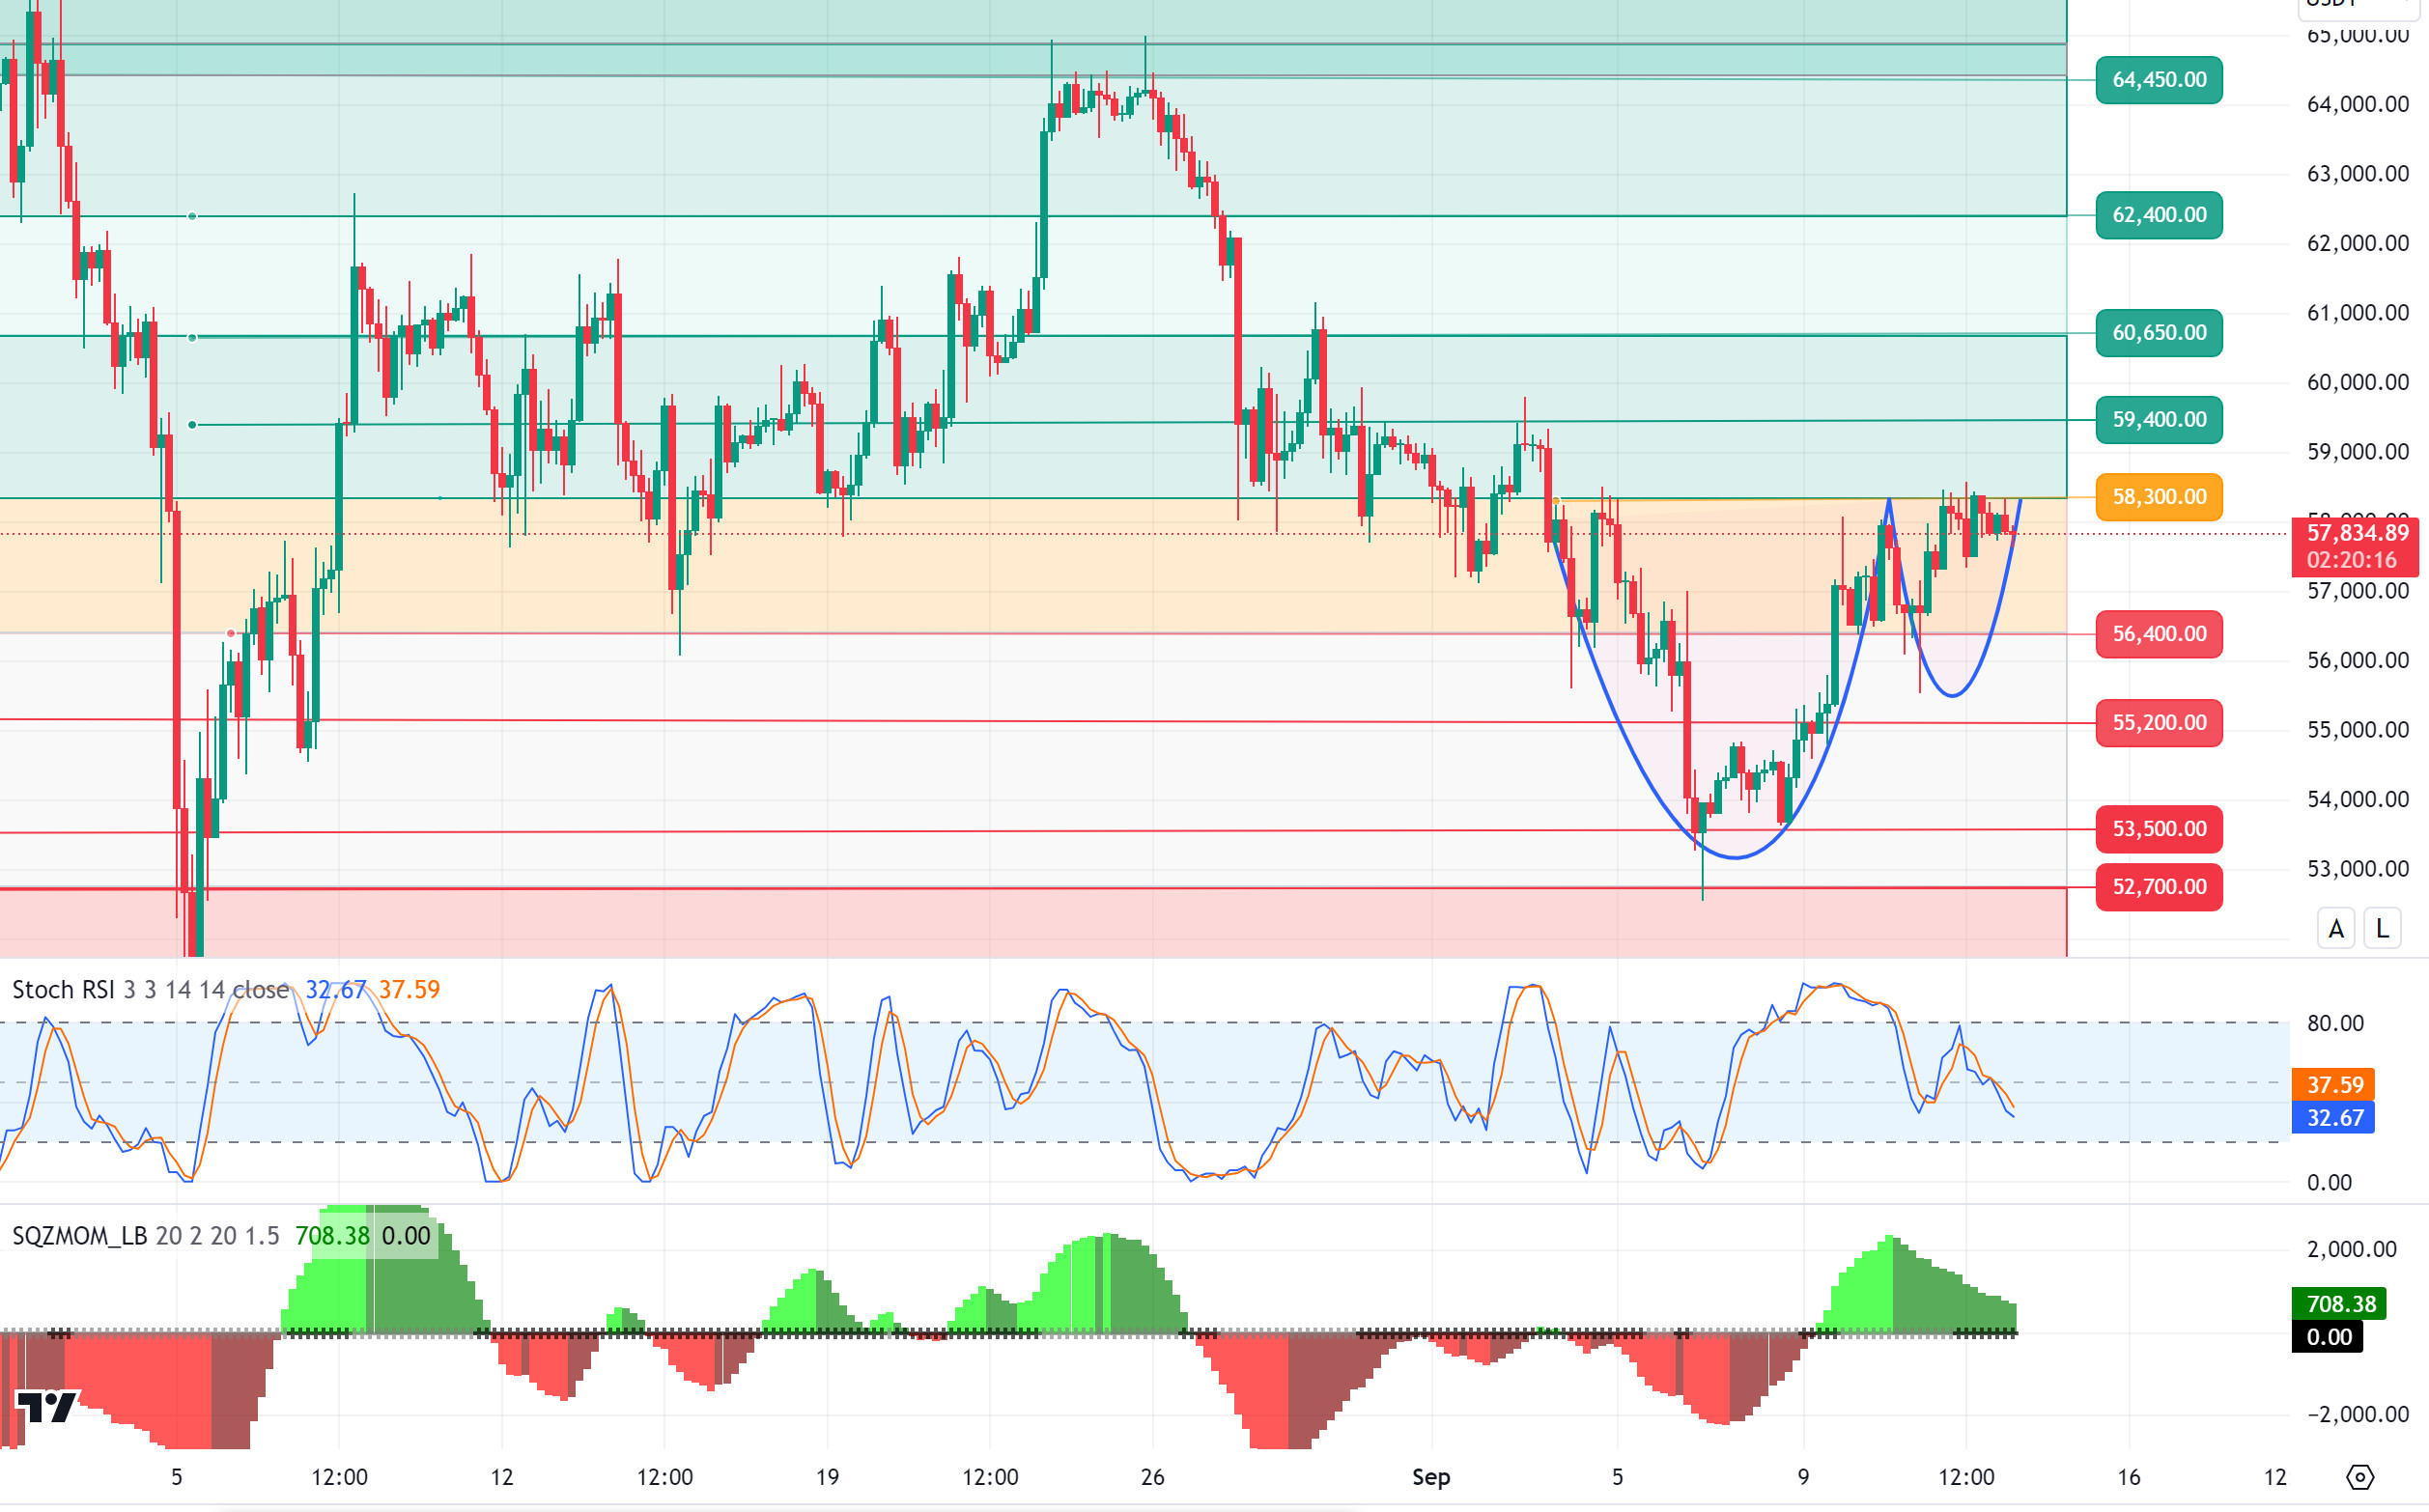
Searching for direction in Bitcoin! The $1.11 billion worth of Bitcoin purchases from MicroStrategy during the day shows that institutional investors are turning to Bitcoin again. In this direction, with the increased interest in Bitcoin spot ETFs, it caused us to see positive entries again. In addition, another important development of the day was the IMF’s call for an interest rate cut to the FED. In the coming days, eyes will turn to FED members and possible statements to be made before the interest rate meeting may be important. In the BTC 4-hour technical analysis, we see that the price is stuck in a narrow band range. BTC, which could not exceed the resistance level of 58,300, fell below the 58,000 level again. We see that the price, which is currently trading at 57,800, is in search of direction. BTC, which has been moving in a correlated manner with the US stock markets for a long time, may turn its direction up again with the positive stock market opening indices. Otherwise, the fact that the RSI has not yet reached the oversold zone may create a new selling pressure and 56,400 levels may be tested.
Supports 57,200 – 55,200 – 56,400
Resistances 58,300 – 59,400 – 60,650
ETH/USDT
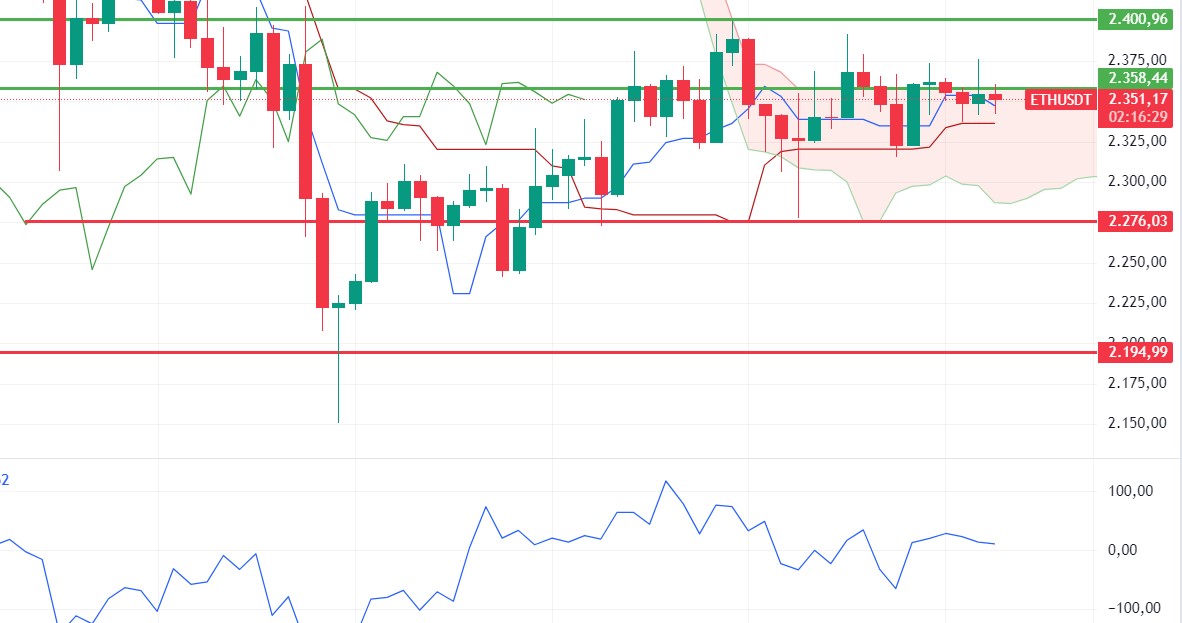
Ethereum, which continues to go back and forth in a narrow area, has fallen below the 2,358 kumo cloud level, rejecting the 2,375 level again. Considering that this decline came from the closing of long positions before the rise and especially from the spot side, some further retracement can be expected during the day. If this pullback comes below the 2,336 tenkan level, the decline may deepen. For a positive outlook, closes above 2,400 levels seem to be needed. A voluminous rise above 2,400 may allow us to see 2,560 levels again.
Supports 2,307 – 2,273 – 2,194
Resistances 2,358 – 2,400 – 2,451
LINK/USDT
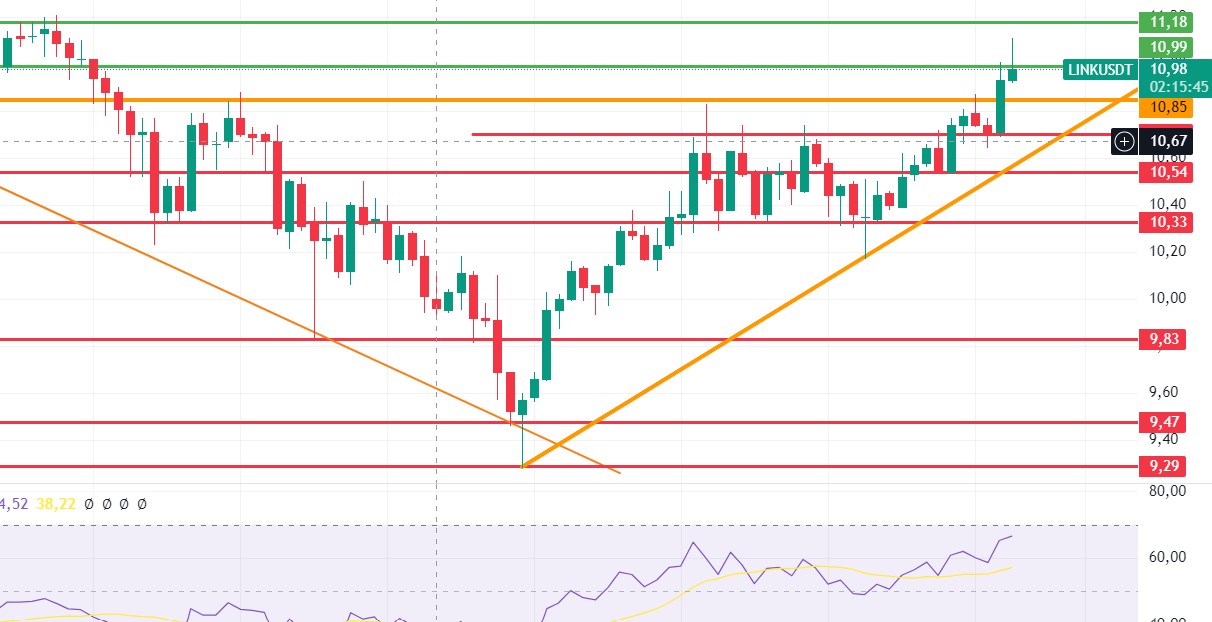
LINK, which broke the negative mismatch in the RSI and then rallied on volume, broke the 10.99 resistance and went up on volume, but retreated, affected by the market decline. Persistence above 10.99 could move the price to 11.18 and then 11.64 levels. However, the loss of the 10.85 level may bring a decline to 10.54 levels again.
Supports 10.85 – 10.70 – 10.54
Resistances 10.99 – 11.18 – 11.64
SOL/USDT
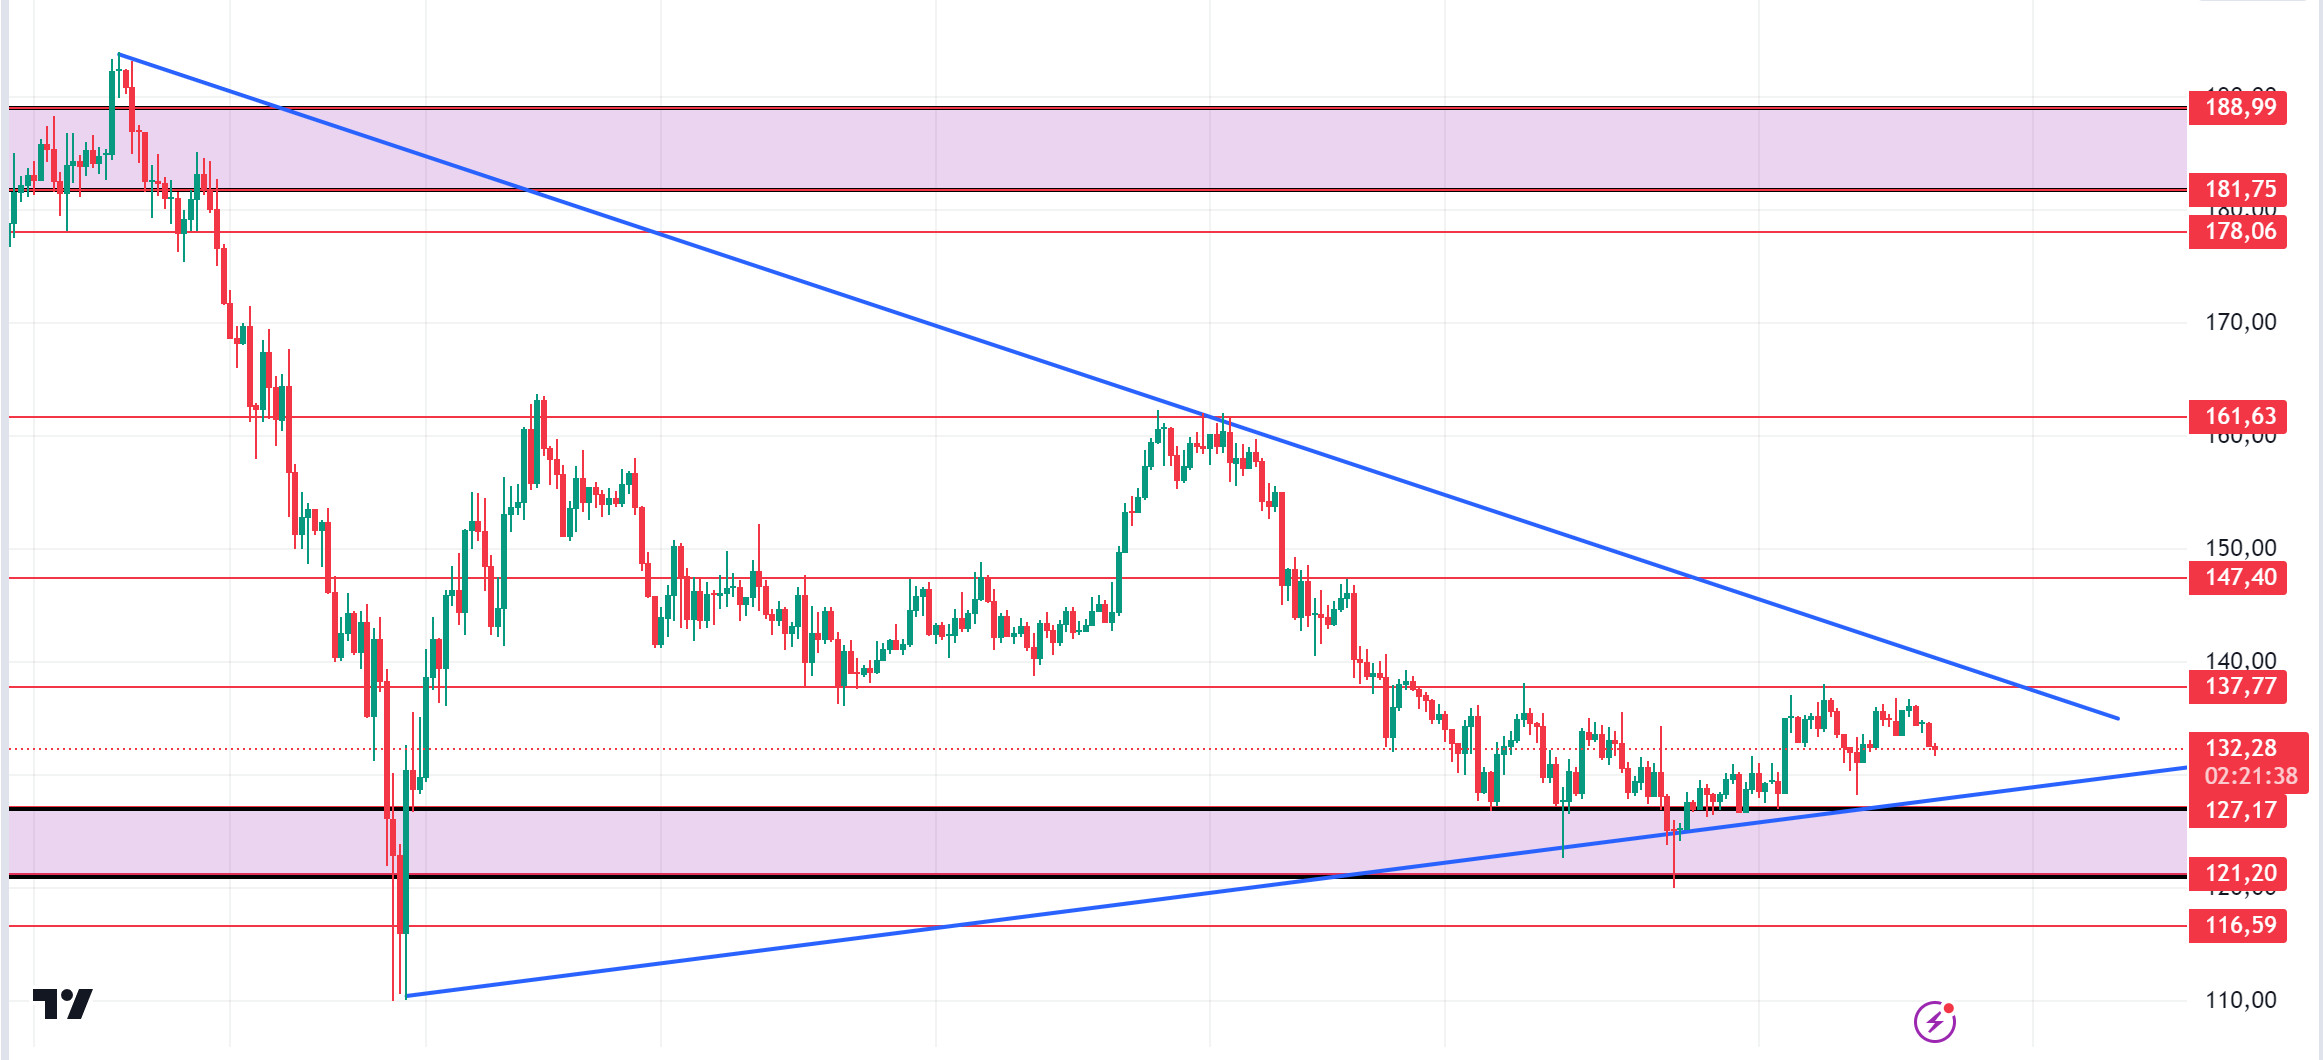
A wallet linked to FTX and Alameda Research is unstaking more than $1 billion worth of SOL coins, according to data reported by Lookonchain. The FTX and Alameda wallet still has 7.06 million units, or $945.7 million worth of SOL, used for staking purposes. This has slightly lowered the price, SOL is currently balancing in the 137.77 – 127.17 band, potentially setting the stage for a future recovery. When we examine it technically, we see the narrowing triangle formation. If the rises due to the increase in volumes continue, it may test the resistance levels 137.77 – 142.02. If it rises above this level, the rise may continue. If investors avoid selling pressure and sell, a potential rise should be followed if it comes to support levels of 127.17 – 121.20.
Supports 127.17 – 121.20 – 116.59
Resistances 137.77 – 147.40 – 161.63
ADA/USDT
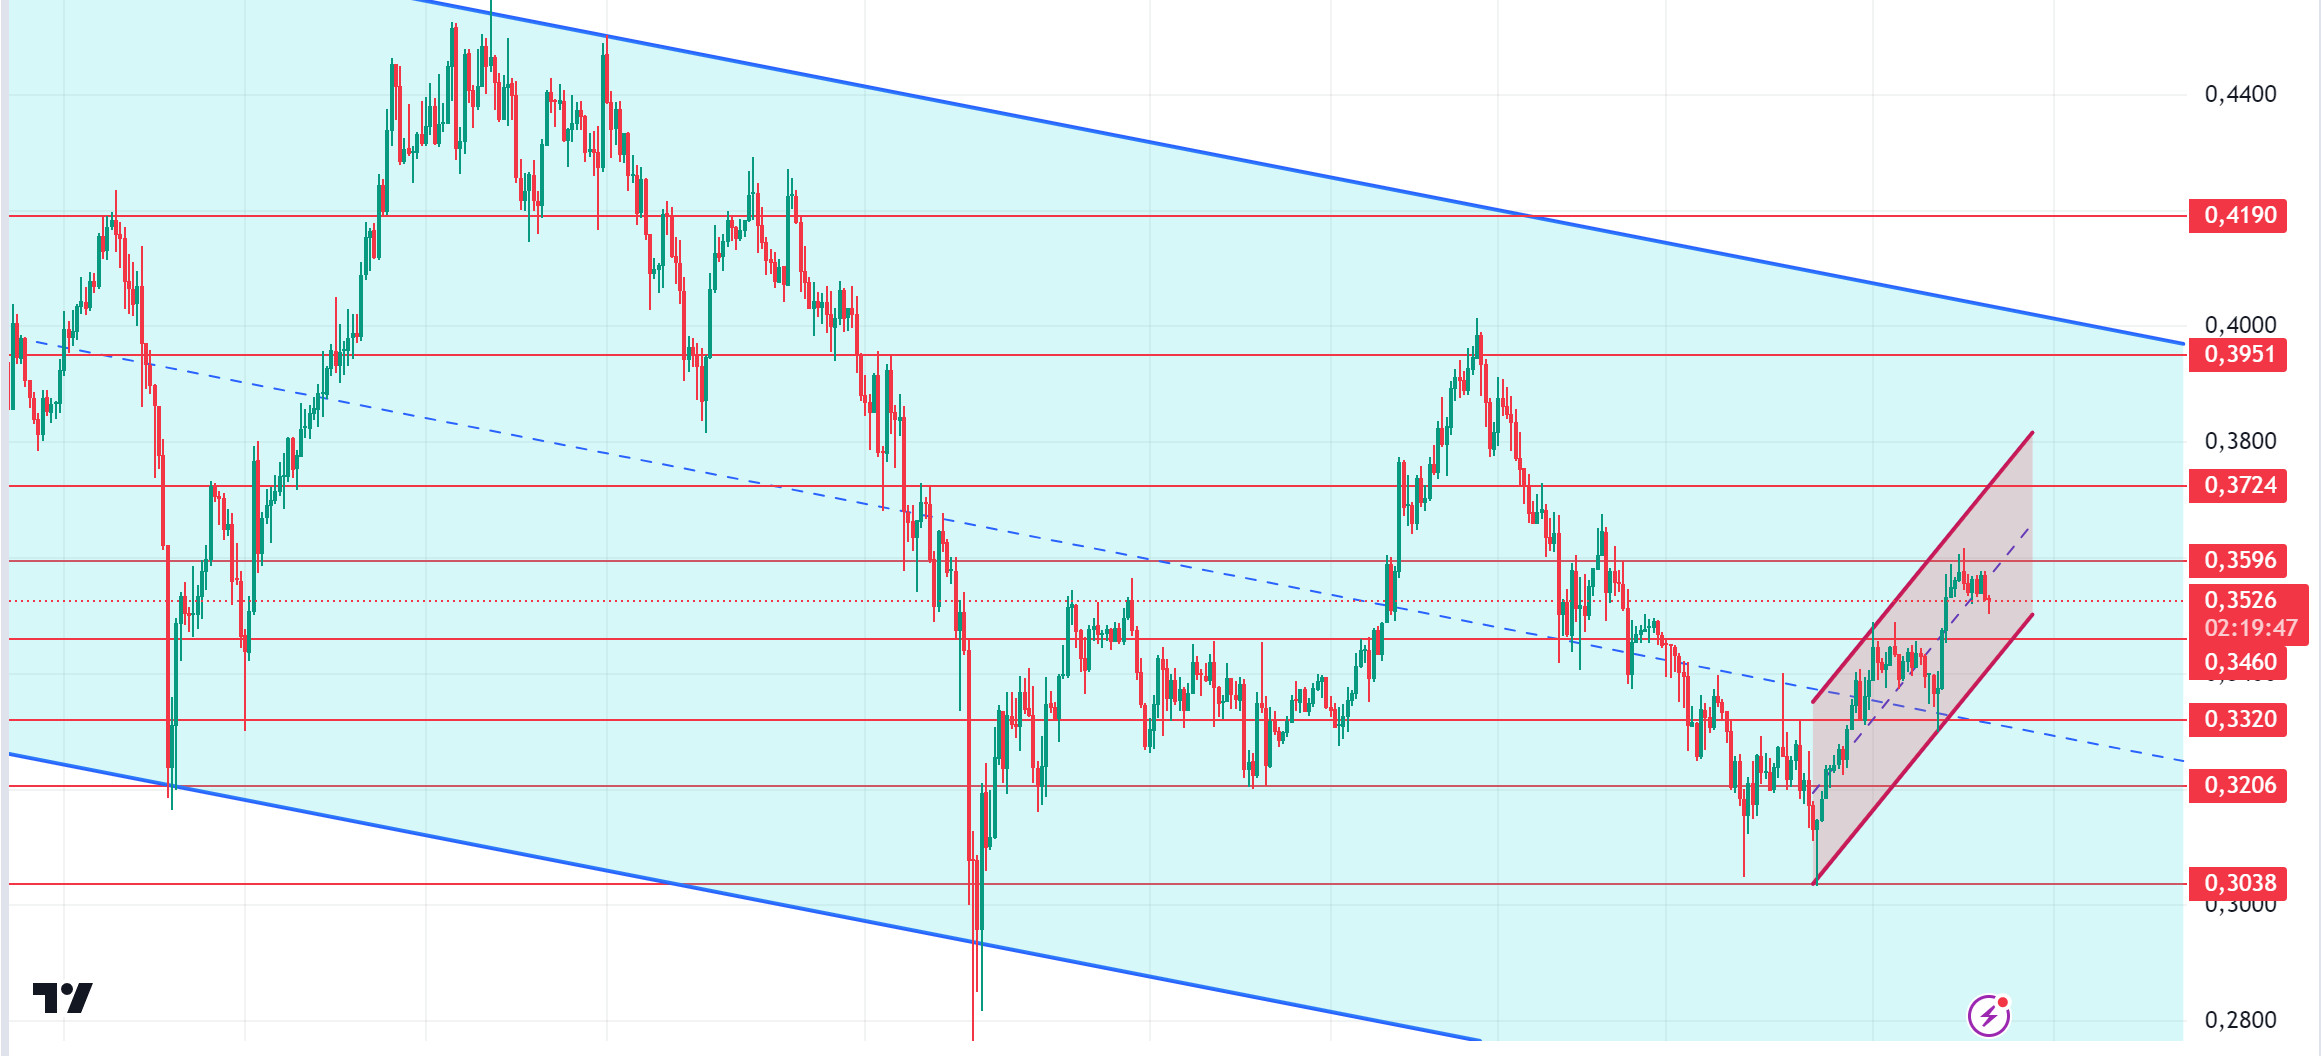
Since our analysis in the morning, the market has lost a little bit of value. When we look at the chart of ADA, it seems to have lost its strength although it has exceeded the middle level of the ascending channel. However, ADA failed to break 0.3596. Despite this, its price is hovering above a critical resistance. 0.3460 is a strong support for pullbacks due to general market movements and profit selling. In the event that macro-economic data raises BTC, the 0.3596 – 0.3724 levels can be followed as resistance levels in the scenario that ADA investors make purchases.
Supports 0.3460 – 0.3320 – 0.3206
Resistances 0.3596 – 0.3724 – 0.3912
AVAX/USDT
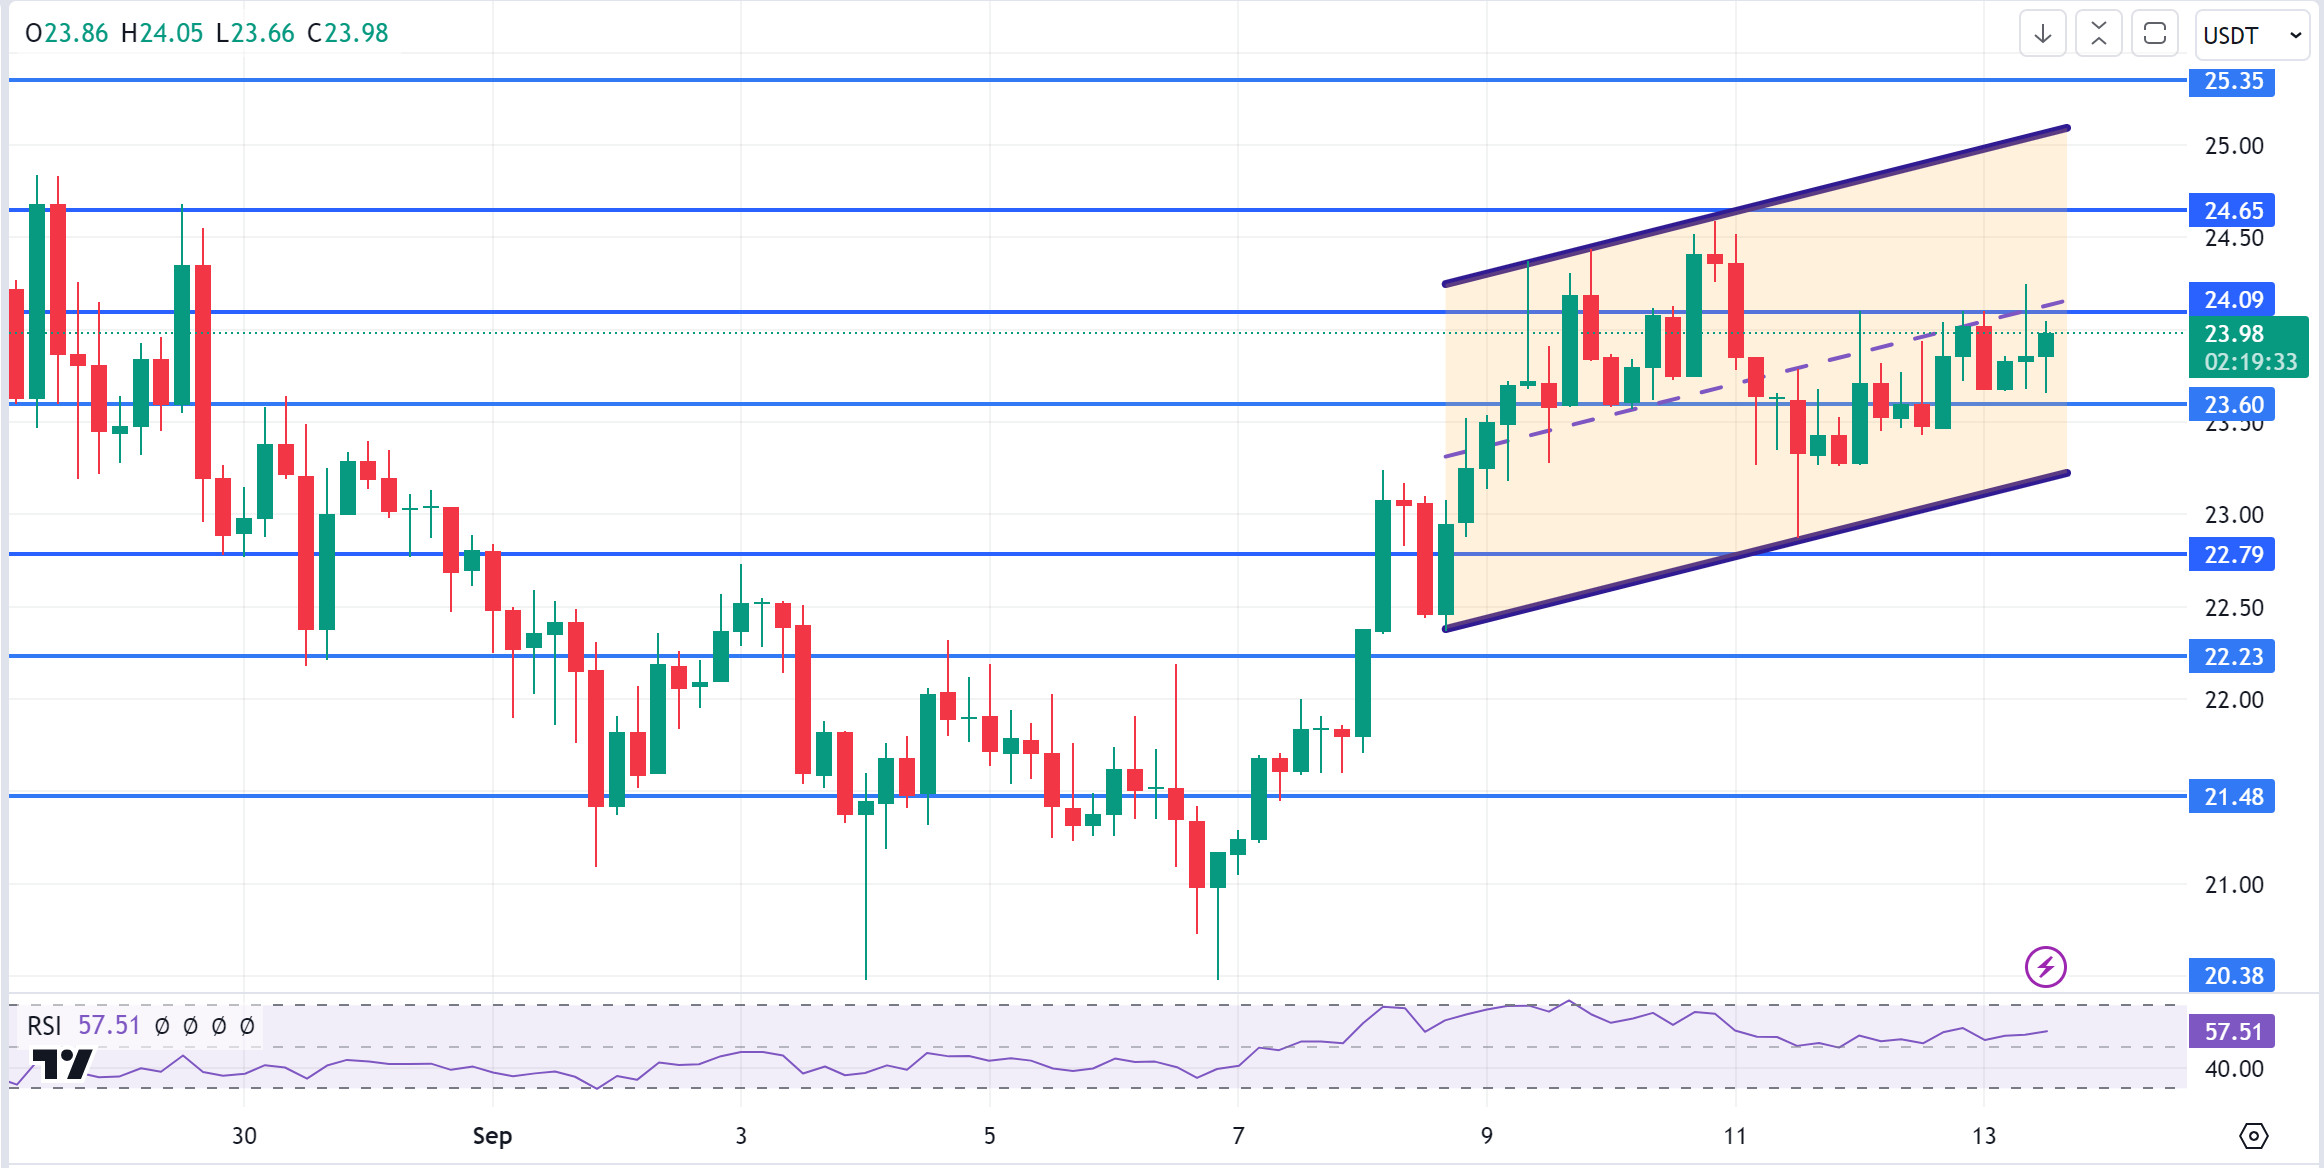
AVAX, which opened today at 24.02, is currently trading at 23.98. With the positive opening of the US markets, it continues its movement within the rising channel on the 4-hour chart. TRX, which is in the middle band of the channel, may want to test 22.79 and 22.23 supports if it breaks 23.60 support. If there is a buying reaction from 23.60 support, it may test 24.09 resistance. As long as it stays above 20.38 support during the day, the desire to rise may continue. With the break of 20.38 support, selling pressure may increase.
Supports 23.60 – 22.79 – 22.23
Resistances 24.09 – 24.65 – 25.35
TRX/USDT
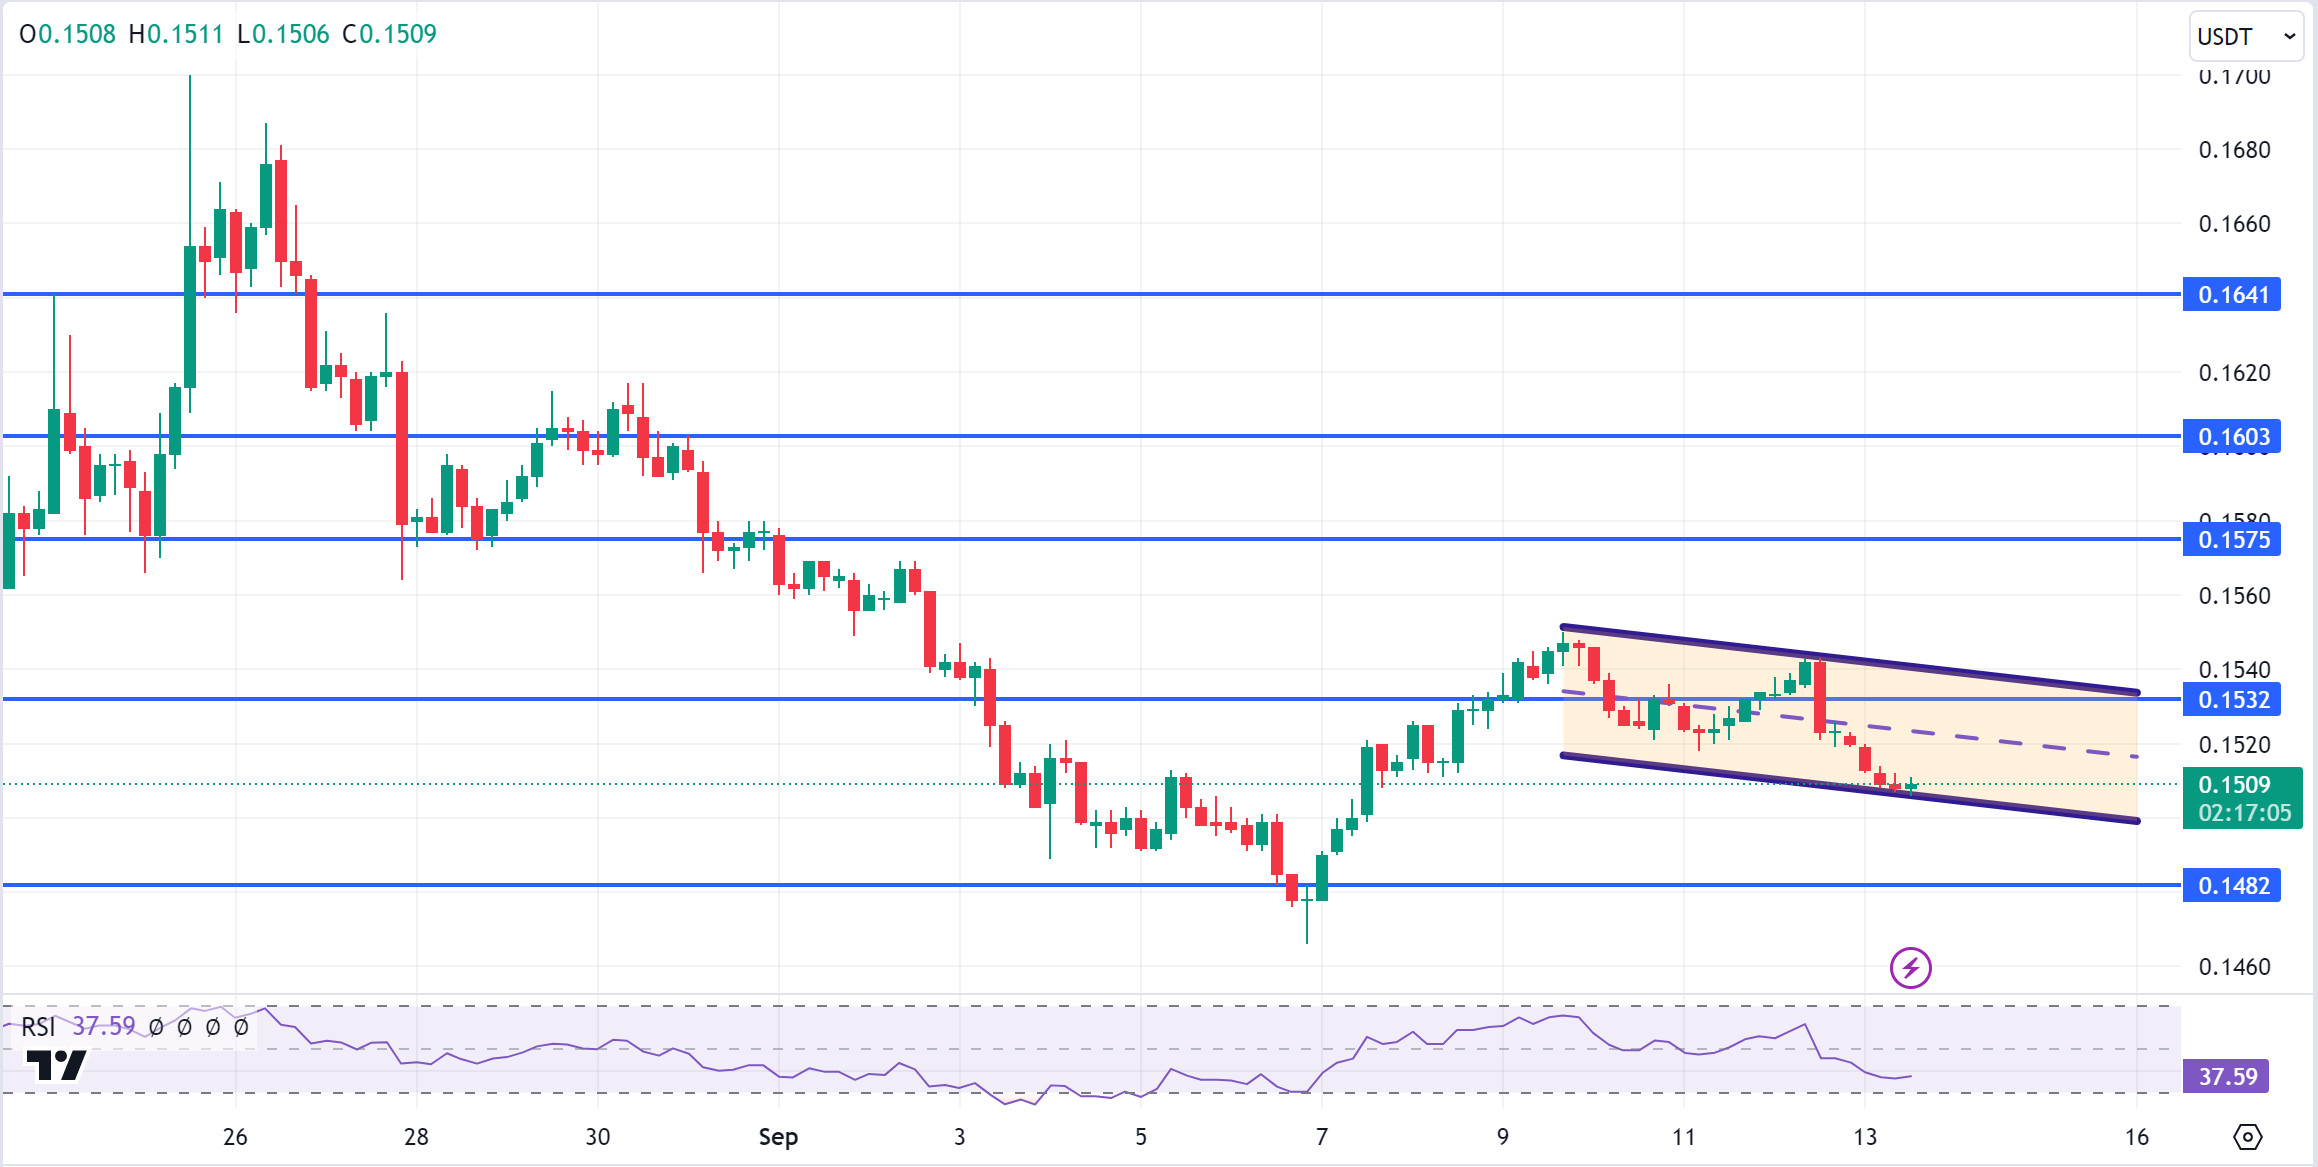
TRX, which started today at 0.1519, is trading at 0.1508 with some decline during the day. Since today is a quiet day in terms of data, we do not see high volume movements. TRX, which is currently in the lower band of the falling channel on the 4-hour chart, has approached the oversold zone with RSI 37. An upward reaction can be expected from here. In such a case, it may move to the middle and upper band of the channel and test the 0.1532 resistance. If there is no reaction from the lower band of the falling channel and the decline continues, it may want to test 0.1482 support. TRX may continue to be bullish as long as it stays above 0.1482 support. If this support is broken downwards, sales can be expected to increase.
Supports 0.1482 – 0.1429 – 0.1399
Resistances 0.1532 – 0.1575 – 0.1603
XRP/USDT
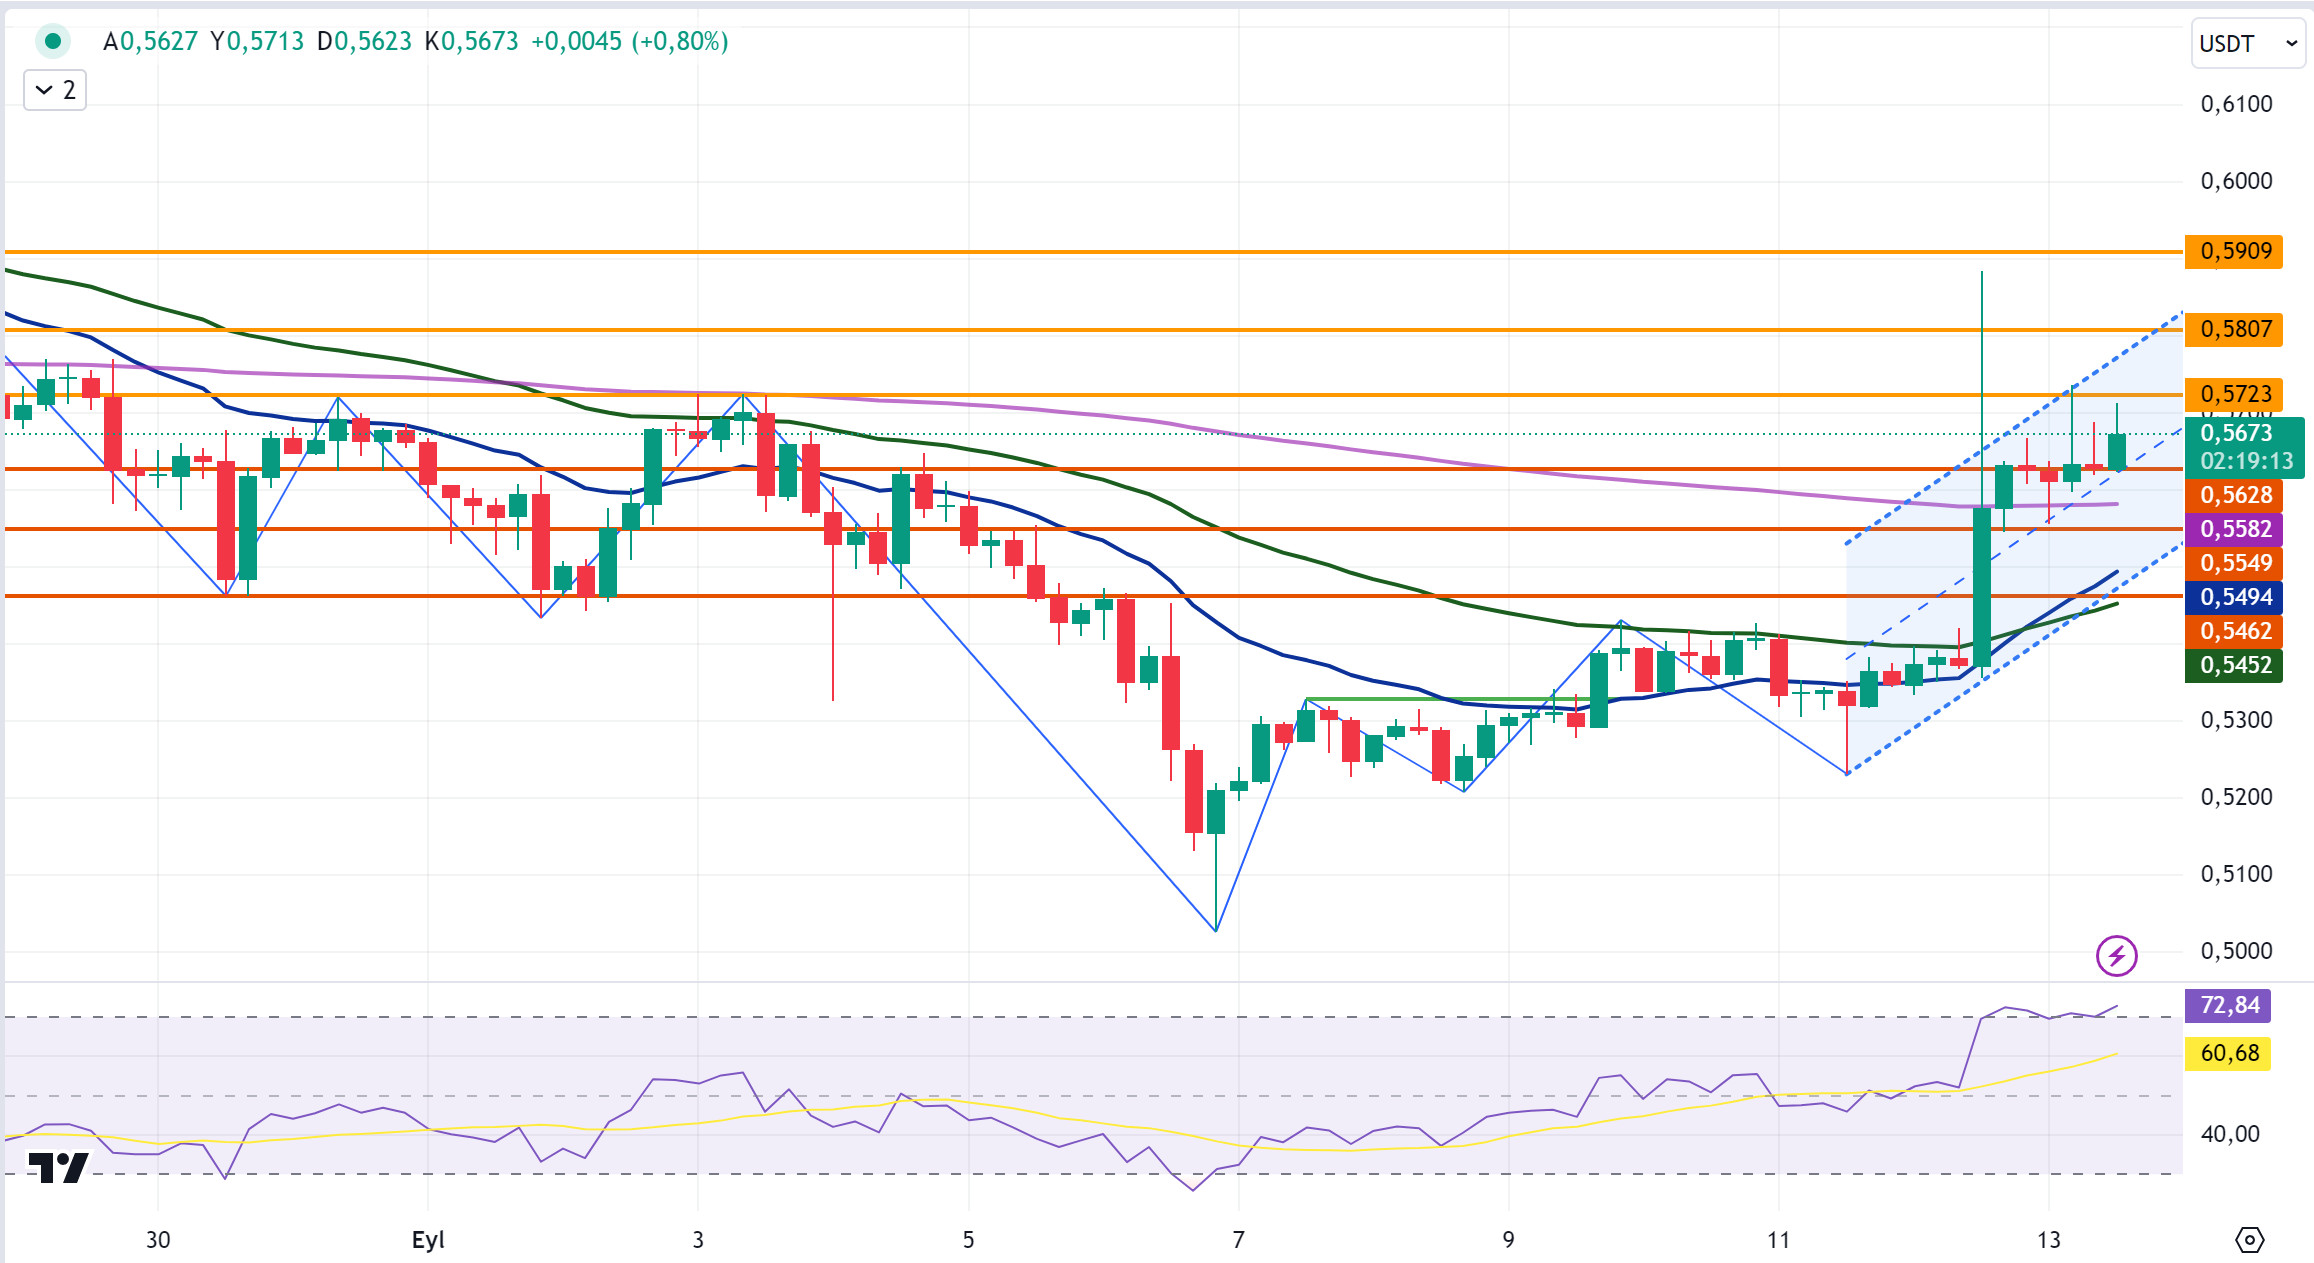
XRP continues to rise today. XRP, which started the day at 0.5624, is trading at 0.5673 with an increase of about 1%.
In the 4-hour analysis, it tested the 0.5628 support level with the decline in the last candle and failed to break it and started to rise. XRP, which tested the 0.5723 resistance level with its rise, fell with the reaction sales. It is currently trading between the 0.5628 support level and the 0.5723 resistance level. XRP, which is in the ascending channel, may test the 0.5807-0.5909 resistance levels when it continues to rise if it breaks the 0.5723 resistance level after retesting the 0.5723 resistance level with the rise. If the rise is replaced by a decline, it will retest the 0.5628 support level with a decline and if it breaks it, it may test the 0.5549-0.5462 support levels with the continuation of the decline.
In the 4-hour analysis, the 0.5628 support level is important in the last process. If XRP declines, it may rise with the reaction purchases that may come at the 0.5628 support level and may offer a long trading opportunity. If it tests and breaks the 0.5628 support level and the decline continues, it may offer a short trading opportunity.
Supports 0.5628 – 0.5549 – 0. 5 462
Resistances 0.5723 – 0.5807 – 0.5 909
DOGE/USDT
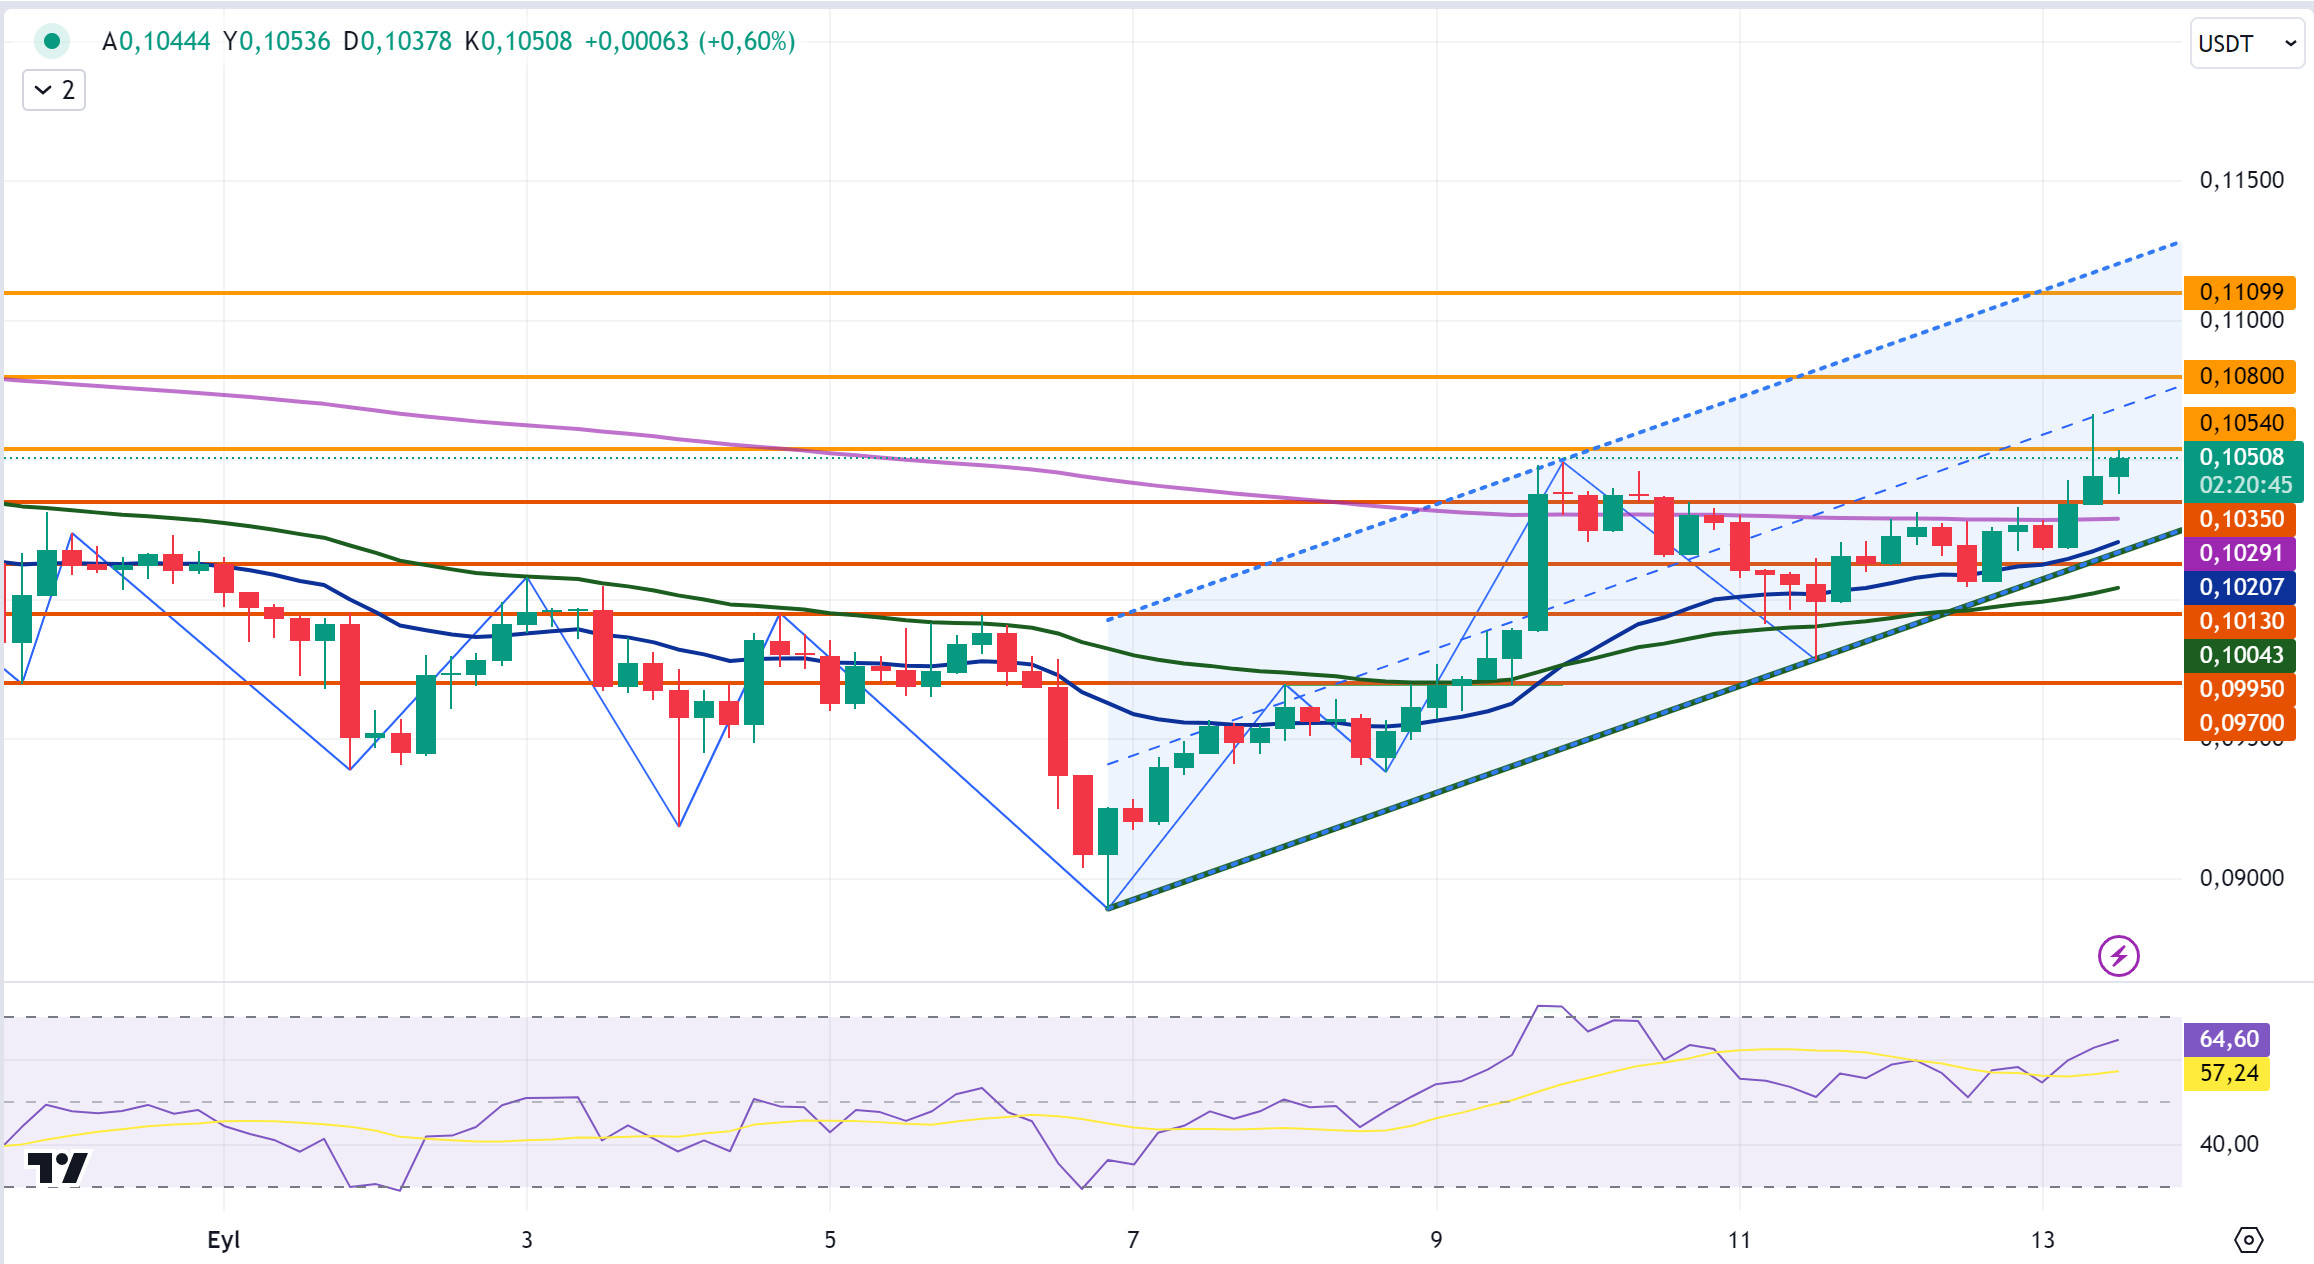
The rise in DOGE continues. After starting today at 0.1026, DOGE experienced a bullish 2.25% increase in value and is currently trading at 0.1050. Moving in an ascending channel, DOGE broke the 0.1035 resistance level in the 4-hour analysis today and is trading in the 0.1035-0.1054 band. If DOGE continues to rise, it will retest the 0.1054 resistance level and if it breaks it, it may test the 0.1080-0.1109 resistance levels with the rise. In case of a decline, it may test the support levels of 0.1035-0.1013-0.0995.
If DOGE declines, it may break the support level of 0.1035 and the decline may end and rise with the reaction purchases that may come at the EMA200 level in the continuation of the decline and may offer a long trading opportunity. In its rise, it may decline with reaction sales at the 0.1109 resistance level and may offer a short trading opportunity.
Supports 0.1035 – 0.1013 – 0.0995
Resistances 0.1 054 – 0.1080 – 0.1109
DOT/USDT
When we examine the Polkadot (DOT) chart, we see that the price failed to break the selling pressure at the 4,350 resistance levels. In the negative scenario, the price may retreat to the EMA50 levels with increasing selling pressure. If the price goes below the EMA50 and becomes persistent, the next reaction level could be the 4,210 support band. On the other hand, if the price can break the selling pressure at the 4,350 resistance level and provide persistence as the selling pressure decreases, we may see a rise towards the next resistance level of 4,454.
(Blue line: EMA50, Red line: EMA200)
Supports 4,210 – -4,133 – 4,072
Resistances 4.350 – 4.454 – 4.570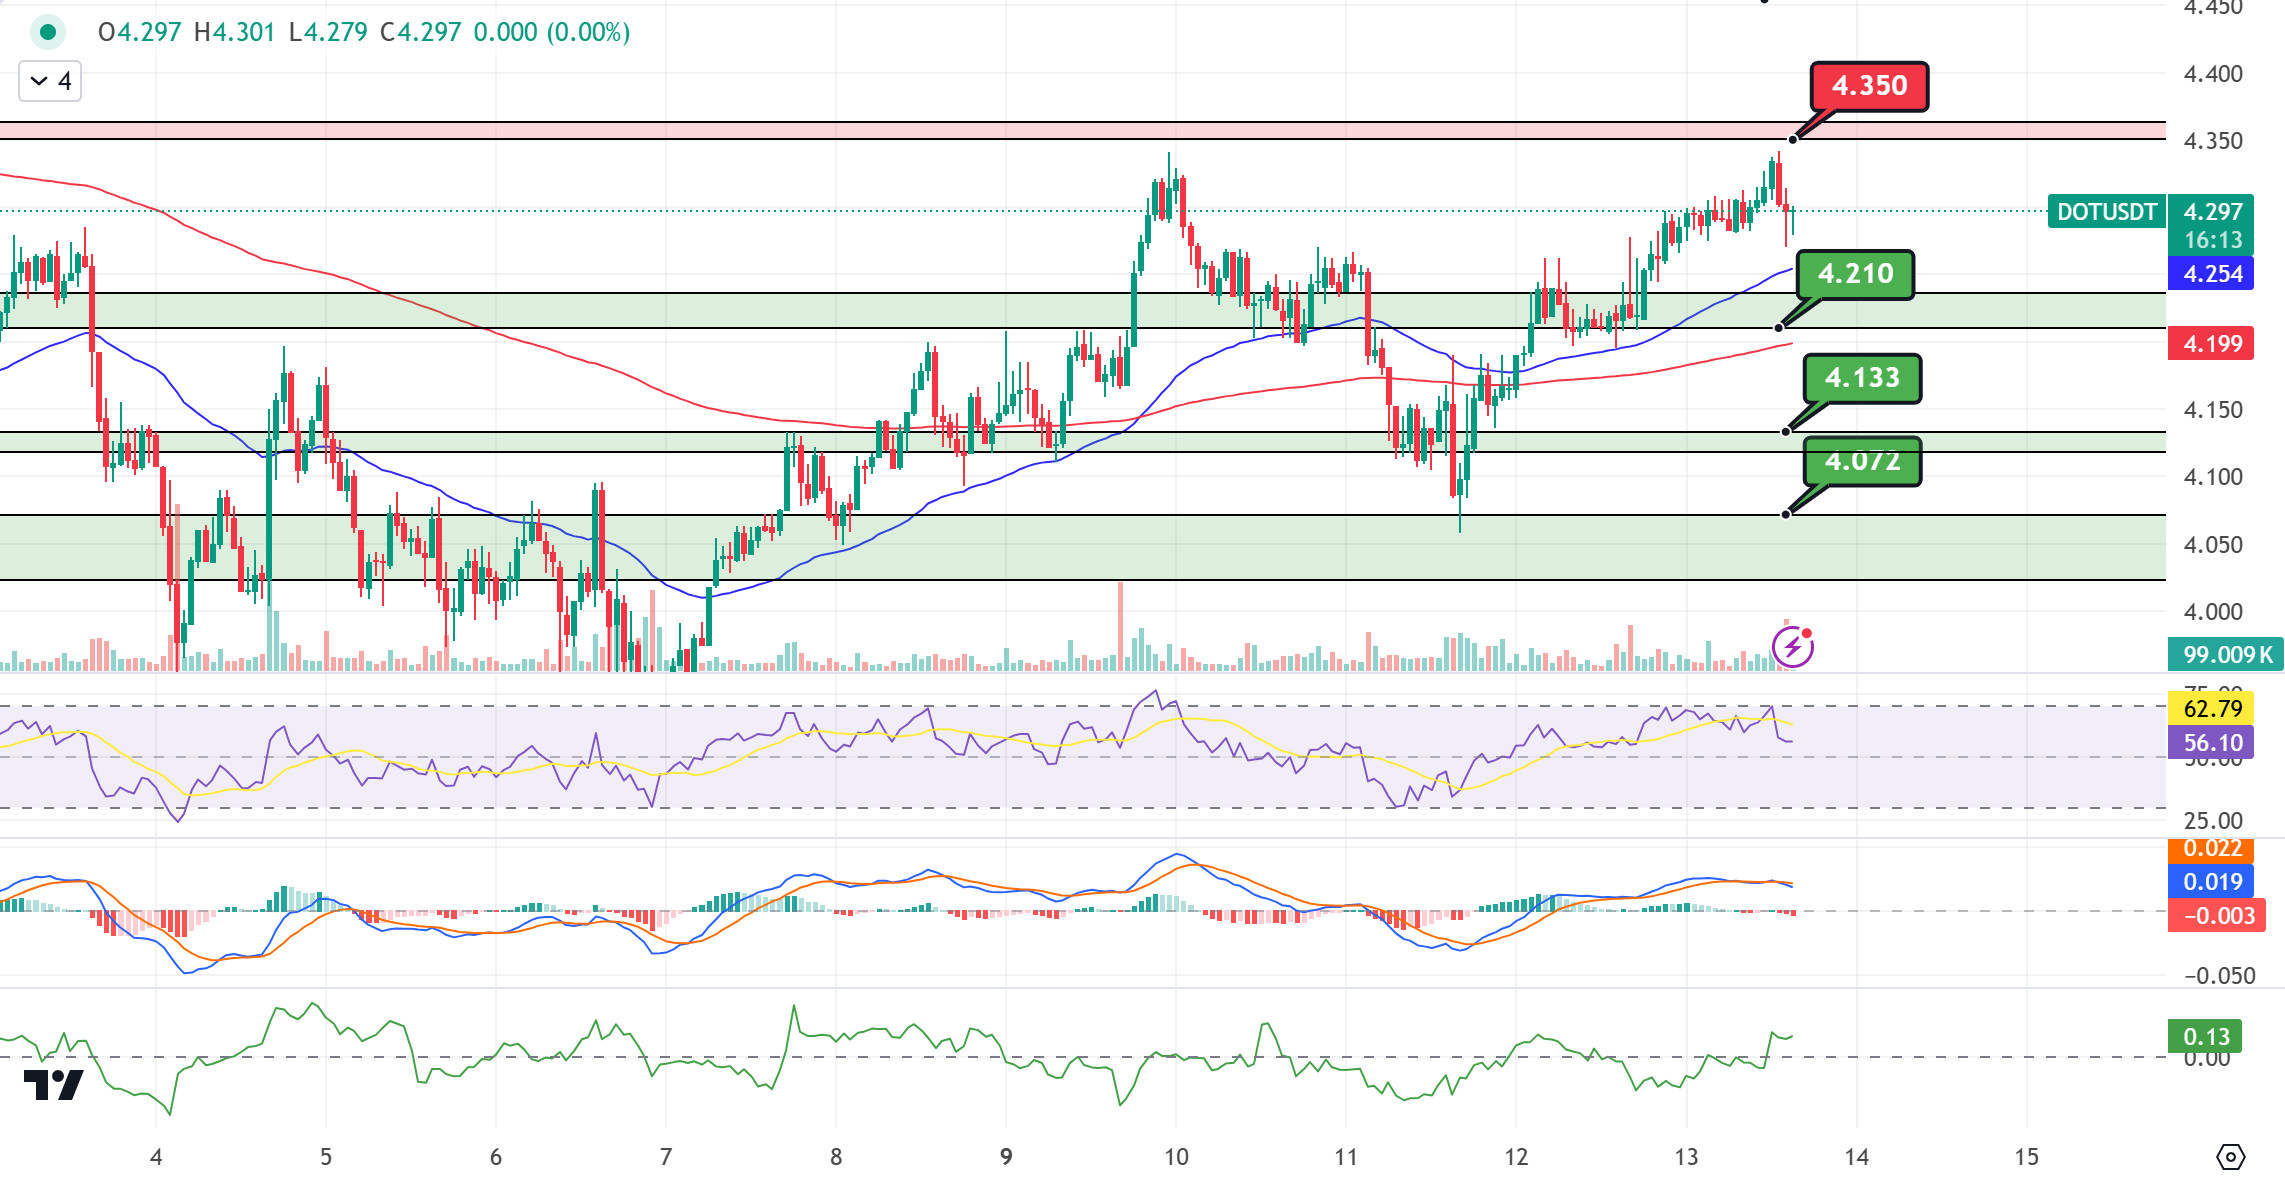
SHIB/USDT
In the last 24 hours, Shiba Inu’s burn rate has increased by 340%. According to the Shibburn wallet tracking service, 11,080,178 SHIBs were burned during this time. This huge increase was driven by the transfer of millions of SHIBs to burn wallets. On the other hand, the daily transaction volume on Shibarium remains low, which affects the rate of SHIB burning. Burning is currently being done automatically.
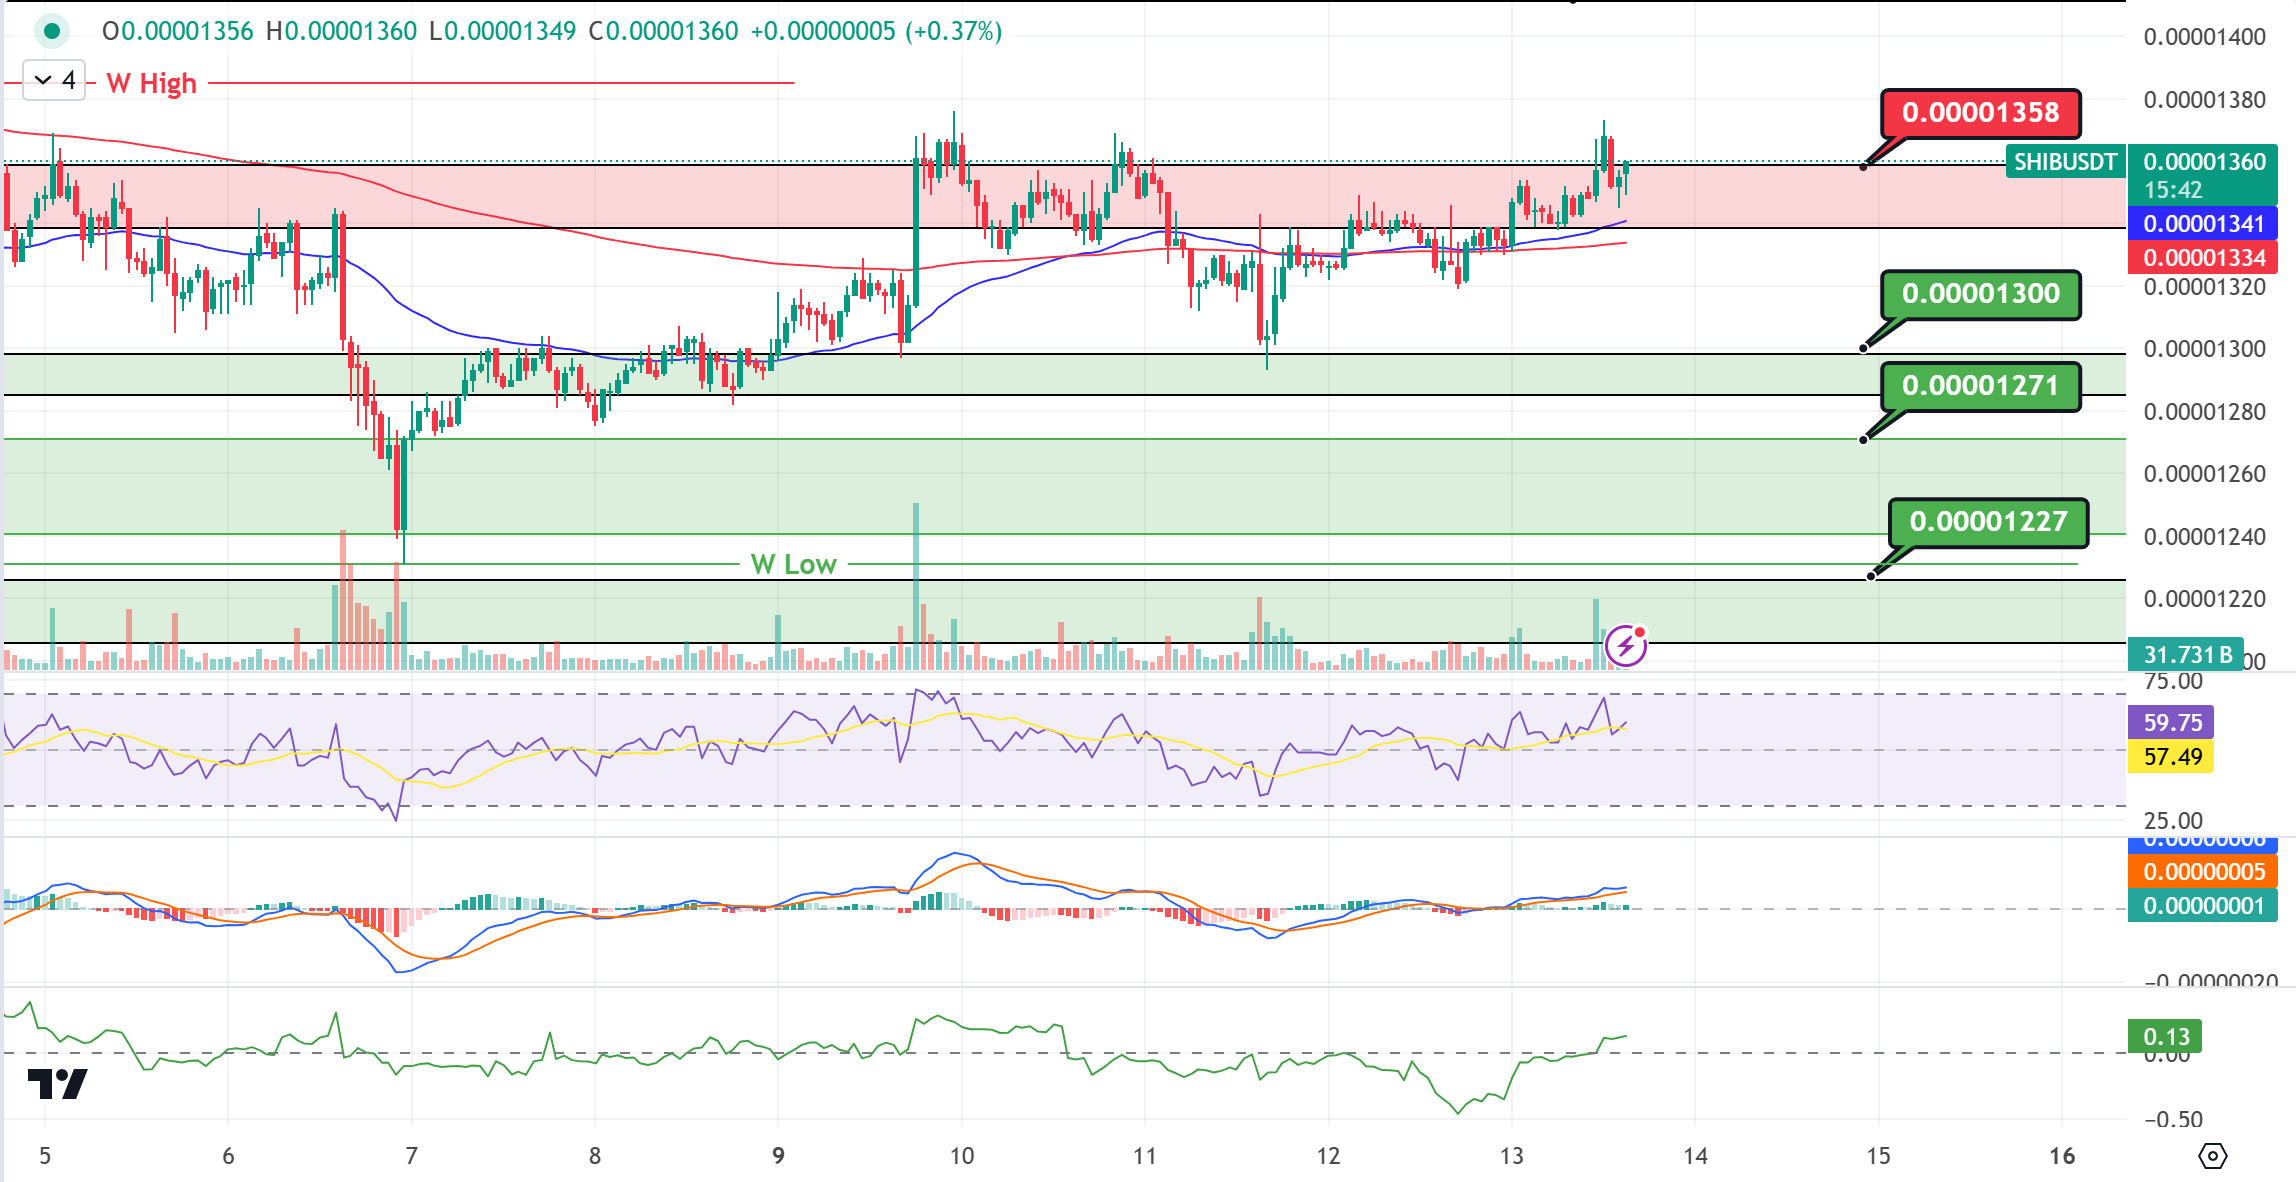
As for the SHIB chart, the price seems to be unable to break the selling pressure at 0.00001358. In case the price fails to break the selling pressure at 0.00001358, we can expect a pullback towards 0.00001300 support levels. In the positive scenario, if the price maintains above the 0.00001358 level, we may see a movement towards the EMA200 levels. If it is permanent above the EMA200, a rise towards the 0.00001412 level can be expected.
(Blue line: EMA50, Red line: EMA200)
Supports 0.00001300 – 0.00001271 – 0.00001227
Resistances 0.00001358 – 0.00001412 – 0.00001443
LEGAL NOTICE
The investment information, comments and recommendations contained herein do not constitute investment advice. Investment advisory services are provided individually by authorized institutions taking into account the risk and return preferences of individuals. The comments and recommendations contained herein are of a general nature. These recommendations may not be suitable for your financial situation and risk and return preferences. Therefore, making an investment decision based solely on the information contained herein may not produce results in line with your expectations.


