MARKET SUMMARY
Latest Situation in Crypto Assets
| Assets | Last Price | 24h Change | Dominance | Market Cap. |
|---|---|---|---|---|
| BTC | 98,113.08 | -3.77% | 53.96% | 1,94 T |
| ETH | 3,910.55 | 1.51% | 13.07% | 471,17 B |
| XRP | 2.352 | 1.58% | 3.73% | 134,35 B |
| SOLANA | 239.00 | 2.21% | 3.16% | 113,67 B |
| DOGE | 0.4377 | 0.45% | 1.79% | 64,39 B |
| CARDANO | 1.197 | 0.45% | 1.17% | 42,03 B |
| TRX | 0.3257 | -0.84% | 0.78% | 28,12 B |
| AVAX | 53.34 | 2.67% | 0.61% | 21,85 B |
| SHIB | 0.00003090 | -1.58% | 0.51% | 18,22 B |
| DOT | 10.62 | 1.37% | 0.45% | 16,22 B |
| LINK | 24.00 | 0.71% | 0.42% | 15,06 B |
*Prepared on 12.6.2024 at 07:00 (UTC)
WHAT’S LEFT BEHIND
Trump Nominates David O. Sacks as White House Director of Crypto and Artificial Intelligence
US President-elect Donald Trump announced the appointment of
David O. Sacks as “White House Director of Artificial Intelligence and Cryptocurrency”. Sacks will be responsible for the management of artificial intelligence and cryptocurrency policies and will aim to move the US to a leading position in these areas.
OpenAI CEO:
Sam Altman said at the New York Times DealBook Summit that he believes Elon Musk will not use his political influence to promote his artificial intelligence projects. “The use of political power to suppress competitors would contradict U.S. values,” Altman said.
xAI Completes Financing Round with $40 Billion Valuation
Elon Musk’s artificial intelligence company xAI has completed a new $6 billion financing round. According to documents filed with the SEC, 97 investors participated in the financing round. With this development, xAI’s market capitalization exceeded $40 billion.
Bitcoin Futures Hit Eight-Month High The
annual premium on Bitcoin’s two-month futures reached 20%, an eight-month high. According to Deribit data, calls outpaced puts by 48%.
Marathon Digital Purchased 1,423 BTC in the Last 6 Hours Marathon Digital ($MARA)
US-based publicly traded mining company has reportedly purchased 1,423 new Bitcoins worth approximately $139.5 million in the last 6 hours. According to Lookonchain data, this purchase significantly increased the company’s Bitcoin holdings.
HIGHLIGHTS OF THE DAY
Important Economic Calender Data
| Time | News | Expectation | Previous |
|---|---|---|---|
| – | Ronin (RON): WF Token Community Rounds | – | – |
| – | Yield Guild Games (YGG): Kaidro Purge Event | – | – |
| 13:30 | US Average Hourly Earnings (MoM) (Nov) | 0.3% | 0.4% |
| 13:30 | US Nonfarm Payrolls (Nov) | 218K | 12K |
| 13:30 | US Unemployment Rate (Nov) | 4.1% | 4.1% |
| 14:15 | US FOMC Member Bowman Speaks | – | – |
| 15:00 | US Michigan Consumer Sentiment (Dec) | 73.3 | 71.8 |
| 15:30 | US FOMC Member Goolsbee Speaks | – | – |
| 17:00 | US FOMC Member Hammack Speaks | – | – |
| 18:00 | US FOMC Member Daly Speaks | – | – |
INFORMATION:
*The calendar is based on UTC (Coordinated Universal Time) time zone. The economic calendar content on the relevant page is obtained from reliable news and data providers. The news in the economic calendar content, the date and time of the announcement of the news, possible changes in the previous, expectations and announced figures are made by the data provider institutions. Darkex cannot be held responsible for possible changes that may arise from similar situations.
MARKET COMPASS
Ahead of the critical employment data from the US, global markets have a mixed outlook. Expectations that the Chinese government may take new steps to support its economy have pushed the country’s stock markets higher, while it is difficult to see a clear direction in the continent’s other indices. European stock markets are expected to start the day slightly higher and flat.
The sharp movements in Bitcoin after the US transactions yesterday were remarkable. The largest cryptocurrency fell as low as $90,500 before rebounding back above $98,000. There is no obvious reason for this price change.
Today, markets will be watching labor market statistics, which could be decisive for the US Federal Reserve’s interest rate cut path, and the figures could have a directional impact on asset prices.
Non-Farm Payrolls Change Before Interest Rate Decision!
In October, the US economy was only able to increase non-farm payrolls by 12,000 jobs, well below expectations (106,000) due to the storms and strikes in the country. Almost everyone had already predicted that natural disasters and strikes would have an impact on the data. However, such a deep mark was not in anyone’s projections. Nevertheless, this NFP, which was much lower than expected, did not disturb the market perception too much and the idea that this was due to a temporary factor was widely accepted. However, it would not be wrong to say that this may not be the case for the November data.
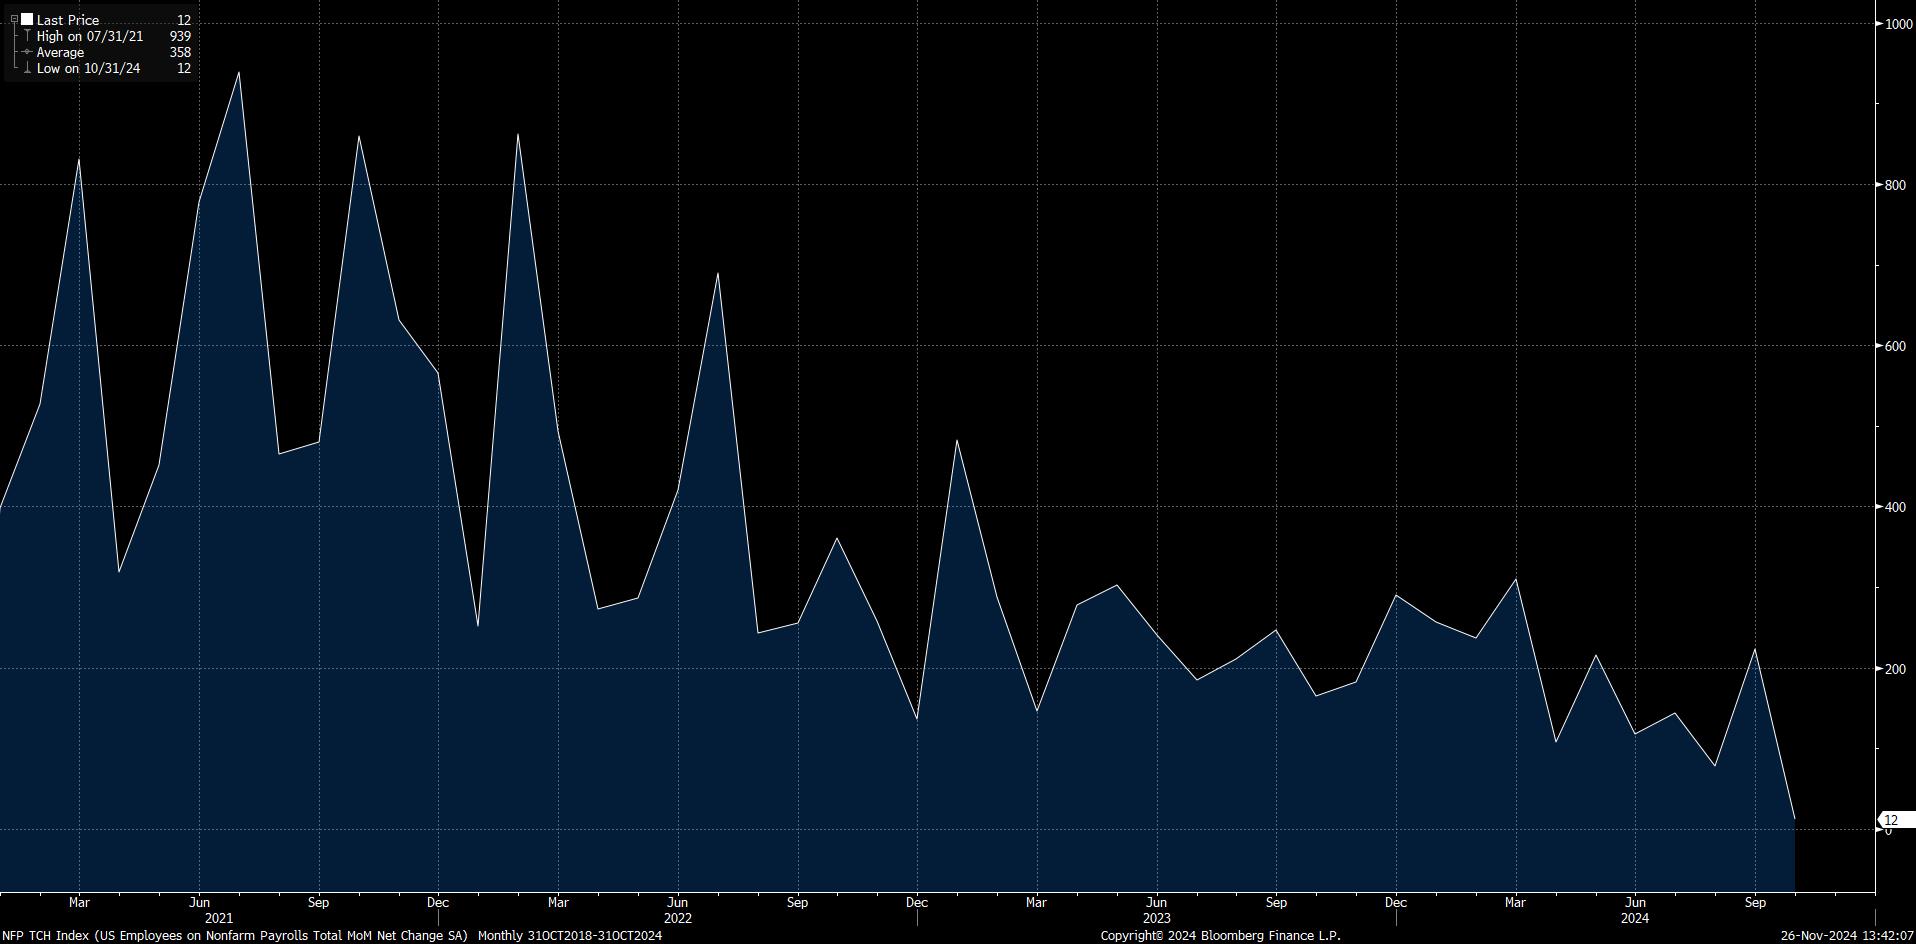
Source: Bloomberg
We expect NFP, which is known to include seasonal effects, to point to a better performance in November after last month’s quiet one-off increase. However, it is important to keep in mind that market expectations will also be in this direction and this will have already entered prices. According to Bloomberg, the US economy is expected to have added 218,000 jobs in November. After October’s 12,000, this includes payrolls coming back from strikes affecting 38,000 workers at Boeing and 3,400 hotel workers in Hawaii. The effects of Hurricane Helene and Hurricane Milton in October are really hard to gauge and we think we will see revisions more clearly in the November report.
If the NFP is below expectations, we believe that this will be read as a factor that will ease the Fed’s hand to cut the policy rate and risk appetite in global markets will increase. On the other hand, we expect a higher-than-expected data to have the opposite effect. In other words, the equation of “good data bad market, bad data good market” may work. It should be added that a data that is too high or too low than the consensus figure that will emerge as a result of the surveys may cause us to see a different reaction from this equation.
From the short term to the big picture.
The victory of former President Trump on November 5, which was one of the main pillars of our bullish expectation for the long-term outlook in digital assets, produced a result in line with our forecasts. In the aftermath, the president-elect’s appointments to Congress and the increased regulatory expectations for the crypto ecosystem in the US remained in our equation as a positive variable. Although Powell gave cautious messages in his last speech, the fact that the FED continued its interest rate cut cycle and the volume in BTC ETFs indicates an increase in institutional investor interest (in addition, MicroStrategy’s BTC purchases, Microsoft’s start to evaluate the purchase issue, BlackRock’s BTC ETF options start trading…) supports our upward forecast for the big picture for now.
In the short term, given the nature of the market and pricing behavior, we think it would not be surprising to see occasional respite or pullbacks in digital assets. However, at this point, it would be useful to underline again that the fundamental dynamics continue to be bullish.
TECHNICAL ANALYSIS
BTC/USDT
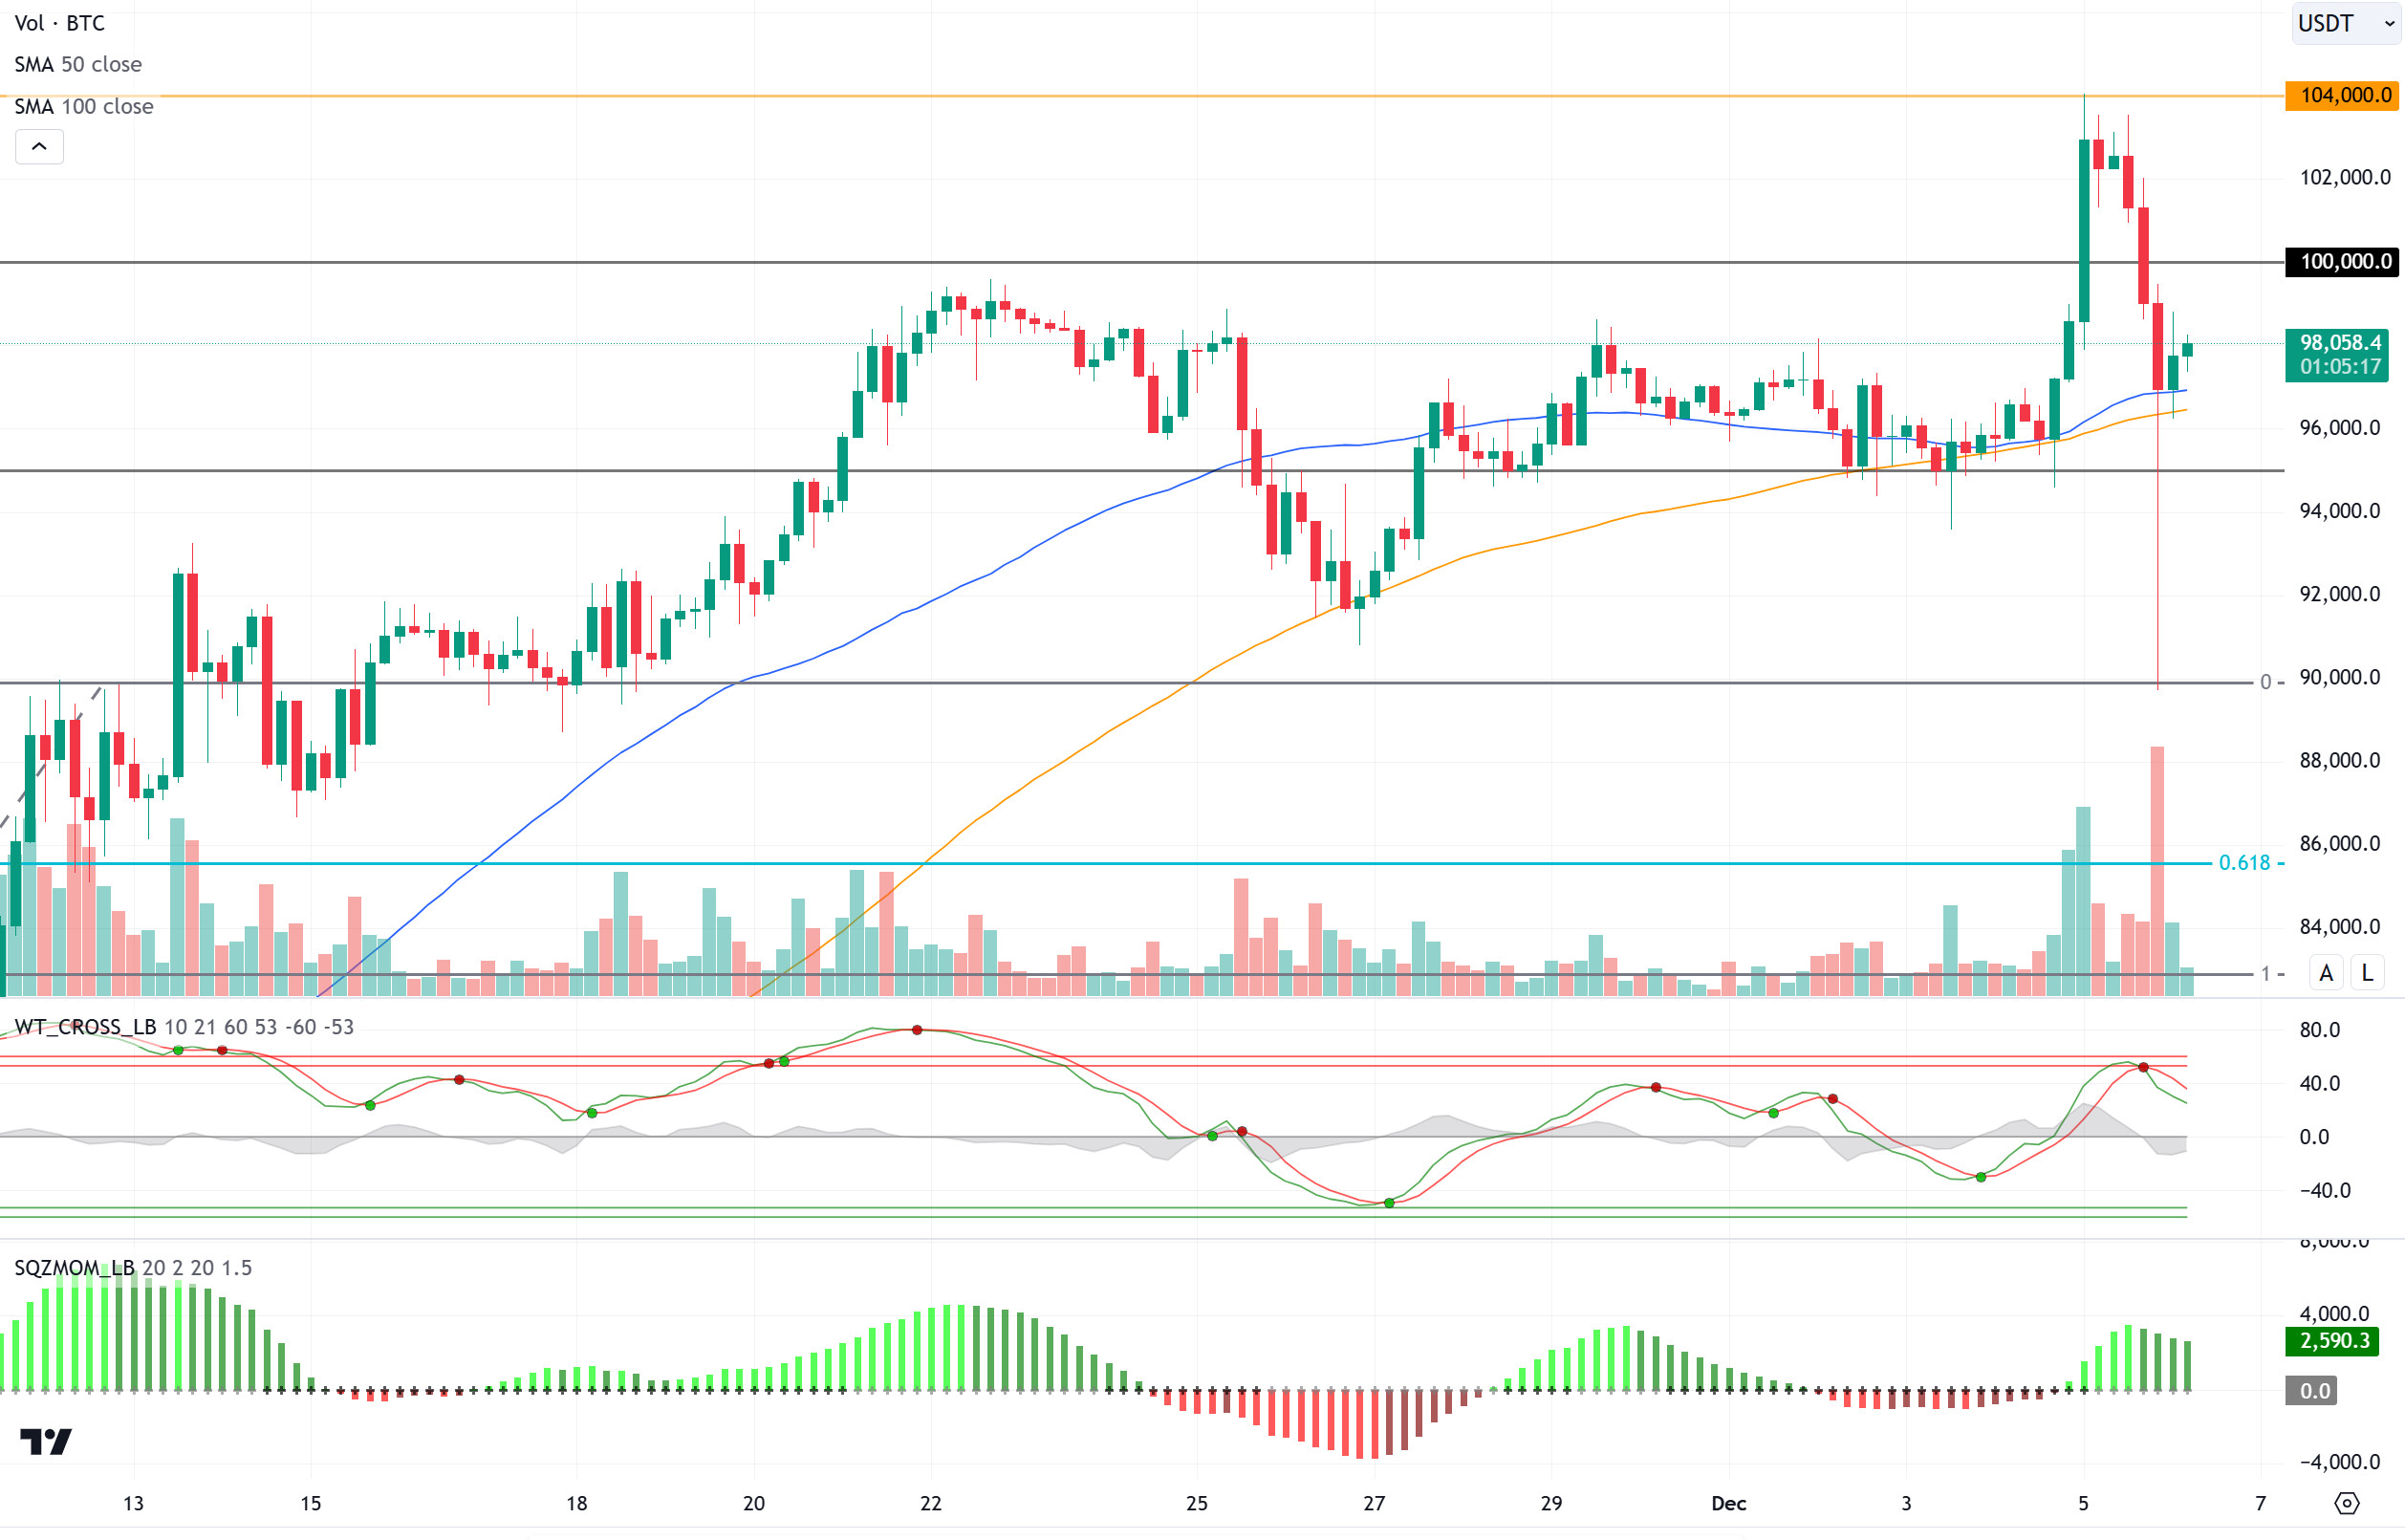
Bitcoin, which rose to six-digit levels after US President D. Trump’s moves on cabinet initiatives, declined again with profit sales. On the fundamental side, BTC spot ETFs witnessed positive inflows for the sixth consecutive day, while Marathon Digital (MARA), known for its Bitcoin purchases, bought 1,423 new Bitcoins worth about $139.5 million in the last 6 hours.
When we look at the technical outlook with the latest developments, BTC, which tested the 104,000 level with the crossing of the psychological resistance level of 100,000, could not stay at these levels. With the profit realization of investors, the price broke the 100,000 level in the downward direction and turned its direction up again with support from the 50-day SMA line. With the retracement, the wick to the 90,000 level attracted a lot of attention in order to clear the increasing long transactions in the futures market on the hourly charts. In BTC, which is currently trading at 98,000, technical oscillators give a sell signal on hourly charts, while the momentum indicator is losing strength in the positive zone. With the deepening of the retreat, the 95,000 support level was followed, while the 100,000 level became psychological resistance again.
Supports 95,000 – 92,500 – 90,000
Resistances 100,000 – 104,000 – 105,000
ETH/USDT
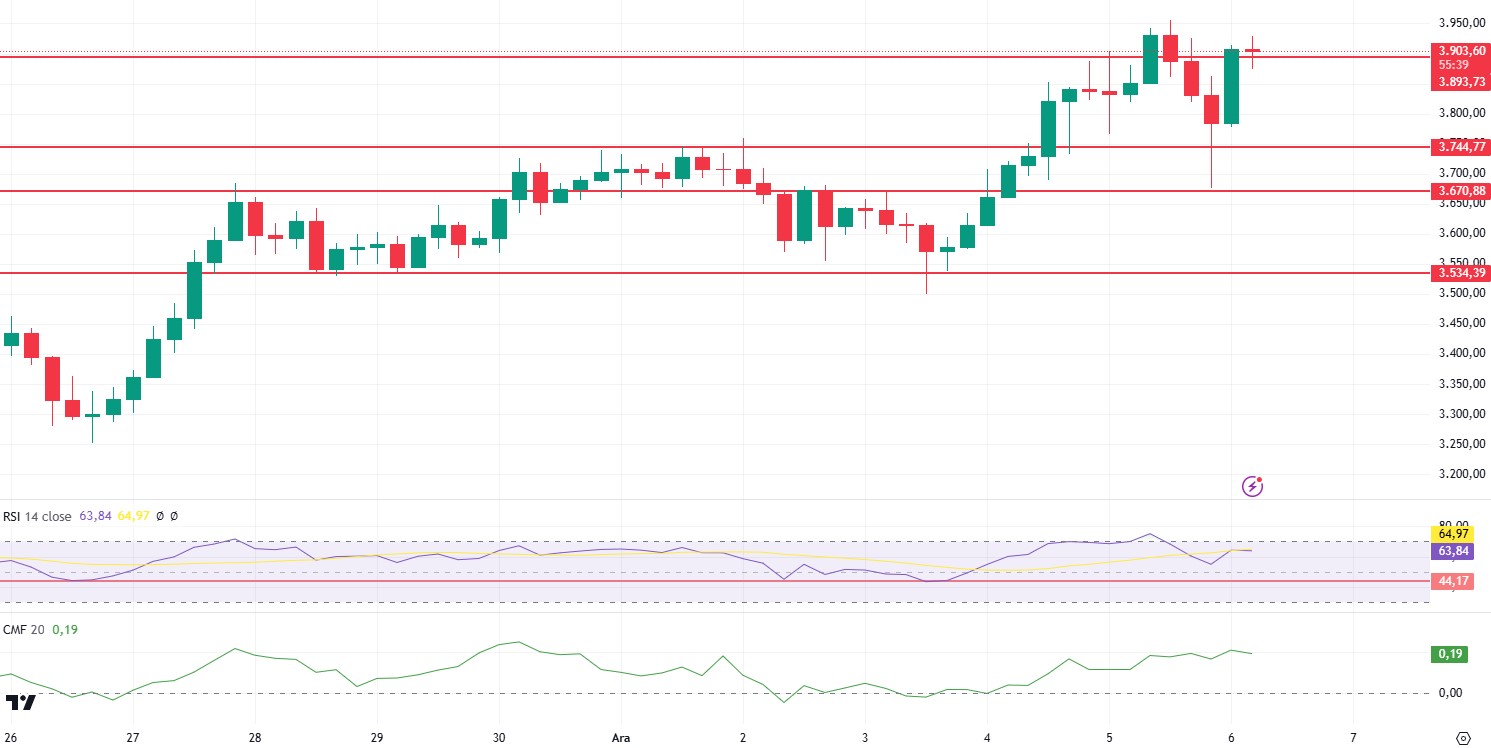
With funding rates at very high levels in ETH and BTC, a rapid crash was seen last night, with BTC falling to the $90,000 level and ETH falling to 3,670 support. With this drop, the correction of the Relative Strength Index (RSI) from the overbought zone looks very positive. Record buying from ETH ETFs also seems to have compensated for this decline. We continue to see rapid increases in Ethereum Betas as well. The fact that on-chain activities are at record levels compared to the past months can be listed as another major factor indicating that the bullish scenario may continue. The 3,534 level stands out as the most important support level for ETH, where we can see new ATH levels if investors continue to buy with ETFs and the price exceeds 4,093 levels. The break of this level may bring sharp declines.
Supports 3,893 – 3,744 – 3,670
Resistances 4,093 – 4,299 – 4,474
XRP/USDT
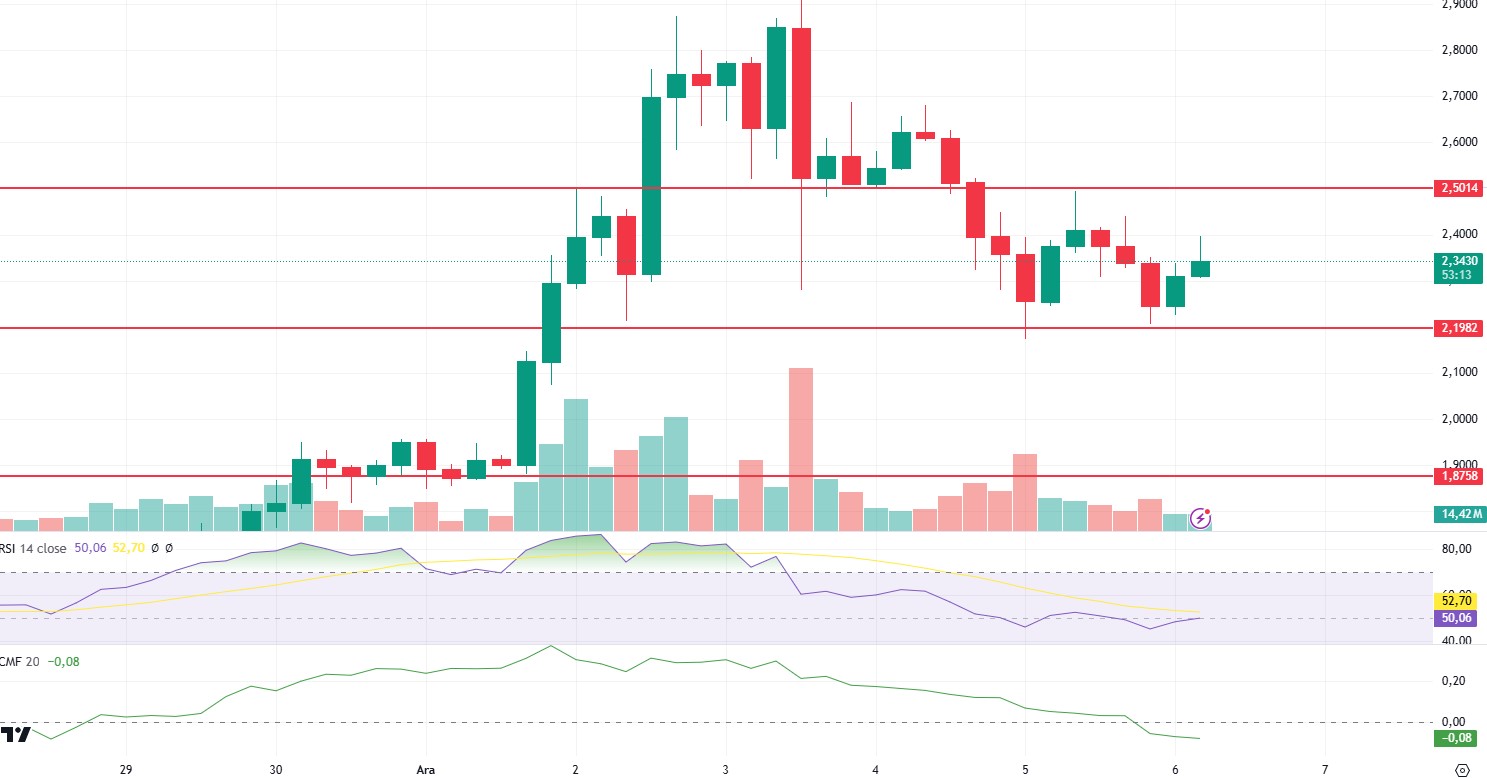
As mentioned in last night’s analysis, XRP fell as low as 2.1982 with the weakening in momentum and volume and managed to rise to 2.3 again with support from this area. Although Chaikin Money Flow (CMF) maintains its negative outlook by coming below the zero line, positive divergence is seen. The double bottom made by the Relative Strength Index (RSI) can be counted as another positive factor. With all these data for XRP, where momentum is heading up again, it can be said that the 2.5 level can be tested again during the day. However, the weakness in volume may indicate that investors should be careful against the 2.19 level and that the declines may deepen with the break of this level.
Supports 2.1982 – 1.8758- 1.2333
Resistances 2.5014 – 2.6971 – 3.105
SOL/USDT
Average hourly earnings, non-farm payrolls change and Unemployment Rate are among the data to be monitored in the US today.
In the Solana ecosystem, co-founder Anatoly Yakovenko advised crypto startups to move to the US as the country has more regulatory clarity. In a post on X, Yakovenko stated that moving to the US is off limits for these startups. Solana (SOL), on the other hand, has registered renewed bullish interest with a number of large whales acquiring SOL. This came on the heels of Grayscale’s interest in spot Solana ETFs and institutions’ justification for Solana’s sustainability. However, a key reason for Solana’s surge in activity is the growing meme coin ecosystem. Solana meme coins have risen to a market capitalization of over $19 billion as users mine new assets.
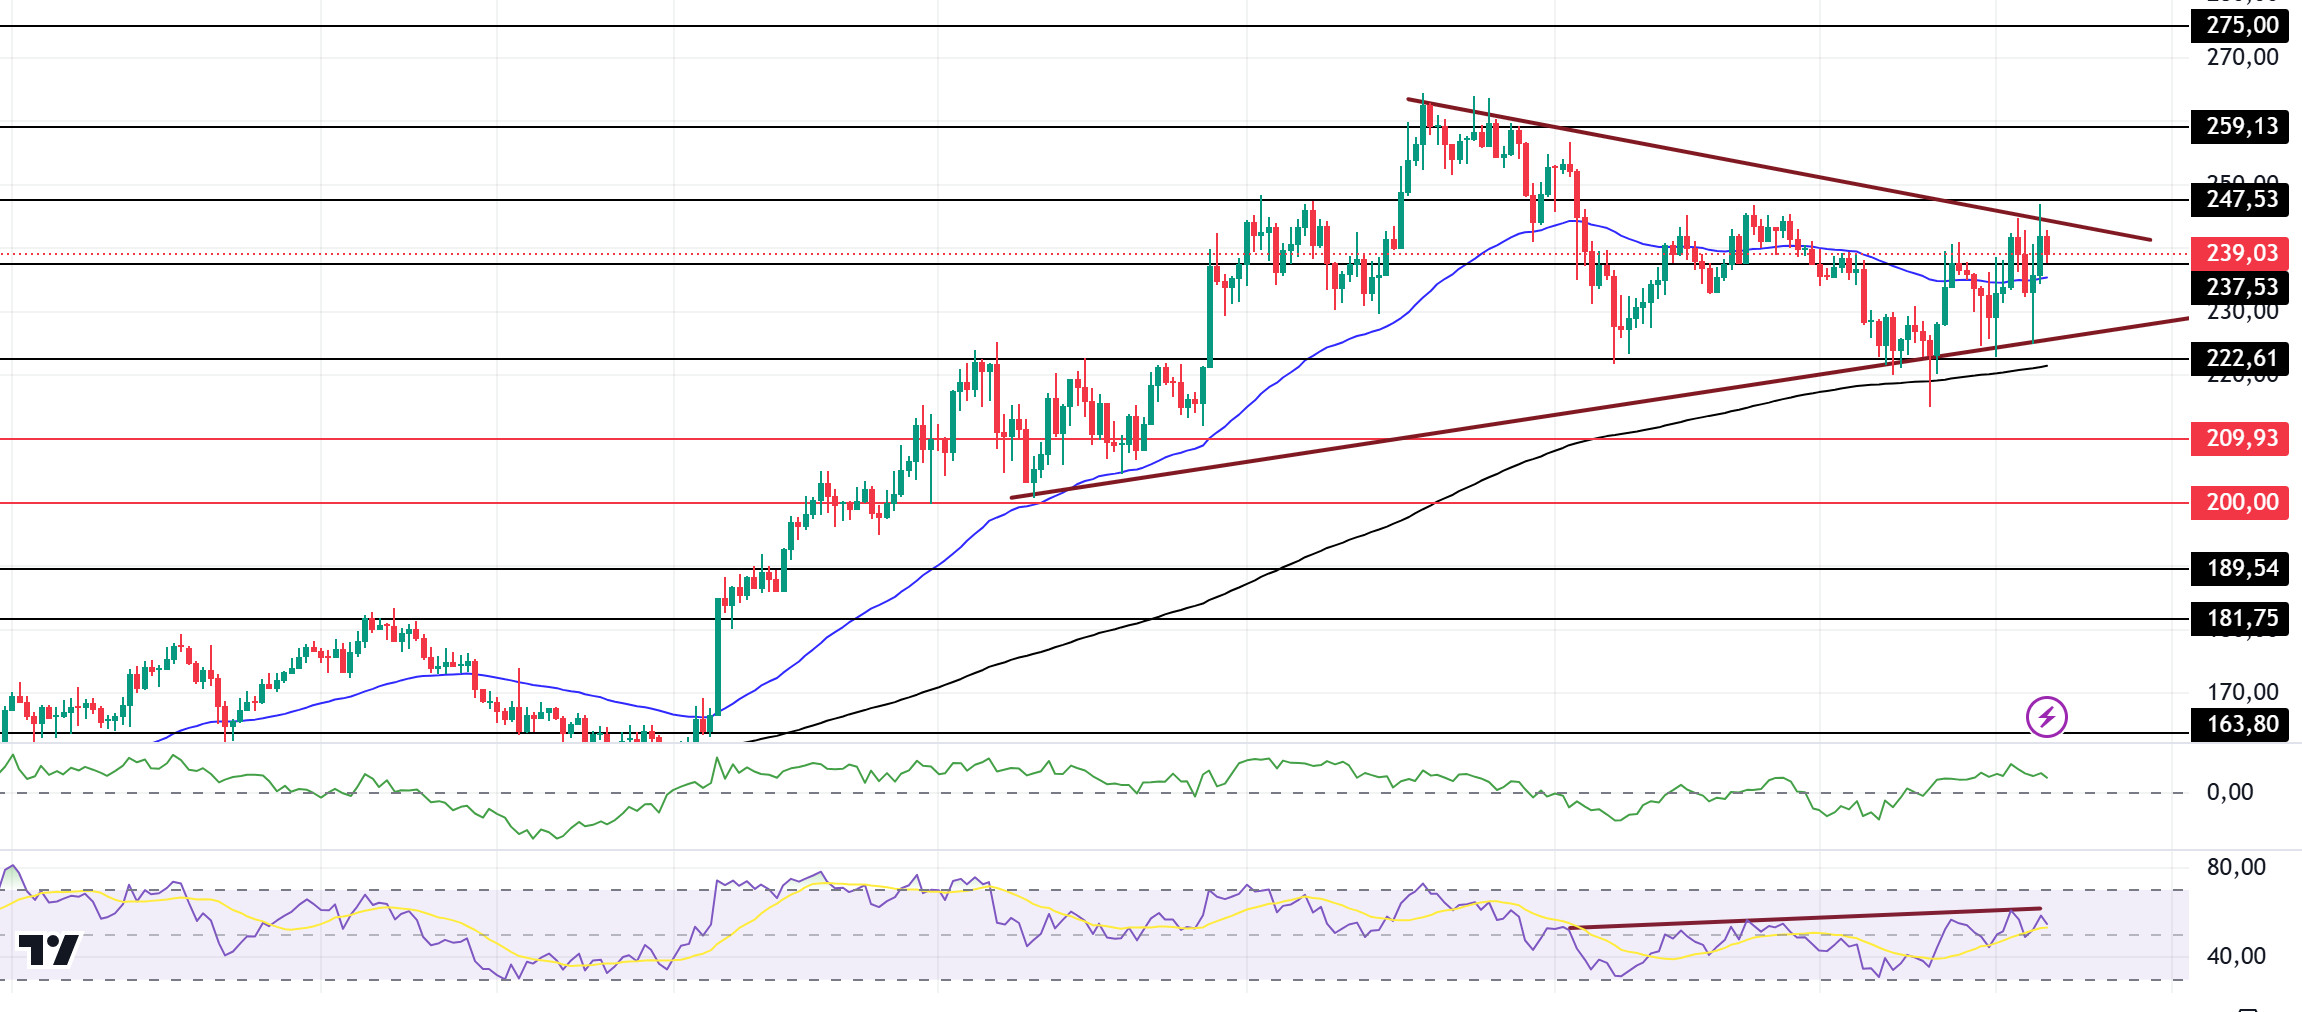
On the 4-hour timeframe, the 50 EMA (Blue Line) is above the 200 EMA (Black Line). Since November 22, SOL has been in a downtrend and although it broke the downtrend, we can say that this is a rise due to the general market. As a matter of fact, the momentum started to decline even though the price started to rise with support from the 200 EMA. When we analyze the Chaikin Money Flow (CMF)20 indicator, we see that there is an increase in money inflows. This can be shown as an upward signal. However, Relative Strength Index (RSI)14 is at neutral level. At the same time, there is a bearish mismatch between the RSI (14) and the chart. On the other hand, the symmetrical triangle pattern stands out. If it works, the $291.00 level could be the target. The 247.53 level stands out as a very strong resistance point in the rises driven by both macroeconomic conditions and innovations in the Solana ecosystem. If it breaks here, the rise may continue. In case of retracements due to possible macroeconomic reasons or profit sales, support levels 221.61 and 189.54 may be triggered again. If the price reaches these support levels, a potential bullish opportunity may arise if momentum increases.
Supports 237.53 – 222.61 – 209.93
Resistances 247.53 – 259.13 – 275.00
DOGE/USDT
Average hourly earnings, non-farm payrolls change and Unemployment Rate are among the data to be monitored in the US today.
DOGE’s volume has also increased significantly as whales continue to accumulate tokens as they did in the immediate aftermath of last month’s elections. Indeed, the volume in the last 24 hours has reached $10.25 billion.
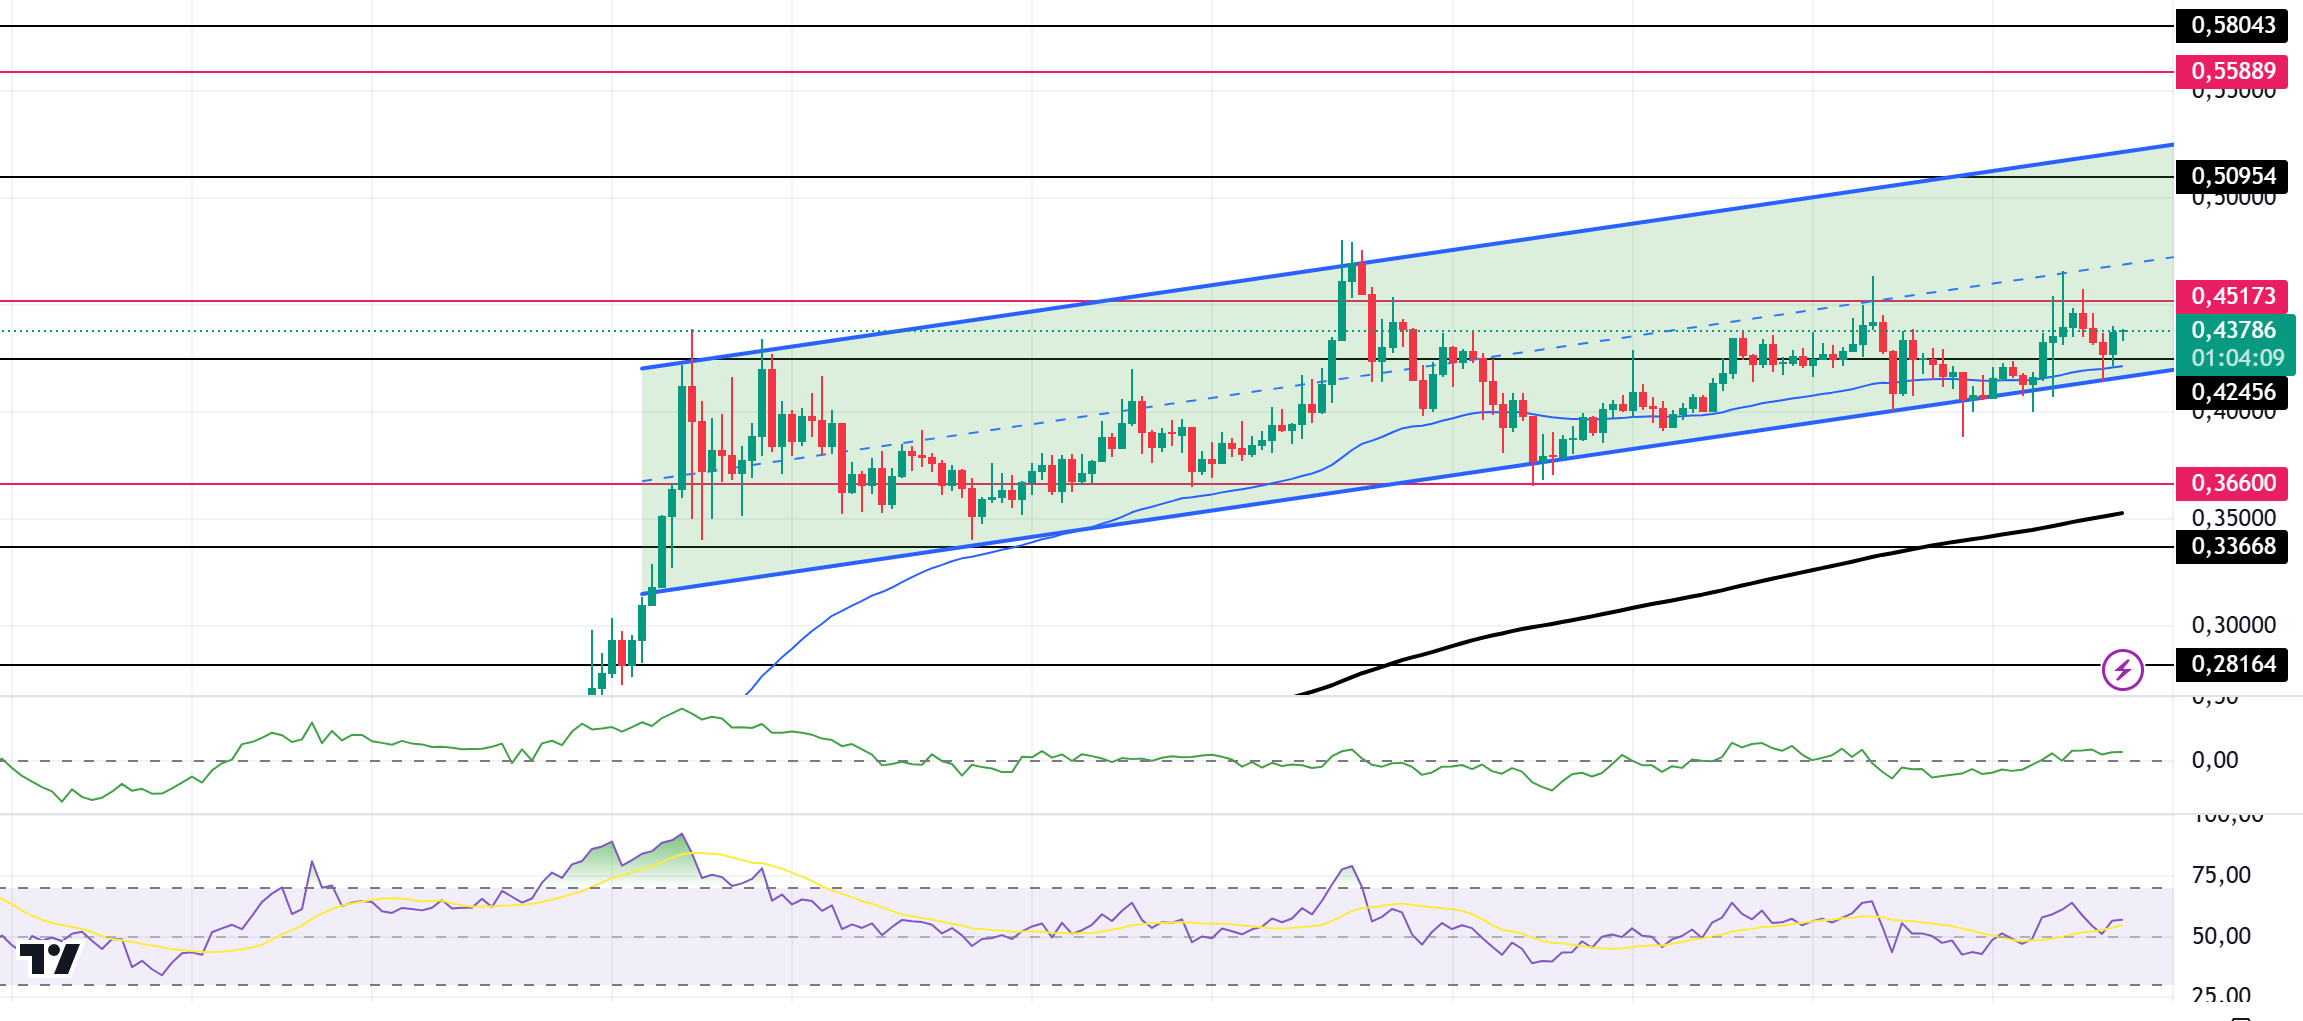
When we look at the chart, the asset, which has been in an uptrend since November 11, has risen with support from both the base level of the trend and the 50 EMA. If the upward momentum is strong, the 0.50954 level may be triggered. On the 4-hour timeframe, the 50 EMA (Blue Line) is above the 200 EMA (Black Line). But the gap between the two averages is still too wide. This may cause pullbacks. On the other hand, when we look at the RSI 14 indicator, we see that it is moving towards its neutral level. However, when we examine the Chaikin Money Flow (CMF)20 indicator, we see that there is a small amount of money inflows. The 0.50954 level appears to be a very strong resistance level in the rises driven by both macroeconomic conditions and innovations in Doge coin. If DOGE maintains its momentum and rises above this level, the rise may continue strongly. In case of retracements due to possible macroeconomic reasons or profit sales, the 0.36600 support level can be triggered again. If the price reaches these support levels, a potential bullish opportunity may arise if momentum increases.
Supports 0.42456 – 0.36600 – 0.33668
Resistances 0.45173 – 0.50954 – 0.55889
LEGAL NOTICE
The investment information, comments and recommendations contained herein do not constitute investment advice. Investment advisory services are provided individually by authorized institutions taking into account the risk and return preferences of individuals. The comments and recommendations contained herein are of a general nature. These recommendations may not be suitable for your financial situation and risk and return preferences. Therefore, making an investment decision based solely on the information contained herein may not produce results in line with your expectations.


