
MARKET SUMMARY
Latest Situation in Crypto Assets
*Prepared on 27.08.2024 at 07:00 (UTC)
WHAT’S LEFT BEHIND
Bitcoin Consolidated Around 64 Thousand Dollars
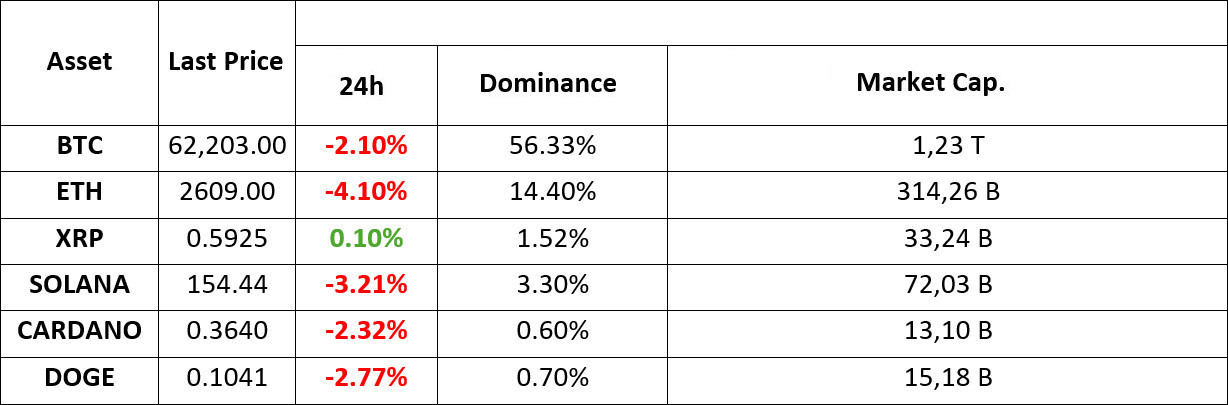
Bitcoin (BTC) increased by 5 percent on Friday after the positive comments of Jackson Hole, but as of this morning, it fell below the $ 64,000 level again. US Federal Reserve Chairman Jerome Powell said on Friday that the easing cycle will begin next month, which will disperse the negative atmosphere around risk assets.
Ethereum Transaction Volume is in Serious Decline
The seven-day moving average of the daily trading volume of the largest altcoin Ethereum (ETH) has fallen 55% in the last 30 days, The Block reports. Ethereum trading volume and transactions fell significantly and sharply in August, most recently on Sunday when the number of daily transactions on the network fell to 1.07 million, its lowest level in months.
Telegram Declares Compliance with EU Digital Services Law
“Telegram complies with EU laws, including the Digital Services Act – its moderation is within industry standards and constantly improving,” the company said in a statement. “Telegram’s CEO Pavel Durov has nothing to hide and often travels to Europe.”
HIGHLIGHTS OF THE DAY
INFORMATION
The calendar is based on UTC (Coordinated Universal Time) time zone. The economic calendar content on the relevant page is obtained from reliable news and data providers. The news in the economic calendar content, the date and time of the announcement of the news, possible changes in the previous, expectations and announced figures are made by the data provider institutions. Darkex cannot be held responsible for possible changes that may arise from similar situations.
COMPASS OF THE MARKET
The mixed picture we saw in the US stock markets on the first day of the week continues in Asian markets this morning. Yesterday, Dow Jones managed to close in the positive territory with investors selling technology stocks, which dragged other indices down, while this morning the Japanese Nikkei index is in the green and the rest of the continent’s stock markets are generally slightly negative. On the traditional markets side, where there is no clear sign of risk appetite, the rise in oil prices is also noteworthy. The consequences of the tension between Israel and Lebanon are being felt on oil prices. On the other hand, European stock markets are expected to start the day slightly higher due to the expected easing of interest rates in the US and Europe.
In general, it would not be wrong to state that the markets are experiencing a “post-Powell period”. US Treasury bond yields rose slightly after the FED Chairman’s remarks, giving back some of the movement. At this point, we see that the expectations that the FED will cut by 25 basis points at each meeting have started to come to the fore in the markets. It seems that the main headline that will continue to be influential on asset prices will be the FED’s monetary policy and US data.
Considering this framework, which is expected to drive risk appetite and pricing behavior for traditional markets and digital assets today, it may be useful to watch the US Consumer Confidence index. Any data above expectations could be negative for cryptocurrencies, while any data below could be positive. However, it is still not correct to expect it to disrupt the “horizontal-mildly bearish” outlook after Powell’s speech.
TECHNICAL ANALYSIS
BTC/USDT
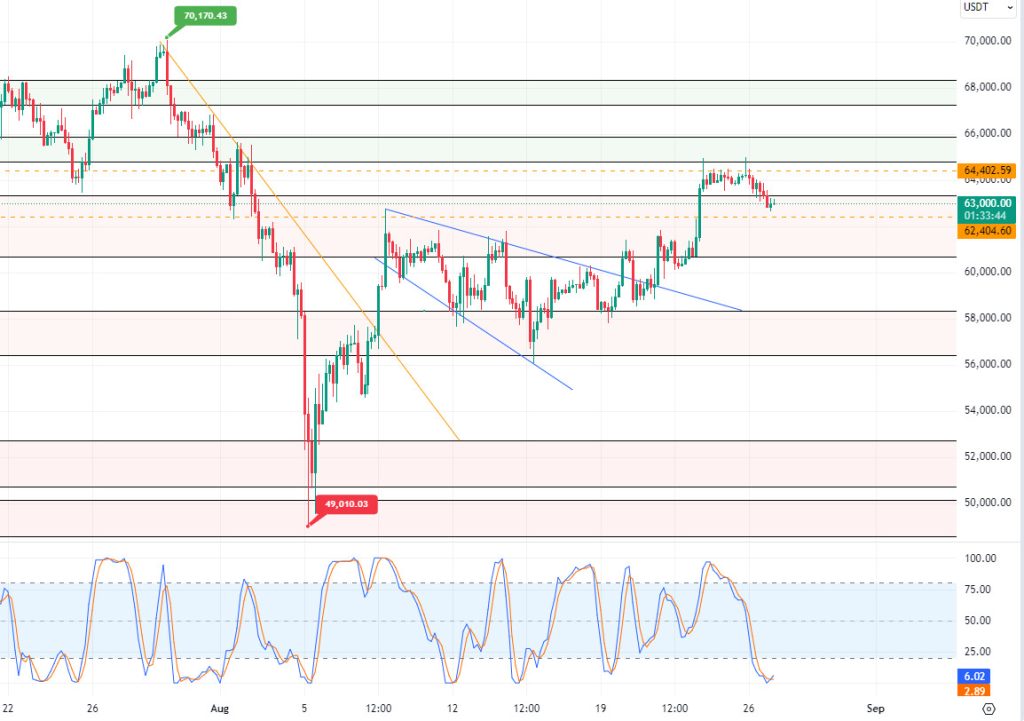
The latest situation in Bitcoin! The expectation of interest rate cuts and FED Chairman Powell’s monetary policy easing cycle pushed Bitcoin to the 65,000 level, but this level could not be sustained after being tested twice. Among the market agenda, the detention of Telegram’s CEO Pavel Durov and the fall in the “TON” coin are among the factors that negatively affected the market. On the other hand, spot Bitcoin (BTC) exchange traded funds (ETFs) are witnessing record inflows with the interest of institutional investors. In light of these developments, Bitcoin continues to consolidate at 63,000 levels with slight sellers. In the BTC 4-hour technical analysis, it fell below the support level of 63,300, which is below the support level of 63,300, and after moving the price to the 62,700 level, it found buyers at this level and came back above the 63,000 level. The 63,300 level, which previously appeared as support, may appear as a new resistance point. Our technical indicator RSI may test 64,000 levels again as it moves up from the oversold zone. We may need to carefully monitor developments outside the macroeconomic agenda as they will be decisive for the direction. The level we expect to appear as an intermediate support point in a possible selling wave is 62,400.
Supports 62,400 – 61,700 – 60,650
Resistances: 63,300 – 64,400 – 65,100
ETH/USDT
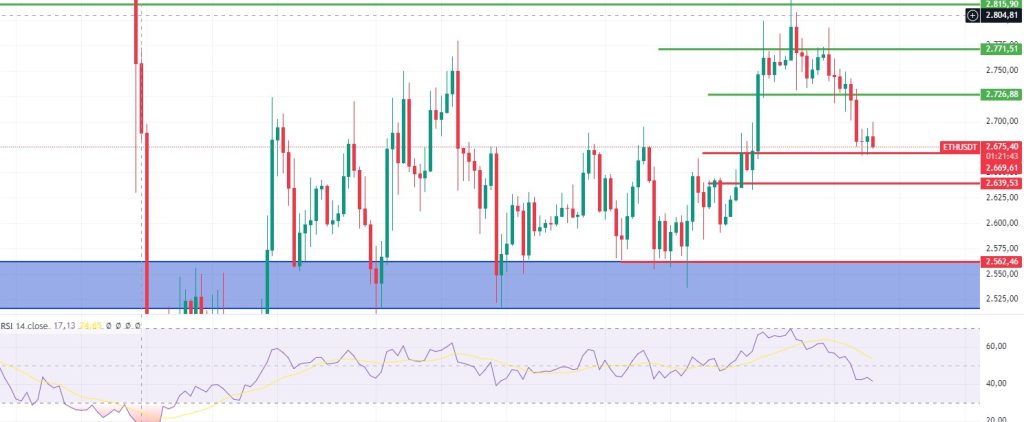
With the retreat in Ethereum yesterday, positive mismatches in many indicators, especially Rsi, caused a reaction at 2,667 levels. However, the selling pressure in the spot order books, whale orders on the futures side and the positive funding rate may cause the decline to continue its pace during the day. The 2,726 level, which was the hourly kumo support yesterday, has become an important resistance today. Exceeding this level may allow the trend to accelerate upwards again. When we look at Dune data, Tvl declines in L2 networks are noteworthy. The sales of ETH extracted from L2 networks on Dexler also seem to have led to serious selling pressure.
Supports 2,669 – 2,639 – 2,562
Resistances 2,726 – 2,771 – 2,815
LINK/USDT
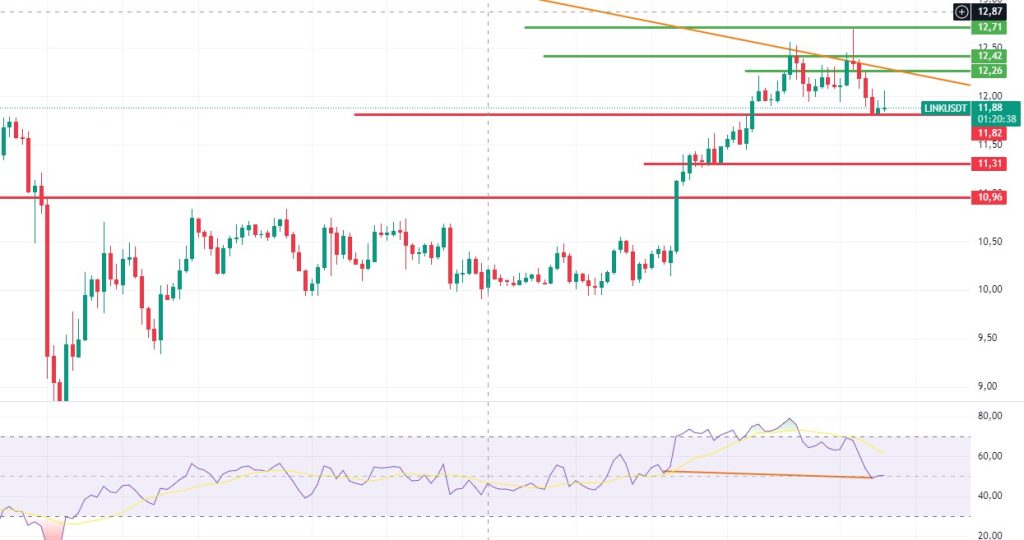
Similar to Ethereum, Chainlik also rose to 12.02 levels, reacting from 11.82 levels with positive mismatches in Rsi and Mfi. Considering the success of the Bollinger bands in LINK, LINK, which is supported by the lower band, may want to go at least up to the middle band 12.13. 12.26 is the resistance point of the three-contact trend line from May 30. Although LINK cannot be expected to overcome this resistance easily in an environment where the movements in Etherum remain so weak and momentum is at serious down levels, exceeding it can bring a serious upward movement. The loss of 11.82 may bring a decline to 11.31.
Supports 11.82 – 11.31 – 10.96
Resistances 12.26 – 12.42 – 13.71
SOL/USDT
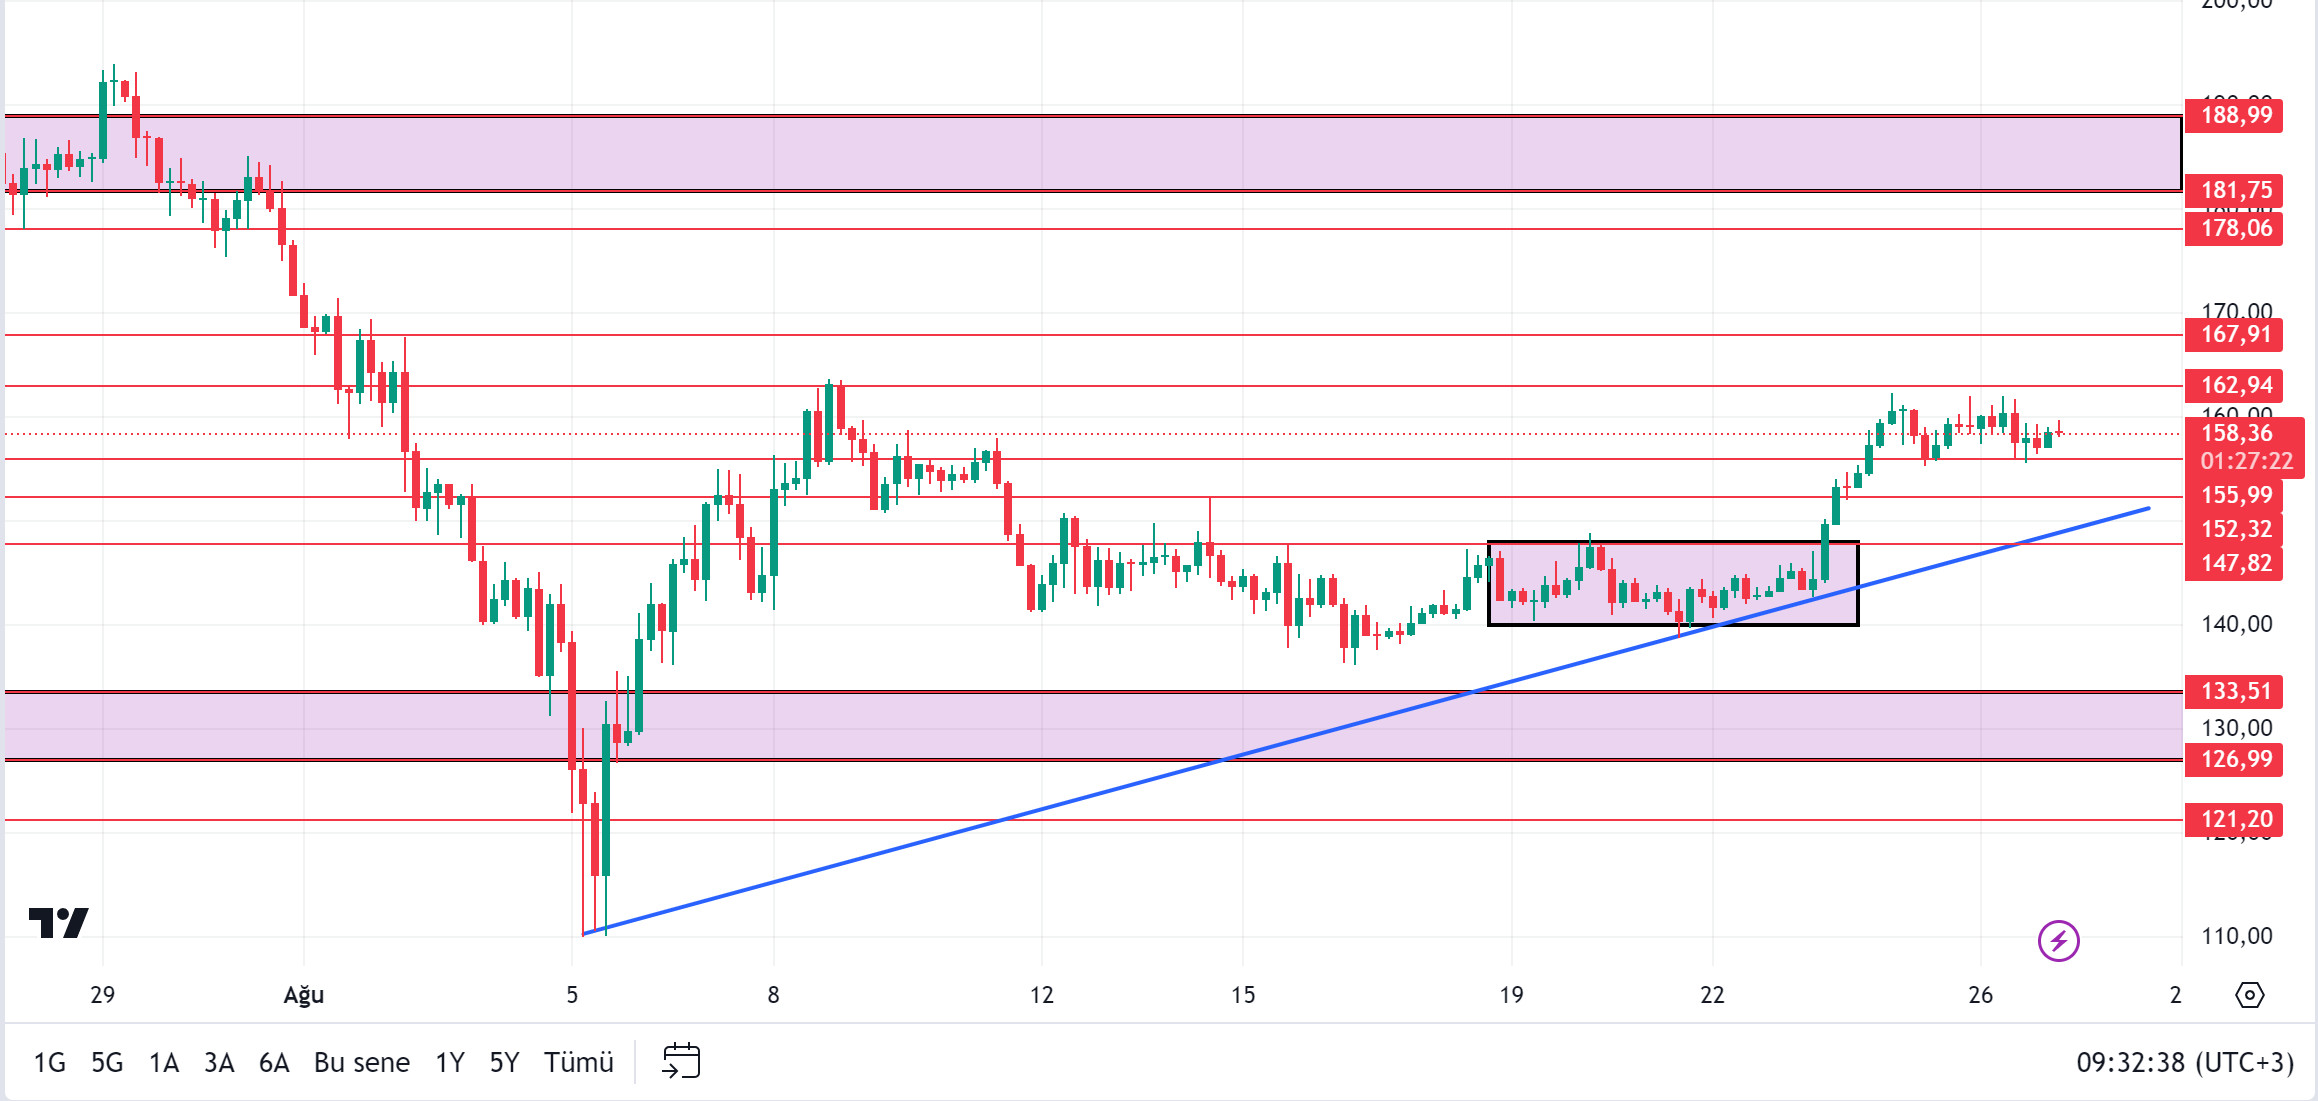
The market has started to slowly price in the 25 basis point hike forecast. Although it is not enough, we may see an upward pricing in the coming period. According to the data we received from CME, this ratio has increased to 71.5%. According to the data received from the Defillama platform, the amount released from the Solana ecosystem yesterday reached a peak of 78.58 million dollars. This explains the lack of volume of the meme token fury in the Solana ecosystem. At the same time, Lookonchain reported that a whale bought 28,717 Solana ($4.56 million) from the exchange. The whale then put them into the staking system to generate returns. When we look at the chart, it needs to break the 162.94 – 167.91 resistances to continue the uptrend. If investors’ appetite for profit realization increases, it may test the support levels of 155.99 – 152.32.
Supports 155.99 – 152.32 – 147.82
Resistances 162.94 – 167.91 – 178.06
ADA/USDT
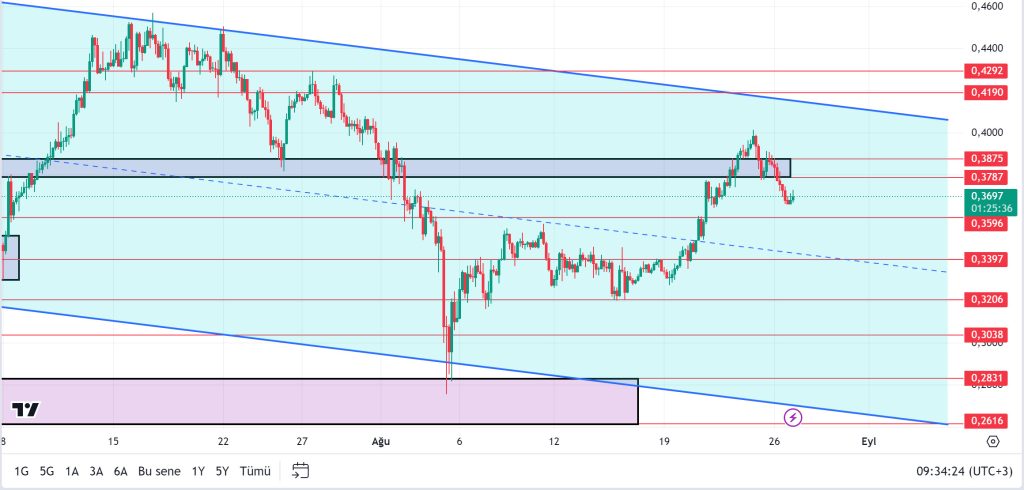
Will the Cardano Chang hard fork upgrade the ADA token? The postponement of the update has affected the price. There was a decrease of close to 4% compared to yesterday. On the other hand, Founder Charles Hoskinson praised Algorand’s blockchain technology and proposed a partnership for decentralized artificial intelligence projects. ADA is currently trading at 0.3697. If possible rises continue, 0.3787 – 0.3875 levels can be followed. If investors see the selling pressure and decide to realize profits, 0.3596 – 0.3397 levels can be followed as support.
Supports 0.3596 – 0.3397 – 0.3206
Resistances 0.3787 – 0.3875 – 0.4190
AVAX/USDT
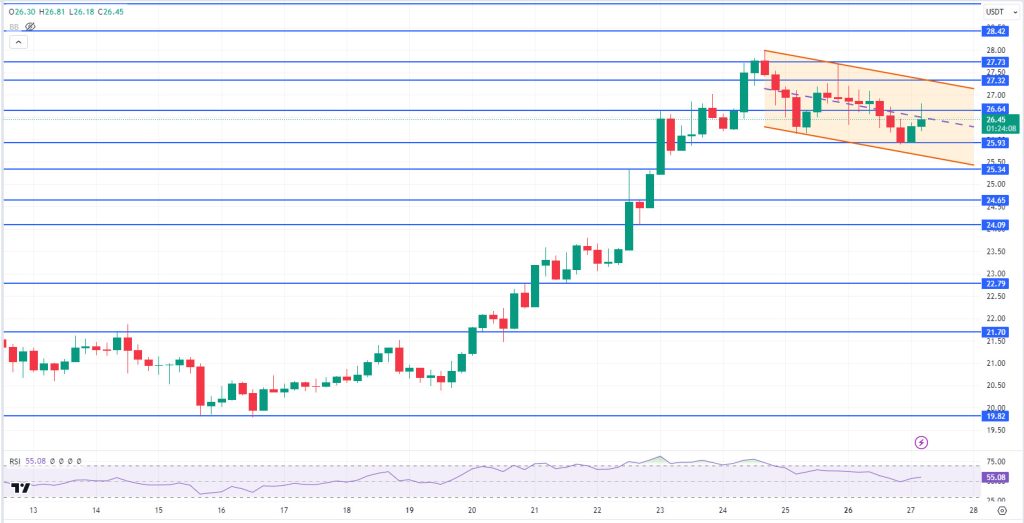
Durable goods orders data came from the US yesterday. The expectation was for a decline of 6.9% but there was an increase of 9.9%. The markets reacted in a selling direction, thinking that this data may have an impact on the FED interest rate cut. In addition, the negative closure of the US stock markets was also effective in the decline in the crypto market. AVAX, which opened at 26.93 yesterday, fell to 25.89 in the evening hours and closed the day at 25.94 with the reaction it received from 25.93 support. It is currently trading at 26.45 levels.
Today, US Conference Board (CB) consumer confidence data will be released. While waiting for this data, AVAX, which moves in a minor falling channel on the 4-hour chart, tends to break the middle band upwards and go to the upper band. If it breaks the 26.64 resistance, it may go to the upper band of the channel. In such a case, it may test the 27.32 resistance. Otherwise, it cannot break the 26.64 resistance and if sales come from here, it may move towards the lower band of the channel again. In this case, it may test the 25.93 and 25.34 supports.
Supports 25.93 – 25.34- 24.65
Resistances 26.64 – 27.32 – 27.73
TRX/USDT
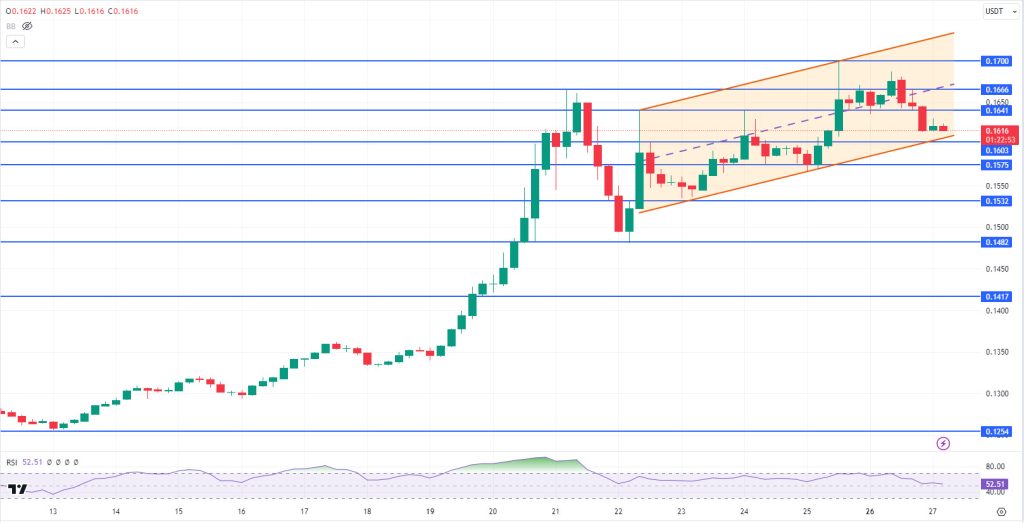
TRX, which started yesterday at 0.1663 levels, lost about 3% due to the data from the US and the declines in the US stock markets and closed the day at 0.1616.
Conference Board (CB) consumer confidence will be released today. It is not expected to affect the market much, but recently we have seen sudden reactions even to micro data. Therefore, when the data is released, it may create volatility in the market. TRX, currently trading at 0.1616, continues its movement within the rising channel on the 4-hour chart. It is in the lower band of the channel and can move towards the middle and upper band with the reaction it will receive from here. In such a case, it may want to break the 0.1641 and 0.1666 resistances. If there is no reaction from the lower band of the channel and a decline occurs, it may test 0.1603 and 0.1575 supports.
Supports 0.1603 – 0.1575 – 0.1532
Resistances 0.1641 – 0.1666 – 0.1700
DOT/USDT
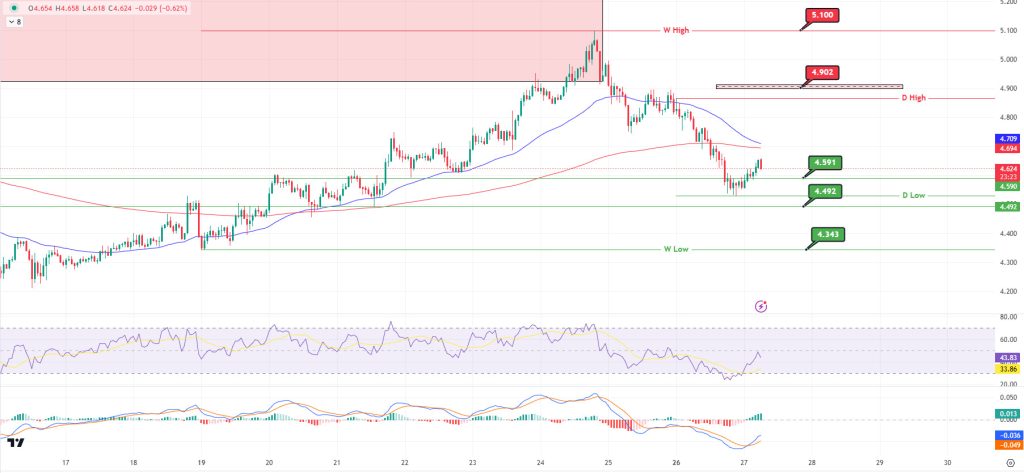
“Polkadot (DOT) seems to have retreated to 4,591 levels with increased selling pressure with some fundamental dynamics. It can be said that buying pressure increased on MACD compared to the previous hour. Rising from 4,591 levels with the reaction from 4,591 levels, the price may move towards 4,902 levels with increasing buying pressure. On the other hand, with the EMA50 breaking down the EMA200 line (Death Cross), the selling pressure may deepen. In this case, we can say that 4.591 and 4.492 are the first supports. The loss of these levels may pull the price back to 4,343 levels.
(Blue line: EMA50, Red line: EMA200) “
Supports 4.591 – 4.492 – 4.343
Resistances 4.902 – 5.100 – 5.290
SHIB/USDT
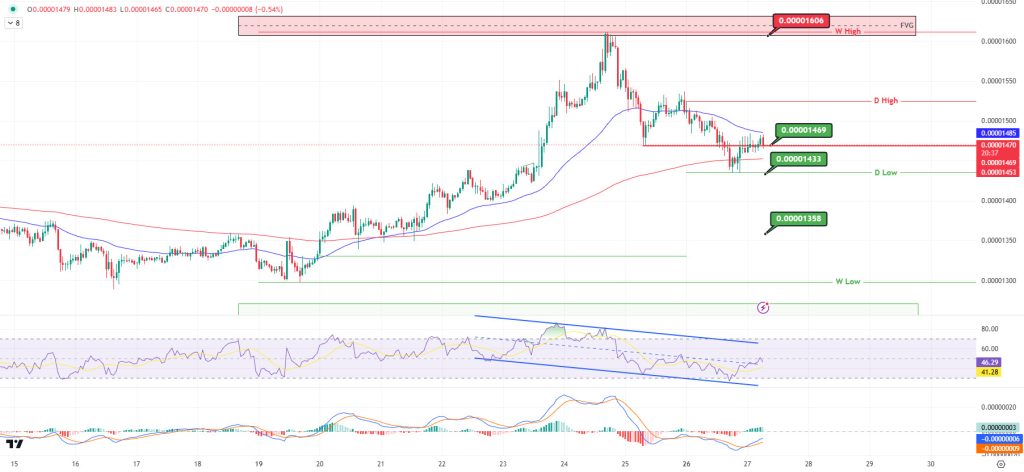
“Shiba Inu (SHIB) seems to have received a reaction from 0.00001433 levels by losing 0.00001469 support. We can say that the buying pressure on MACD has decreased compared to the previous hour. RSI is moving upwards with the reaction from the lower band within the falling channel. If the RSI breaks the falling channel upwards, the price may retest the 0.00001606 levels. On the other hand, it is seen that the EMA50 has returned to a negative slope. If the EMA50 breaks the EMA200 down (Death Cross), the price may retreat to 0.00001358 levels.
(Blue line: EMA50, Red line: EMA200)
Supports 0.00001469 – 0.00001433 – 0.00001358
Resistances 0.00001606 – 0.00001678 – 0.00001797
LEGAL NOTICE
The investment information, comments and recommendations contained herein do not constitute investment advice. Investment advisory services are provided individually by authorized institutions taking into account the risk and return preferences of individuals. The comments and recommendations contained herein are of a general nature. These recommendations may not be suitable for your financial situation and risk and return preferences. Therefore, making an investment decision based solely on the information contained herein may not produce results in line with your expectations.
