MARKET SUMMARY
Latest Situation in Crypto Assets
| Assets | Last Price | 24h Change | Dominance | Market Cap |
|---|---|---|---|---|
| BTC | 96,225.30 | 0.70% | 57.05% | 1,90 T |
| ETH | 3,561.13 | -0.87% | 12.86% | 428,97 B |
| SOLANA | 240.77 | 1.17% | 3.42% | 114,30 B |
| XRP | 1.61 | 8.60% | 2.75% | 91,81 B |
| DOGE | 0.4056 | 0.01% | 1.78% | 59,47 B |
| CARDANO | 1.0632 | 5.66% | 1.11% | 37,12 B |
| AVAX | 43.46 | 0.81% | 0.53% | 17,70 B |
| TRX | 0.2018 | 0.73% | 0.52% | 17,42 B |
| SHIB | 0.00002599 | 1.62% | 0.46% | 15,30 B |
| DOT | 8.535 | 3.63% | 0.39% | 12,98 B |
| LINK | 17.70 | -1.88% | 0.33% | 11,10 B |
*Prepared on 11.29.2024 at 07:00 (UTC)
WHAT’S LEFT BEHIND
Japan’s New Prime Minister Reorganizes Web3 and Crypto Policy Department
Japan’s new digital minister, Masaaki Taira, announced on November 27 that the party led by the country’s prime minister, Shigeru Ishiba, has restructured the Web3 and crypto policies department. It is stated that this arrangement aims to increase Japan’s effectiveness in the field of digital innovation.
BlackRock Increases iShares Bitcoin Trust Stake to $78 Million
BlackRock held a total of $78 million worth of shares in iShares Bitcoin Trust (IBIT) as of September 30. According to SEC filings, the BlackRock Strategic Income Opportunities Fund added more than 2 million IBIT shares to its portfolio during this period. The fund currently has a significant investment in Bitcoin with 2,140,095 IBIT shares.
Giant Whale Deposits 9,380 ETH on a Centralized Exchange
In a transaction tracked by Spot On Chain, a major Ethereum whale deposited 9,380 ETH worth approximately $33.7 million on a centralized exchange. Since the beginning of November, the whale has largely divested its holdings, selling a total of 14,233 ETH at an average price of $3,431.
Pump.fun Sells 65,000 SOLs, Totaling Over $200 Million
NFT trading platform pump.fun sold 65,000 SOLs worth $15.3 million in the last 7 hours, according to on-chain analysis. The company’s total sales to date totaled 1.137 million SOLs and the total cash proceeds amounted to $207 million. The platform also generated 1.516 million SOL in transaction fee revenue.
Uniswap Breaks Record with $38 Billion Trading Volume in November
Uniswap reached $38 billion in trading volume in November, up 50% from October and a record monthly high. This growth was driven by strong performance on Ethereum Layer 2 solutions Arbitrum, Base and Polygon. The exchange’s success reinforces its dominance in the DeFi space.
HIGHLIGHTS OF THE DAY
Important Economic Calender Data
| Time | News | Expectation | Previous |
|---|---|---|---|
| Half-Day | Holiday – United States: Thanksgiving Day (Early close at 13:00) | – | – |
| 12:00 | Immutable 24.52MM Token Unlock | – | – |
| – | PEPPER Token Burn Event | – | – |
| – | Seedworld (SWORLD) Memecoin Launch and Free Crypto Distribution | – | – |
INFORMATION
*The calendar is based on UTC (Coordinated Universal Time) time zone.
The economic calendar content on the relevant page is obtained from reliable news and data providers. The news in the economic calendar content, the date and time of the announcement of the news, possible changes in the previous, expectations and announced figures are made by the data provider institutions. Darkex cannot be held responsible for possible changes that may arise from similar situations.
MARKET COMPASS
Traditional markets are in the last trading day of the week and month. US markets, which were closed yesterday, will have a half-day session today, which may lead to low volumes in global markets in general.
In Asian stock markets, expectations that the Bank of Japan (BoJ) is a little closer to an interest rate hike are on the agenda after Tokyo’s higher-than-expected inflation data. The country’s currency Yen appreciated in line with this, drawing attention to the digital asset world. In China, the continent’s largest economy, there is talk of new economic incentives and new measures to be taken after the start of the Trump era in the US, especially for chip manufacturers. Within this picture, the mood in the Far East is generally positive. European stock markets are expected to start the new day with light sales while a number of economic indicators will be monitored.
After Trump’s election victory, the dollar, which appreciated with expectations about the policies to be implemented, eased slightly, while oscillating movements in digital currencies continue. Although we generally see rises in major cryptocurrencies, respite and minor corrections appear from time to time. Today, under the assumption that the volume of US transactions will remain low, we expect to see rises with intermediate corrections.
From the short term to the big picture.
The victory of former President Trump on November 5, which was one of the main pillars of our bullish expectation for the long-term outlook in digital assets, produced a result in line with our forecasts. In the aftermath, the president-elect’s appointments to Congress and the increased regulatory expectations for the crypto ecosystem in the US have maintained their place in our equation as a positive variable. Although Powell had cautious messages in his last speech, the continuation of the FED’s interest rate cut cycle, and the volume in BTC ETFs, institutional investor interest (in addition, MicroStrategy’s BTC purchases, Microsoft’s start to evaluate the purchase issue, BlackRock’s BTC ETF options start trading, etc.), pointing to an increase in institutional investor interest, supports our upward forecast for the big picture for now.
For the short term, given the nature of the market and pricing behavior, we think it would not be surprising to see occasional respite or pullbacks in digital assets. However, at this point, it would be useful to underline again that the fundamental dynamics continue to be bullish.
TECHNICAL ANALYSIS
BTC/USDT
In November, U.S. Bitcoin spot ETFs attracted a record $6.2 billion in inflows and a total of $30.38 billion in capital, fueled by Bitcoin’s historic rise. Bitcoin has more than doubled in value this year, outperforming other assets.
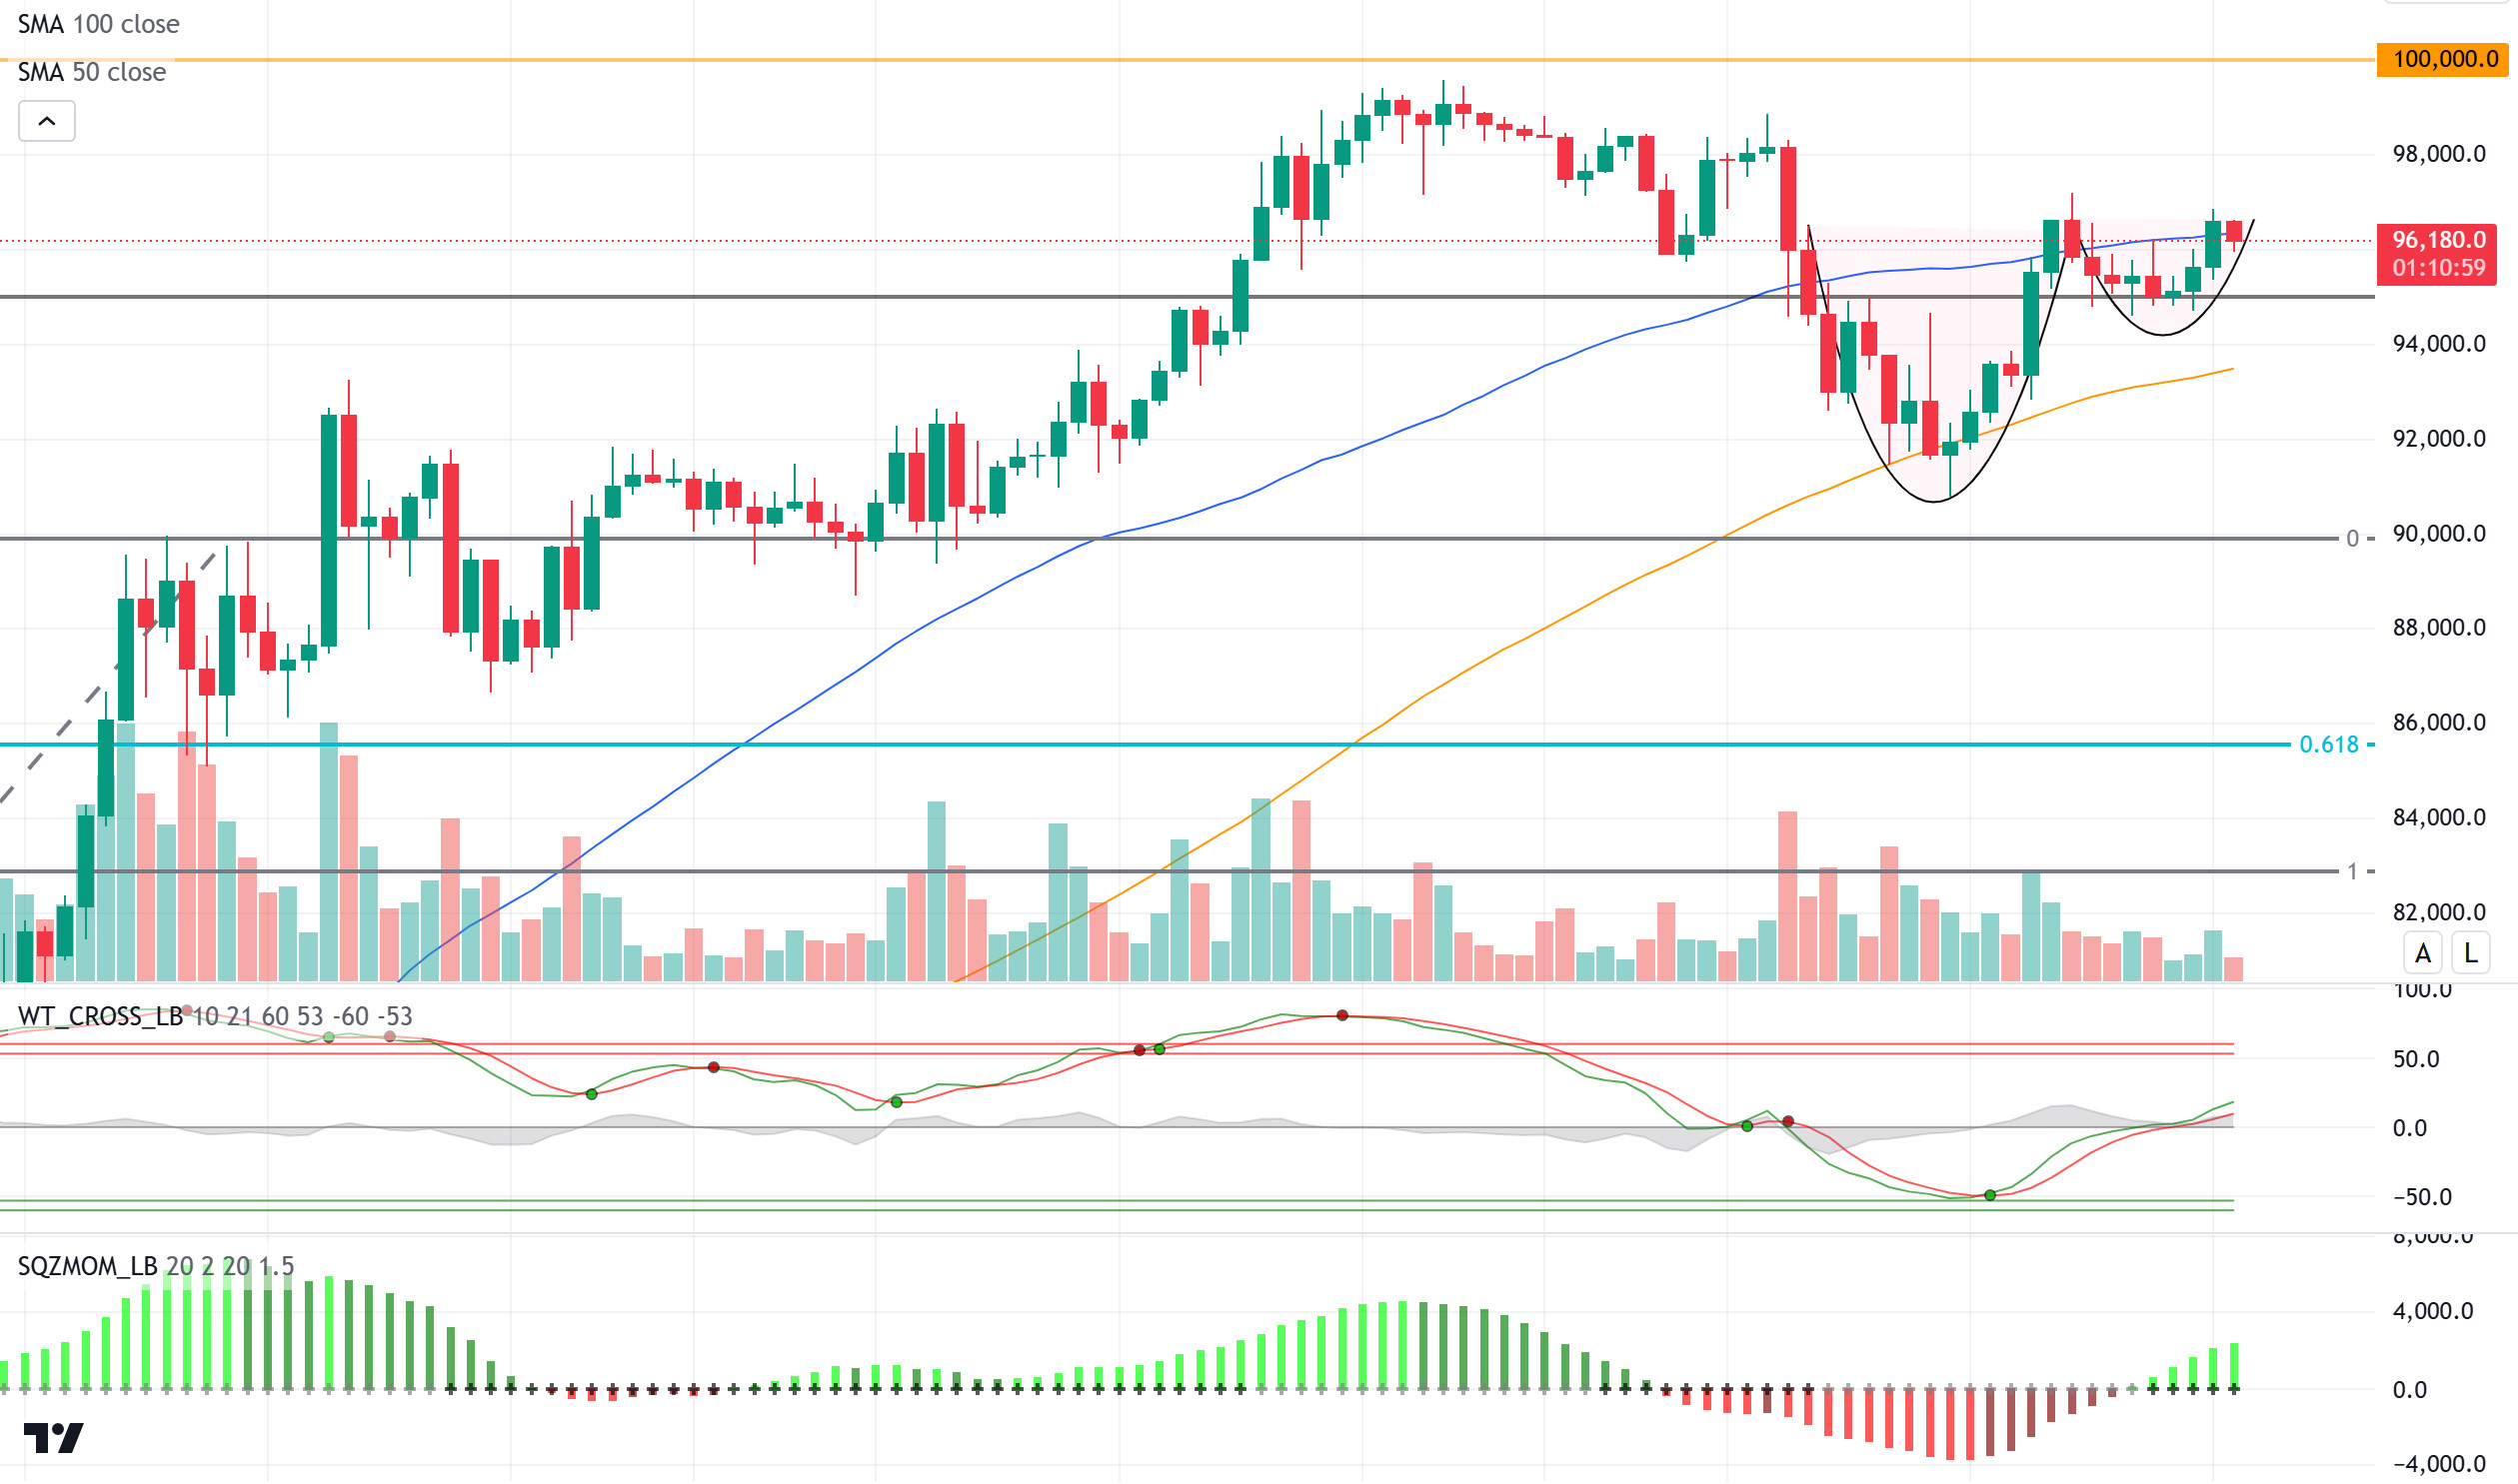
As BTC spot ETFs prepare for the monthly close, the technical outlook shows that the price is stuck between the 50- and 100-day SMA lines. Taking support from the 100-day SMA line below, BTC settled above the 95,000 resistance level. The price, which touched the 95,000 level from time to time, turned its direction upwards again with the operation of this point. The price, which is currently at 96,200, is testing the 50-day SMA line. In addition, the dish-handle pattern formed on the BTC 4-hour chart draws attention. While technical oscillators continue to maintain the buy signal, the momentum indicator is also in a supporting image. We can expect six-digit levels to be crossed in the upward movement of the price. In a possible pullback, we will follow the 95,000 level again.
Supports 95,000 – 92,500 – 90,000
Resistances 99,655 – 100,000 – 105,000
ETH/USDT
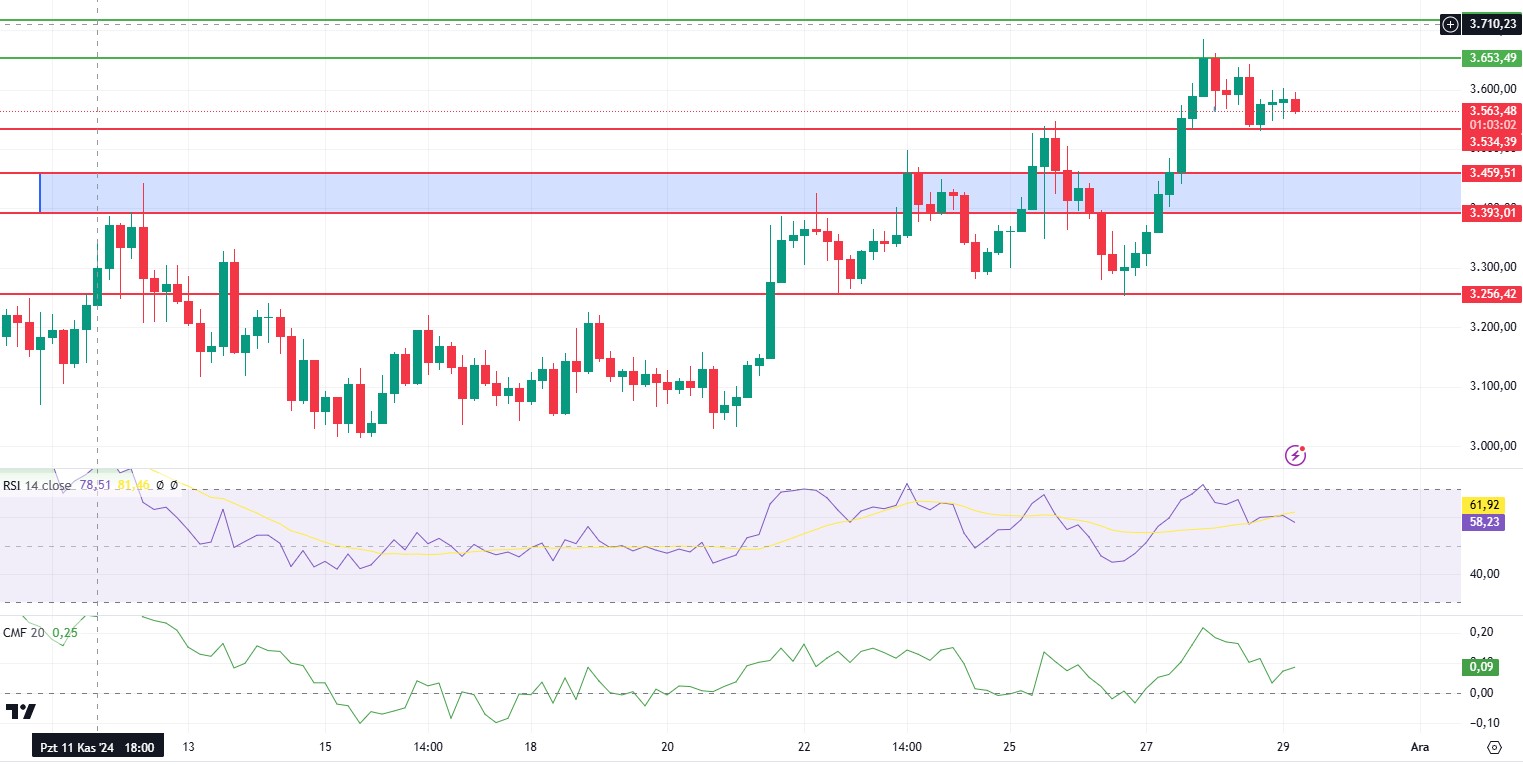
As mentioned in last night’s analysis, ETH fell to 3,534 with weakness in Chaikin Money Flow (CMF) and momentum. With the reaction it received from here, it has risen slightly and is moving horizontally. We see that CMF is heading up again and Relative Strength Index (RSI) is moving horizontally at 59. The weakening in momentum continues. Cumulative Volume Delta (CVD) shows balanced selling from spot and futures sides. It is also seen that the funding rate level has risen above 0.03 again. With all this data, breakouts can harden the movements for ETH, which we expect to move horizontally in the region between 3,653 – 3,534 levels during the day. The break of the 3,653 level may bring rises up to 3,717 – 3,839 levels, respectively. The break of the 3,534 level may cause pullbacks to the support zone indicated in blue on the chart.
Supports 3,534 – 3,459 – 3,256
Resistances 3,653- 3,717 – 3,839
XRP/USDT
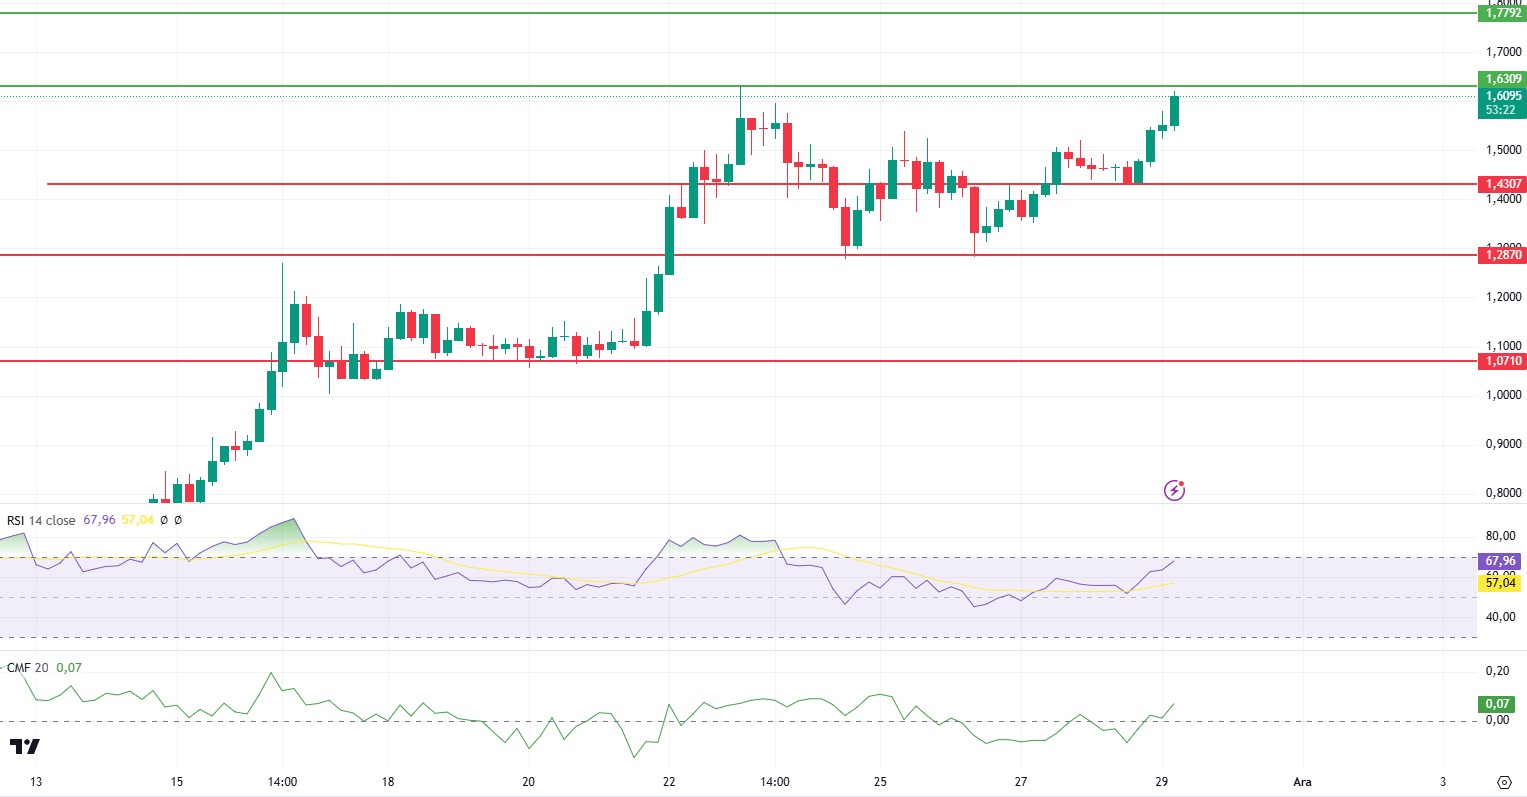
While XRP continues to accumulate after its recent rise, it is pushing the peaks again with the bullish wave that started yesterday evening. We can say that Chaikin Money Flow (CMF) and momentum have also turned positive again and are quite bullish. However, we see a negative divergence on the Relative Strength Index (RSI) during this move. We also see that the 1.63 level is a strong resistance. It can be said that the trend may continue upwards by exceeding this level. However, the negative divergence on the RSI may indicate that traders should be cautious and that corrections up to the 1.43 level are likely.
Supports 1.4307- 1.2870 – 1.0710
Resistances 1.6309 – 1.7792 – 1.9101
SOL/USDT
Coinglass reported that SOL’s Open Interest data decreased by 5.4% in the last 24 hours, indicating that investors are hesitant to create new positions. When we look at the movements of those holding large amounts of SOL in their wallets, we see that they are being transferred to centralized exchanges. This is a metric that usually signals bearishness. Indeed, when we look at the trading volume, it dropped by 17%.
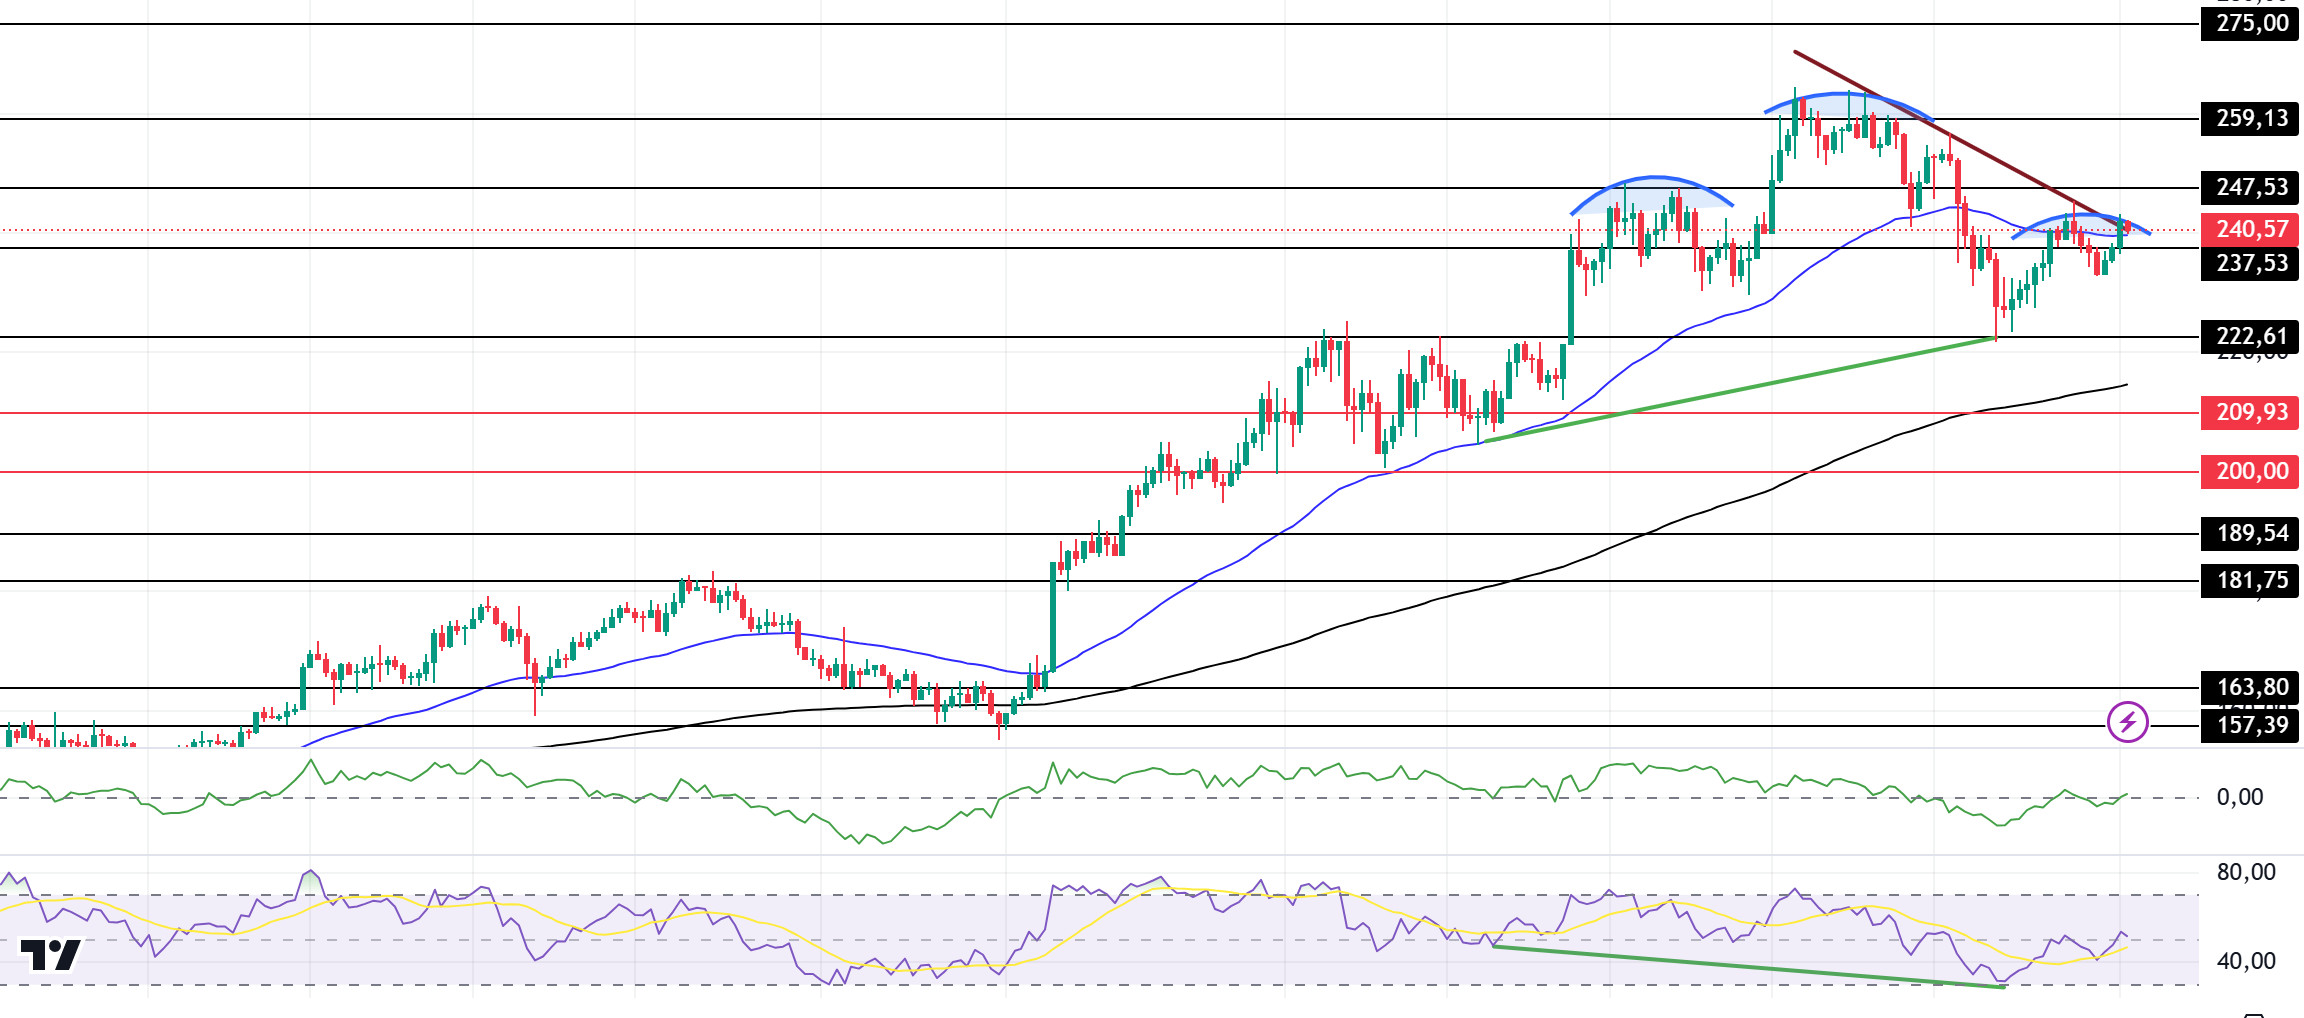
On the 4-hour timeframe, the 50 EMA (Blue Line) is above the 200 EMA (Black Line). Since November 22, SOL, which has been in a downtrend, continues its downward movement. However, when we examine the Chaikin Money Flow (CMF)20 indicator, money inflows maintain their balance. At the same time, Relative Strength Index (RSI)14 is moving from the overbought zone to the neutral level. However, there is a mismatch. This can be shown as a bullish signal. At the same time, a potential shoulder-head-shoulder pattern is on the chart. If it works, there could be a decline to 189.54. The 259.13 level is a very strong resistance point in the uptrend driven by both macroeconomic conditions and innovations in the Solana ecosystem. If it breaks here, the rise may continue. In case of retracements due to possible macroeconomic reasons or profit sales, support levels 222.61 and 189.54 may be triggered again. If the price reaches these support levels, a potential bullish opportunity may arise if momentum increases.
Supports 237.53 – 222.61 – 209.93
Resistances 247.53 – 259.13 – 275.00
DOGE/USDT
According to data from Santiment, DOGE’s Unrealized Profit and Loss (NPL) value has increased more than once, showing that the owners have separated with profits from recent earnings. This could lead to selling pressure.
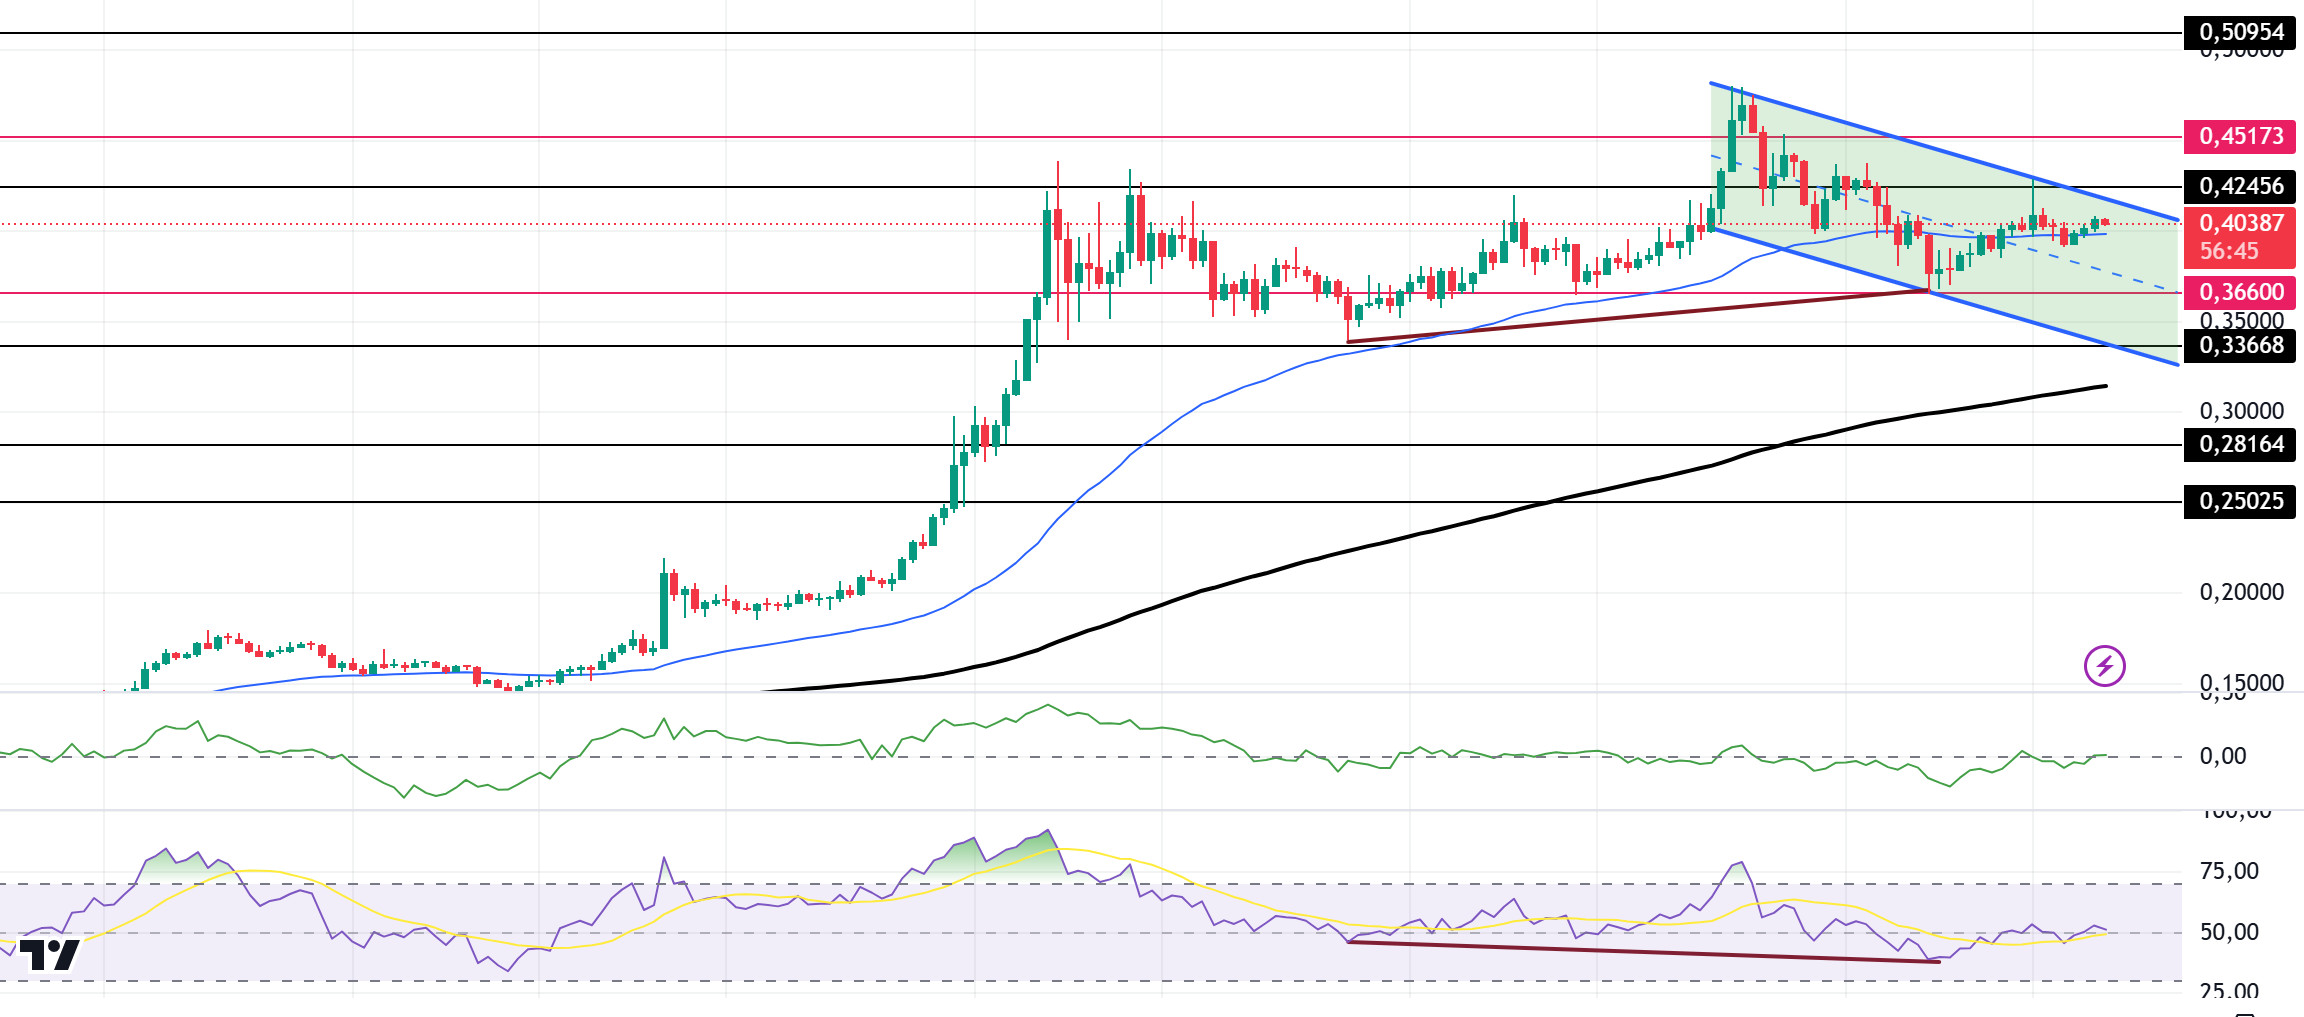
When we look at the chart, there is an upward mismatch between the Relative Strength Index (RSI) 14 and the chart. If the upward acceleration is strong, the 0.50954 level may be triggered. On the 4-hour timeframe, the 50 EMA (Blue Line) is above the 200 EMA (Black Line). But the gap between the two averages is still too wide. This may cause pullbacks. On the other hand, when we look at the RSI 14 indicator, it has moved from the overbought zone to the neutral level. However, when we examine the Chaikin Money Flow (CMF)20 indicator, it remains neutral. This shows us that money inflows and outflows are in balance. The 0.50954 level appears to be a very strong resistance point in the rises driven by both macroeconomic conditions and innovations in the Doge coin. If DOGE maintains its momentum and rises above this level, the rise may continue strongly. In case of retracements due to possible macroeconomic reasons or profit sales, the support levels of 0.36600 and 0.33668 can be triggered again. If the price hits these support levels, a potential bullish opportunity may arise if momentum increases.
Supports 0.36600 – 0.33668 – 0.28164
Resistances 0.42456 – 0.45173 – 0.50954
LEGAL NOTICE
The investment information, comments and recommendations contained herein do not constitute investment advice. Investment advisory services are provided individually by authorized institutions taking into account the risk and return preferences of individuals. The comments and recommendations contained herein are of a general nature. These recommendations may not be suitable for your financial situation and risk and return preferences. Therefore, making an investment decision based solely on the information contained herein may not produce results in line with your expectations.


