MARKET SUMMARY
Latest Situation in Crypto Assets
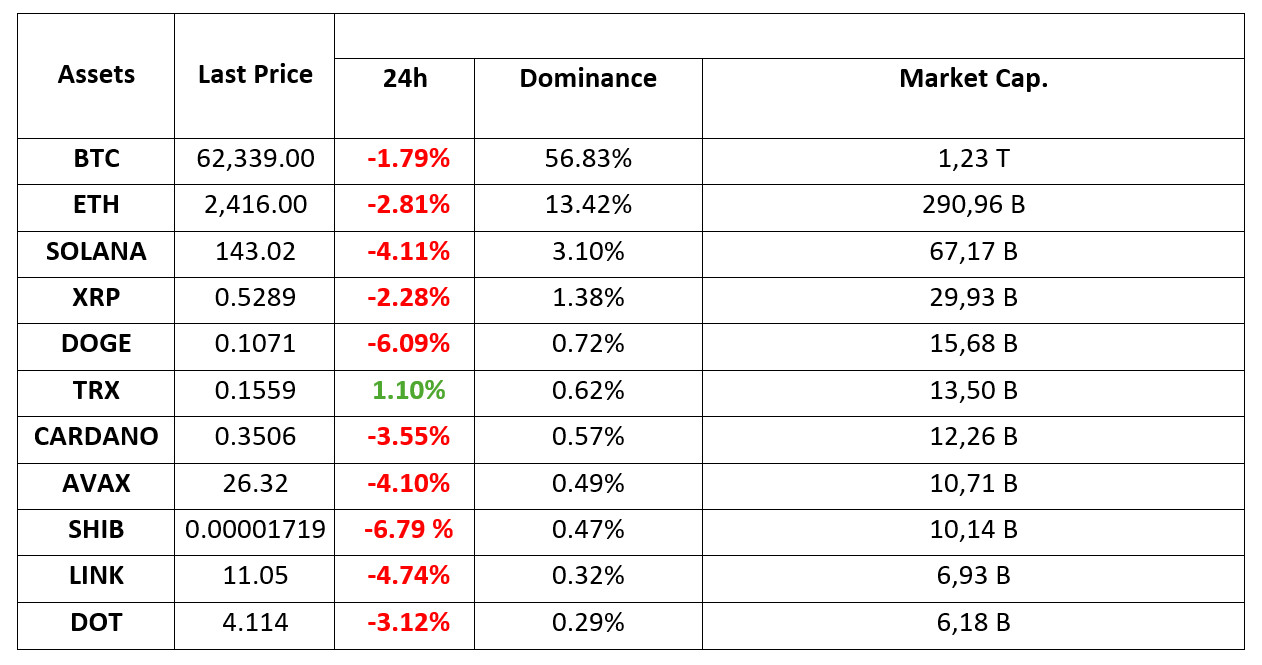
*Prepared on 10.8.2024 at 06:00 (UTC)
WHAT’S LEFT BEHIND
FTX Bankruptcy Plan Approved
A US court has approved FTX’s bankruptcy plan, paving the way for refunds to aggrieved investors. The proceeds from the sale of assets will be distributed to debtors. Thus, the process will begin and $ 16 billion will be paid. In the payment plan, 98% of the creditors are expected to receive at least 118% of their claims in cash.
Bitcoin Spot ETF
US spot bitcoin exchange traded funds reported net inflows of $235.19 million on Monday, extending their streak of positive flows to two days. Fidelity’s FBTC recorded the largest daily inflows among the 12 ETFs, with inflows of $103.68 million on Monday, according to SoSoValue data.
Finance Giant BlackRock
BlackRock says the pace of cryptocurrency adoption is faster than the internet and cell phones. The growth in the company’s spot Bitcoin and Ethereum ETFs reflects the interest of large funds in cryptocurrencies. Bitcoin and Ethereum’s place in the financial world is growing stronger.
HIGHLIGHTS OF THE DAY
Important Economic Calender Data
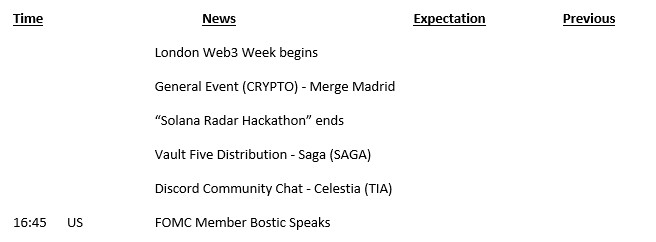
INFORMATION:
*The calendar is based on UTC (Coordinated Universal Time) time zone. The economic calendar content on the relevant page is obtained from reliable news and data providers. The news in the economic calendar content, the date and time of the announcement of the news, possible changes in the previous, expectations and announced figures are made by the data provider institutions. Darkex cannot be held responsible for possible changes that may arise from similar situations.
MARKET COMPASS
Global markets continue to rebalance their positions after last week’s better-than-expected US employment data. While the dollar index held on to its recent gains, it declined slightly and the country’s bond yields are in a similar situation. On the other hand, Chinese stock markets saw sharp pricing on the return from the holiday. Statements by China’s National Development and Reform Commission (NDRC) did not meet market expectations and Chinese indices saw significant volatility. Digital assets also gave back some of their gains as the news from the Middle East did not disrupt the recent positive market ecosystem.
Expectations that the world’s second largest economy would continue to be supported by further stimulus were not met by the NDRC. In this parallel, the risk appetite brought by the mood created by the US employment data seems to have been somewhat dampened. Although a day of inflows to Bitcoin ETFs was left behind, the markets’ desire to take some money off the table with the developments in Asia (expectations for the NDRC and the statements did not meet market expectations) led to pressure. Moreover, the perception that there are significant opportunities in Chinese equity markets also seems to be weighing on digital assets, leading to position adjustments for the period ahead and sharp losses in Hong Kong’s Hang Seng index. It is rumored that some investors on the continent are using Hong Kong stock markets and some assets as a funding vehicle to buy stocks in China.
In the new day, we expect to see a rebound in digital assets and a limitation in declines. Although European and US futures contracts indicate that stock markets are on the negative side, indicating that the markets’ appetite for risk is weakening, we believe that the gap below is narrower than the potential above in major digital assets.
Click here to review our report “Eyes on Inflation After Strong Employment Data”.
TECHNICAL ANALYSIS
BTC/USDT
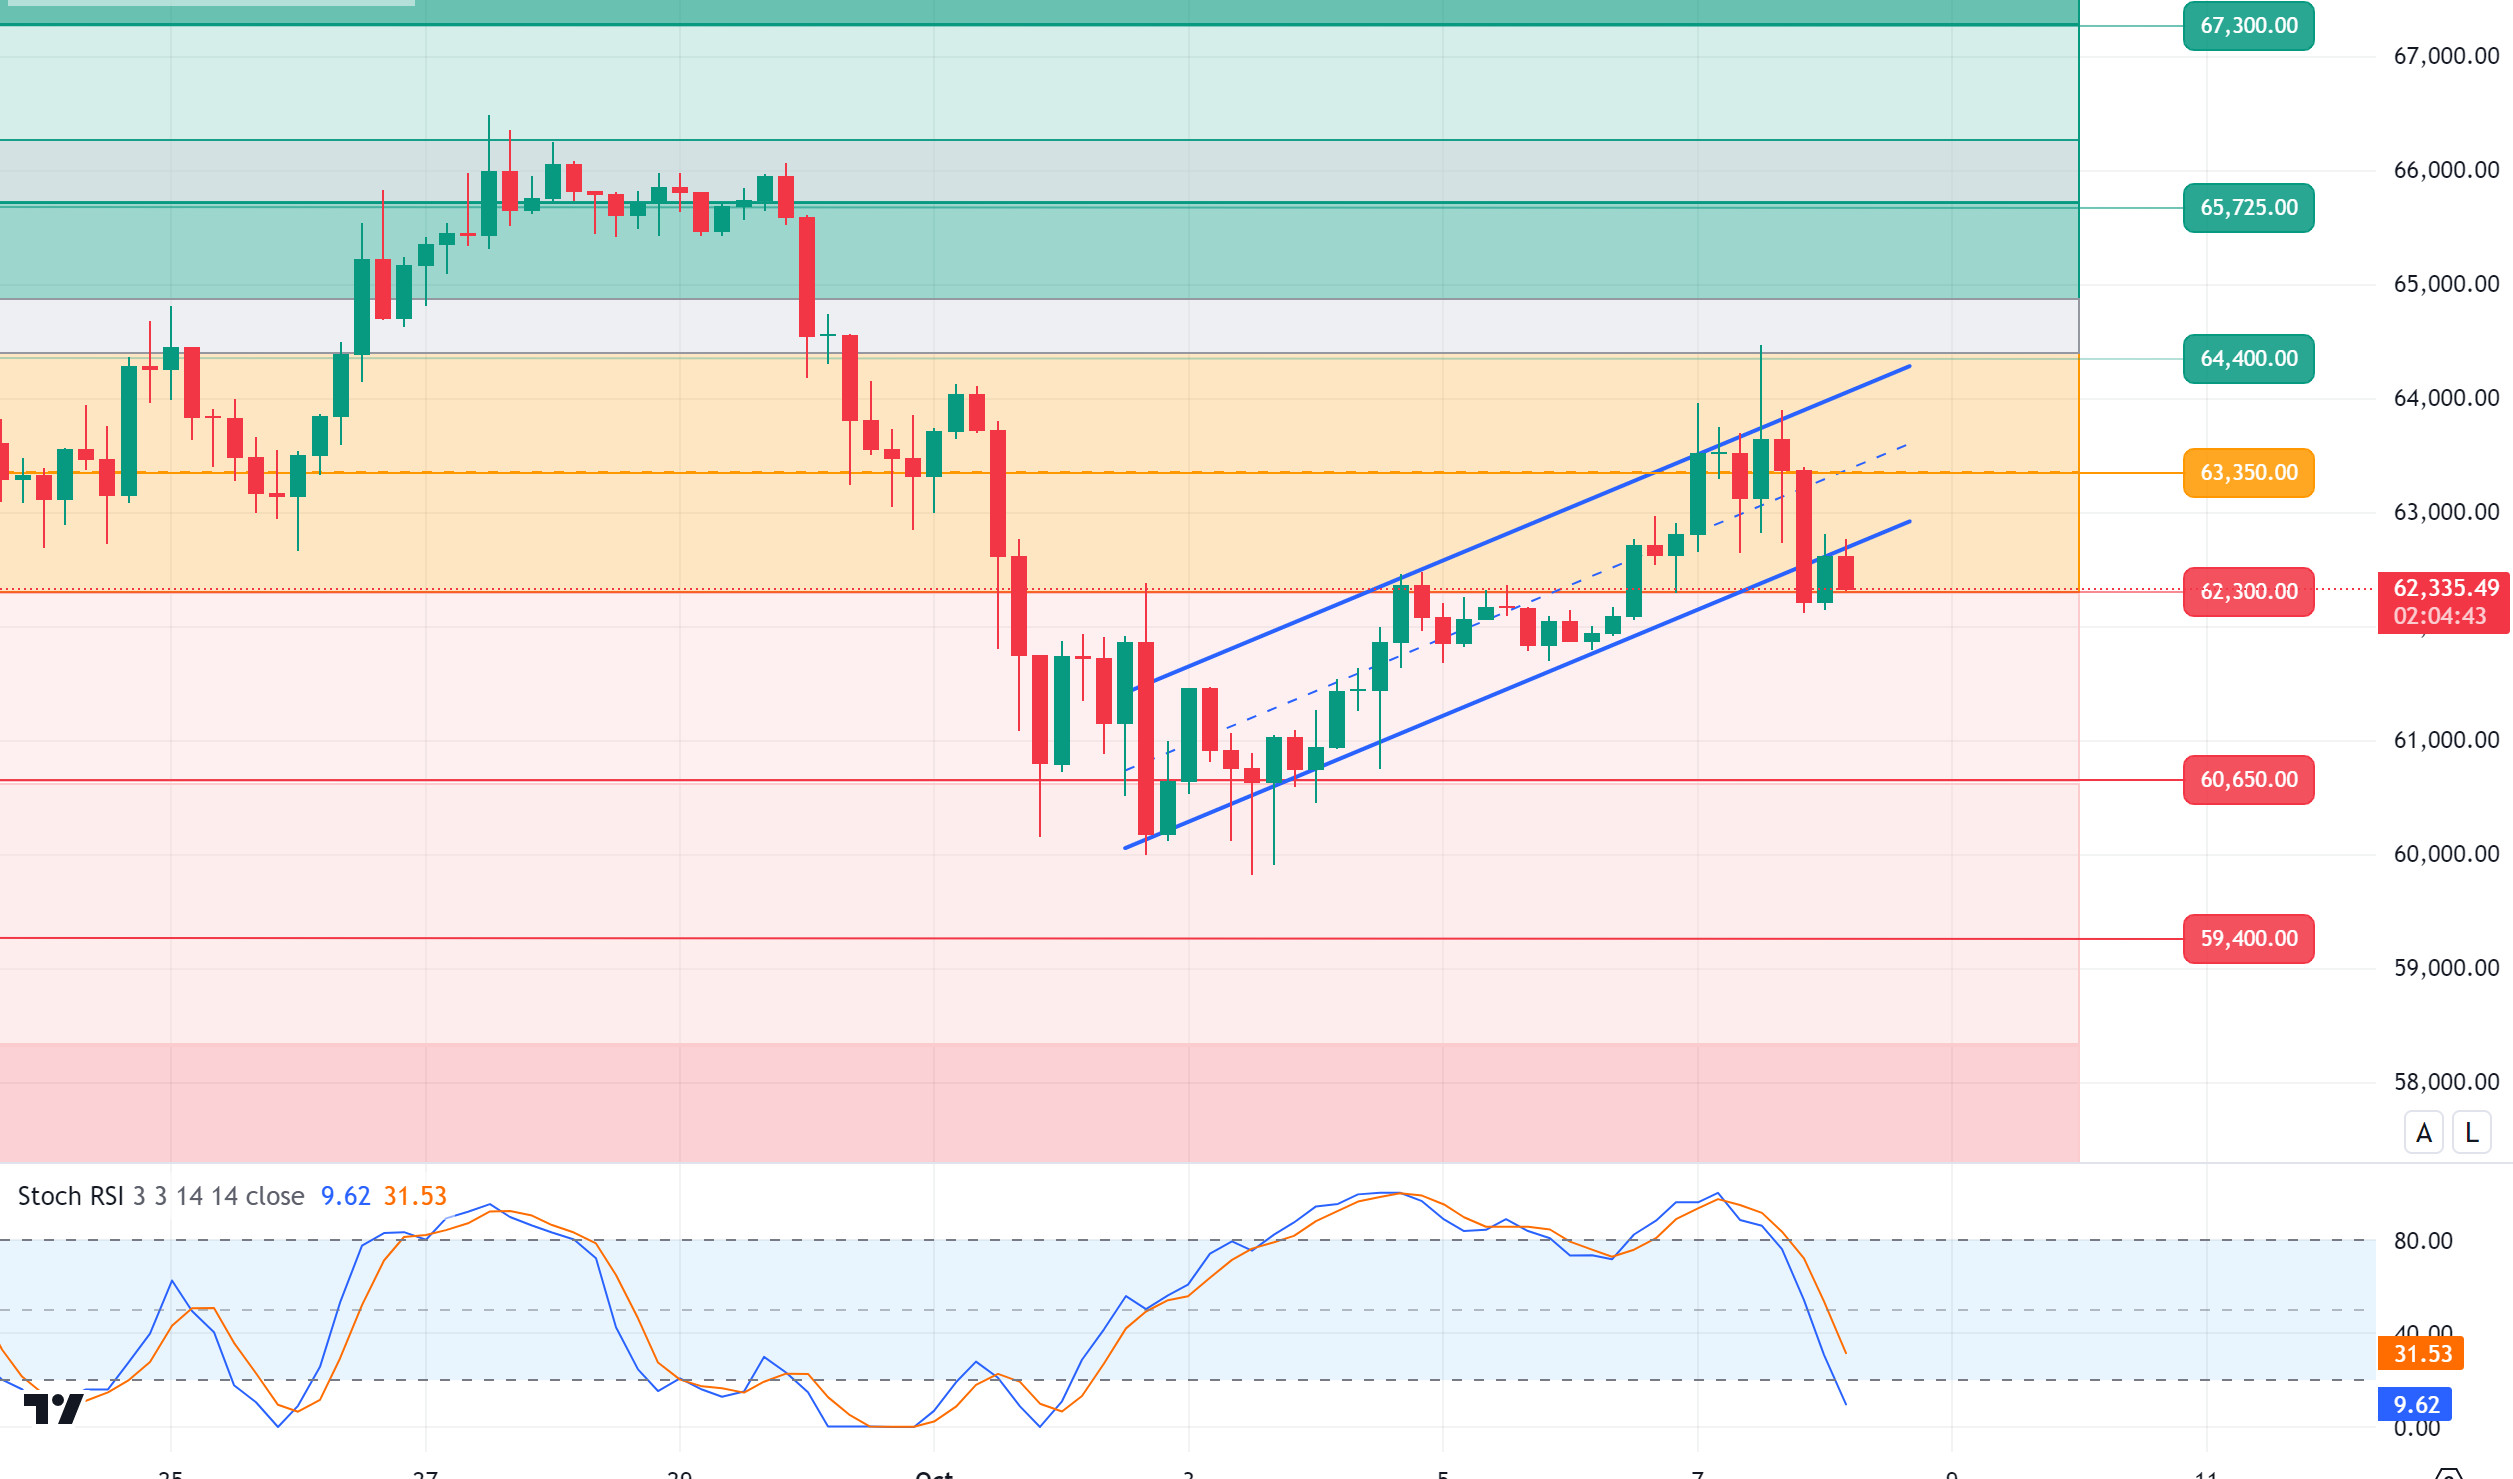
Bitcoin is fluctuating! The long-standing correlation between the US stock market and Bitcoin was reversed yesterday, albeit briefly. During the pullback in US stocks, Bitcoin rallied on an upward move, testing the $64,400 level. The strong relationship between MicroStrategy shares and Bitcoin investments may be behind Bitcoin’s rise despite the decline in stocks. In particular, MicroStrategy’s stocks have shown a positive divergence with a significant increase while the indices have declined. In addition, another important factor affecting the Bitcoin price was the approval of FTX’s bankruptcy plan. While this development caused a recovery in the markets, Bitcoin briefly rallied, but then fell again. If we look at the BTC 4-hour technical analysis, BTC, which exhibits volatile movements within the ascending channel, broke upwards towards the 64,400 level, but retreated by not being permanent at this level. With the minor support level of 63,350 being crossed downwards, it brought a trend towards the next major support level of 62,300. Although it is thought that the “Uptober” period started with yesterday’s rise, the ongoing tensions in the Middle East increase the possibility of fluctuations on the Bitcoin price. In this environment of uncertainty, it may be highly likely to see significant effects on Bitcoin’s future movements. If the declines deepen with a negative development in the news flow during the day, the break of the 62,300 support point in BTC may bring the 60,650 levels to the agenda again. Otherwise, the 64,400 level can be targeted with the operation of this level and the realization of pricing in the rising channel again.
Supports 62,300 – 60,650 – 59,400
Resistances 64,400 – 65,750 – 67,300
ETH/USDT
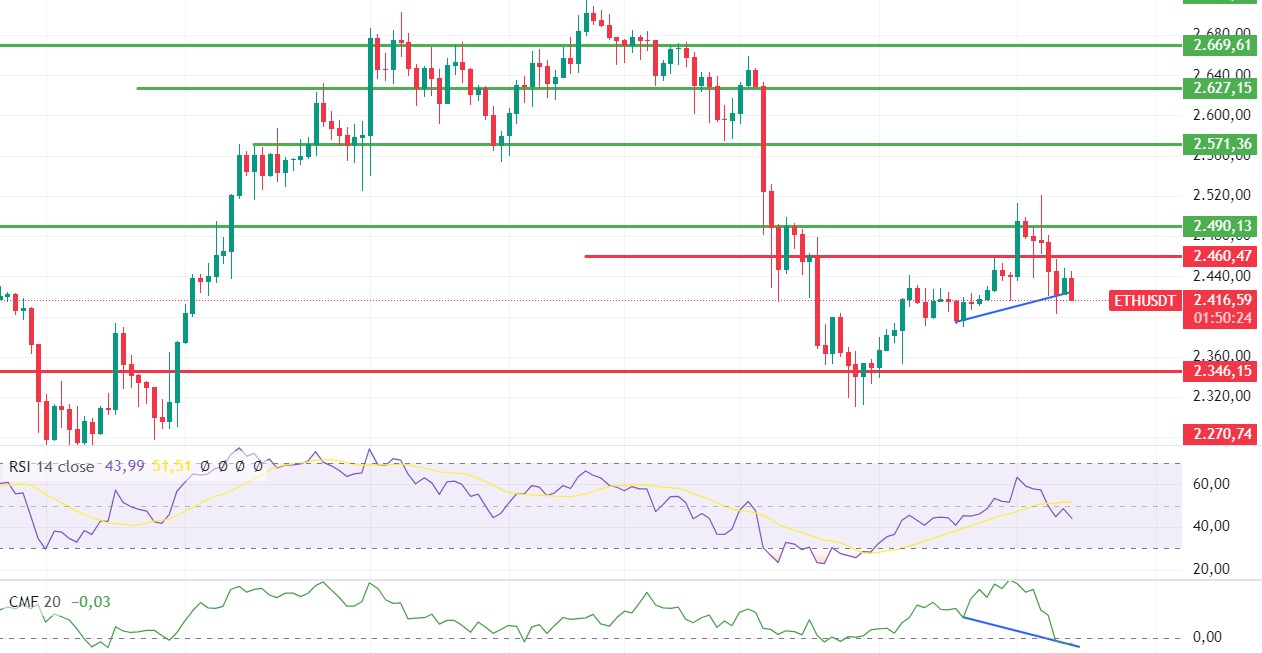
Ethereum experienced a rapid decline to 2,400 levels with the loss of the 2,460-level yesterday evening. It is trying to hold on to 2,420 levels by taking a reaction from this level. We see that a positive mismatch has formed on CMF and a reversal signal has been formed. After the negative mismatch in RSI is also eliminated, slight rises can be expected during the day. Looking at the open interest, we see that open positions were closed during the decline and new positions were opened at the 2,400 level. CVDs are moving equally from futures and spot channels. With this data, it can be said that the slightly positive outlook continues unless the 2,400 level is lost. The regain of the 2,460 level may bring rises up to 2,510 levels. The break of 2,400 support may bring declines up to 2,346.
Supports 2,400 – 2,346 – 2,270
Resistances 2,460 – 2,490 – 2,510
LINK/USDT
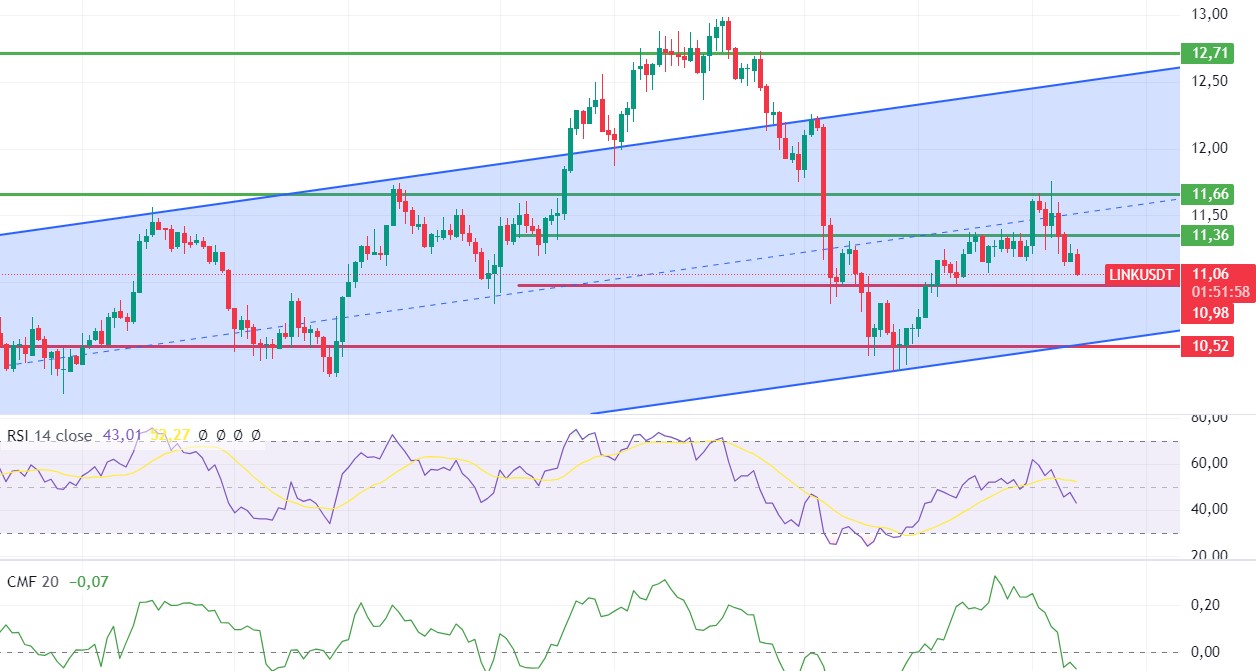
LINK fell in the evening hours, losing the 11.36 level, falling to the kumo cloud bottom support and trying to hold on at this level. Negative structures in RSI and CMF indicate that the loss of cloud support may bring deep declines. Especially with the loss of the 10.98 level, declines up to 10.52 levels can be seen. If there is a reaction from this level, there may be a movement towards 11.36 levels again during the day.
Supports 10.98 – 10.52 – 9.89
Resistances 11.36 – 11.66 – 12.71
SOL/USDT
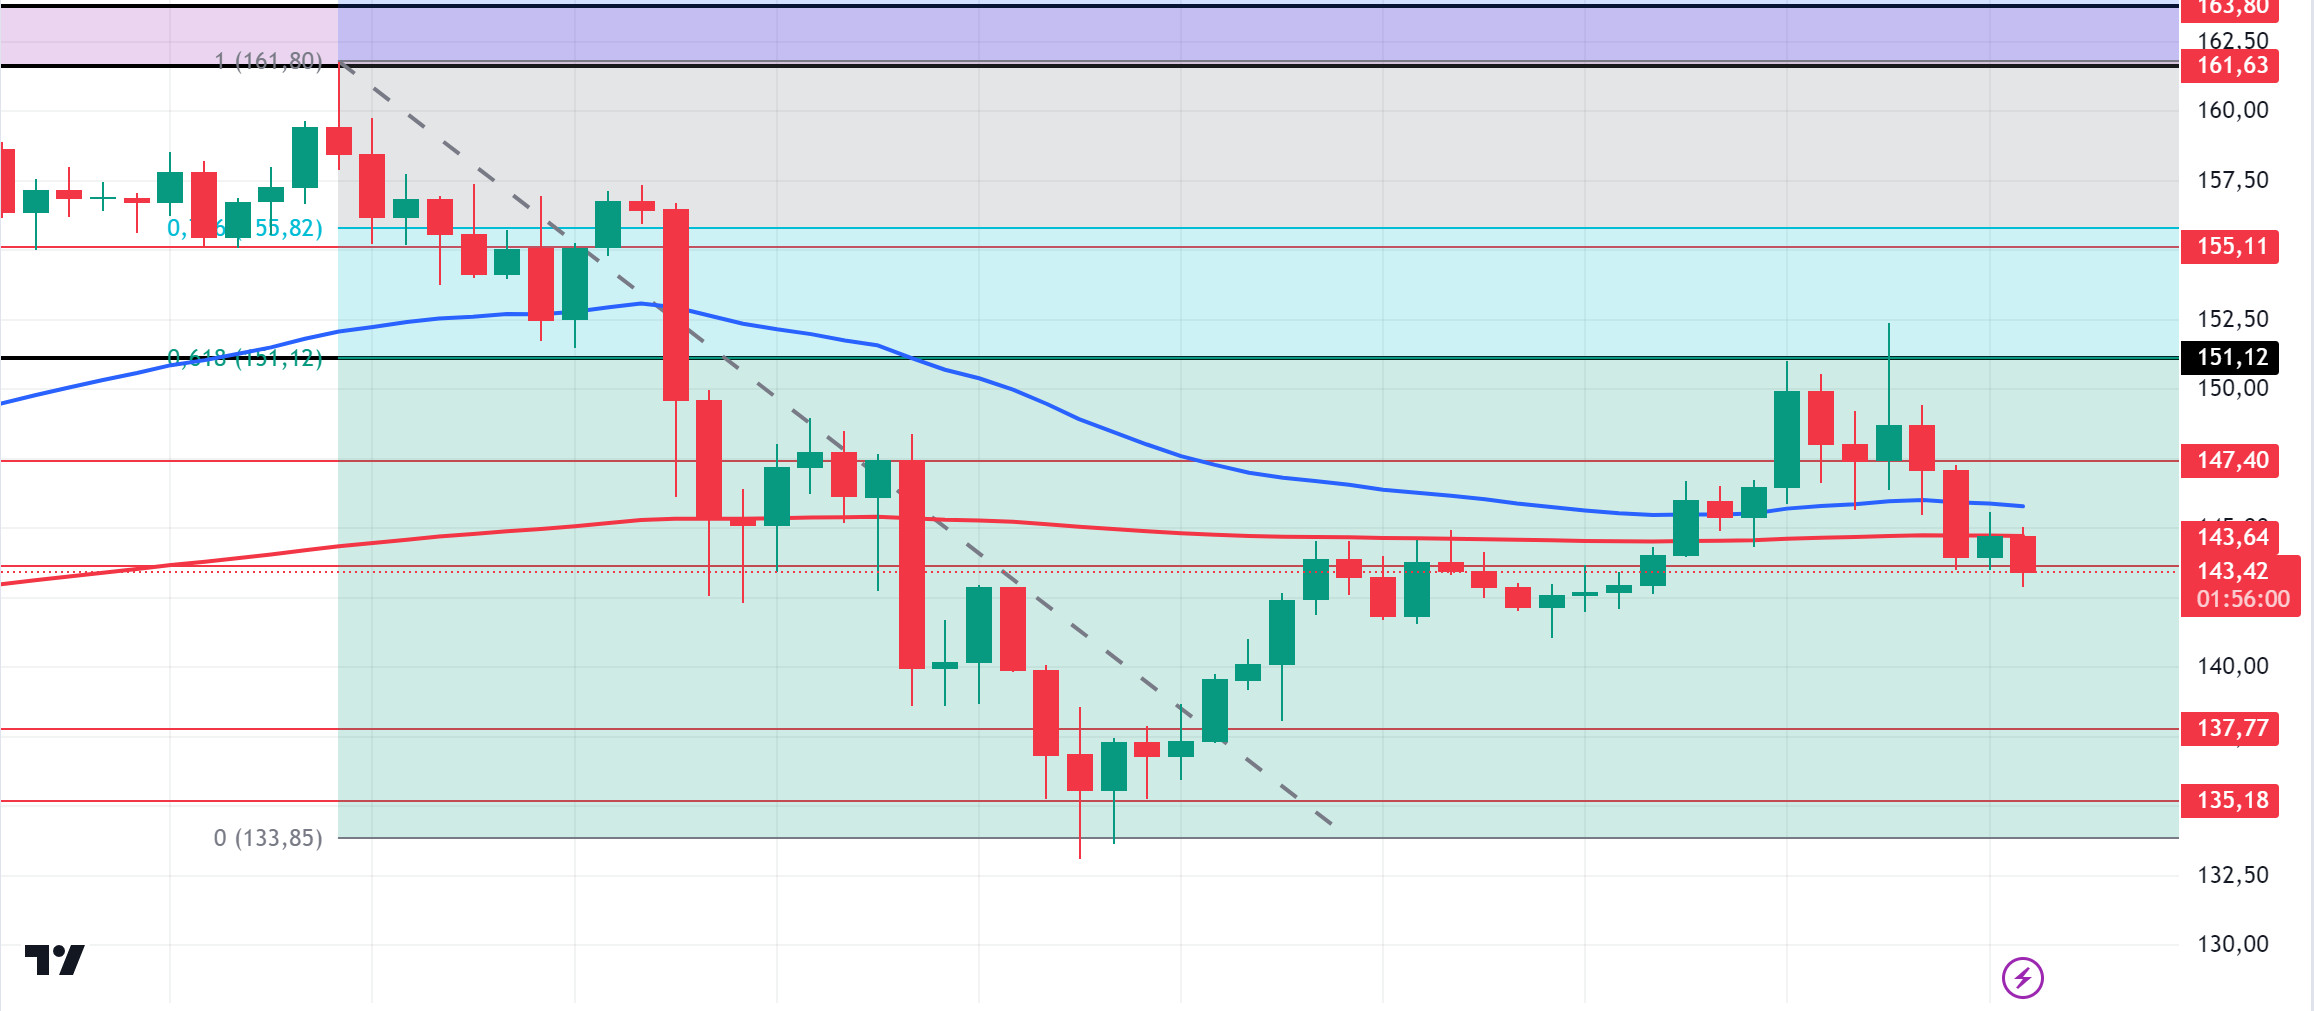
The American elections are just around the corner. According to data from Polymarket, the probability of Trump’s election has increased to 53%. It is rumored that Robinhood’s Chief Legal Officer is considering Robinhood’s Chief Legal Officer for the Department of Security if President-elect Trump is elected. In the Solana ecosystem, decentralized exchanges are experiencing unprecedented dynamism led by Solana. The Solana network hosts 87% of new tokens in different networks. This shows the importance and trust in the Solana ecosystem. In a new report by Messari Research, Solana projects generated a staggering $173 million in pre-sale rounds in the third quarter of 2024. This marks an achievement that represents the highest quarterly funding total for Solana since Q2 2022. Technically, the price has been accumulating in the 127.17 – 161.63 band since August 8. It encountered resistance at 0.618 (151.12), the Fibonacci retracement. After this resistance, SOL lost 5.41%. On the 4-hour chart, the 50 EMA seems to have received support from the 200 EMA. The 151.12 level appears as a place of resistance in the rises driven by both macroeconomic conditions and innovations in the Solana ecosystem. If it rises above this level, the rise may continue. In the sales to be made by investors due to political and macroeconomic conditions, the support levels of 143.64 – 137.77 should be followed. If the price comes to these support levels, a potential bullish opportunity may arise.
Supports 143.64 – 137.77 – 135.18
Resistances 147.40 – 151.12 – 155.11
ADA/USDT
The American elections are just around the corner. According to data from Polymarket, the probability of Trump’s election has increased to 53%. It is rumored that Robinhood’s Chief Legal Officer is being considered for the Department of Security seat if President-elect Trump is elected. Cardano CEO Charles Hoskinson continues to claim that Cardano is the “No. 1” blockchain despite its recent poor performance. Hoskinson made these bold claims in several recent X posts, confirming that the popular proof-of-stake blockchain is still “#1” and attributing this to a significant advantage in decentralized governance compared to other blockchains. According to the Global In/Out of Money (GIOM), approximately 373,000 addresses controlling 5.21 billion ADA are currently at a loss. These addresses cost their holdings at an average price of 0.3700. In this context, it appears that many traders are not willing to sell before their investments rise above this level, creating a strong supply zone that could prevent rallies above 0.3900. Technically, on the 4-hour chart, the 50 EMA has broken the 200 EMA to the downside. This could be a sign that the decline in ADA could deepen. On the other hand, when we look at the Fibonacci retracement, the retracement of the decline that started on September 27 has met resistance at the fibonacci value of 0.382 (0.3651). The 0.3469 level stands out as a strong support in the pullbacks to be experienced with possible political and macroeconomic news. If the positive mood in the ecosystem continues, the 0.3651 level should be followed as a strong resistance.
Supports 0.3469 – 0.3301 – 0.3228
Resistances 0.3596 – 0.3651 – 0.3724

AVAX/USDT
AVAX, which opened yesterday at 26.93, fell by approximately 1.5% during the day and closed the day at 26.56. There is no planned data coming from the US today. Therefore, it may be a day when price movement will be limited. News flows from the Middle East will be important for the market.
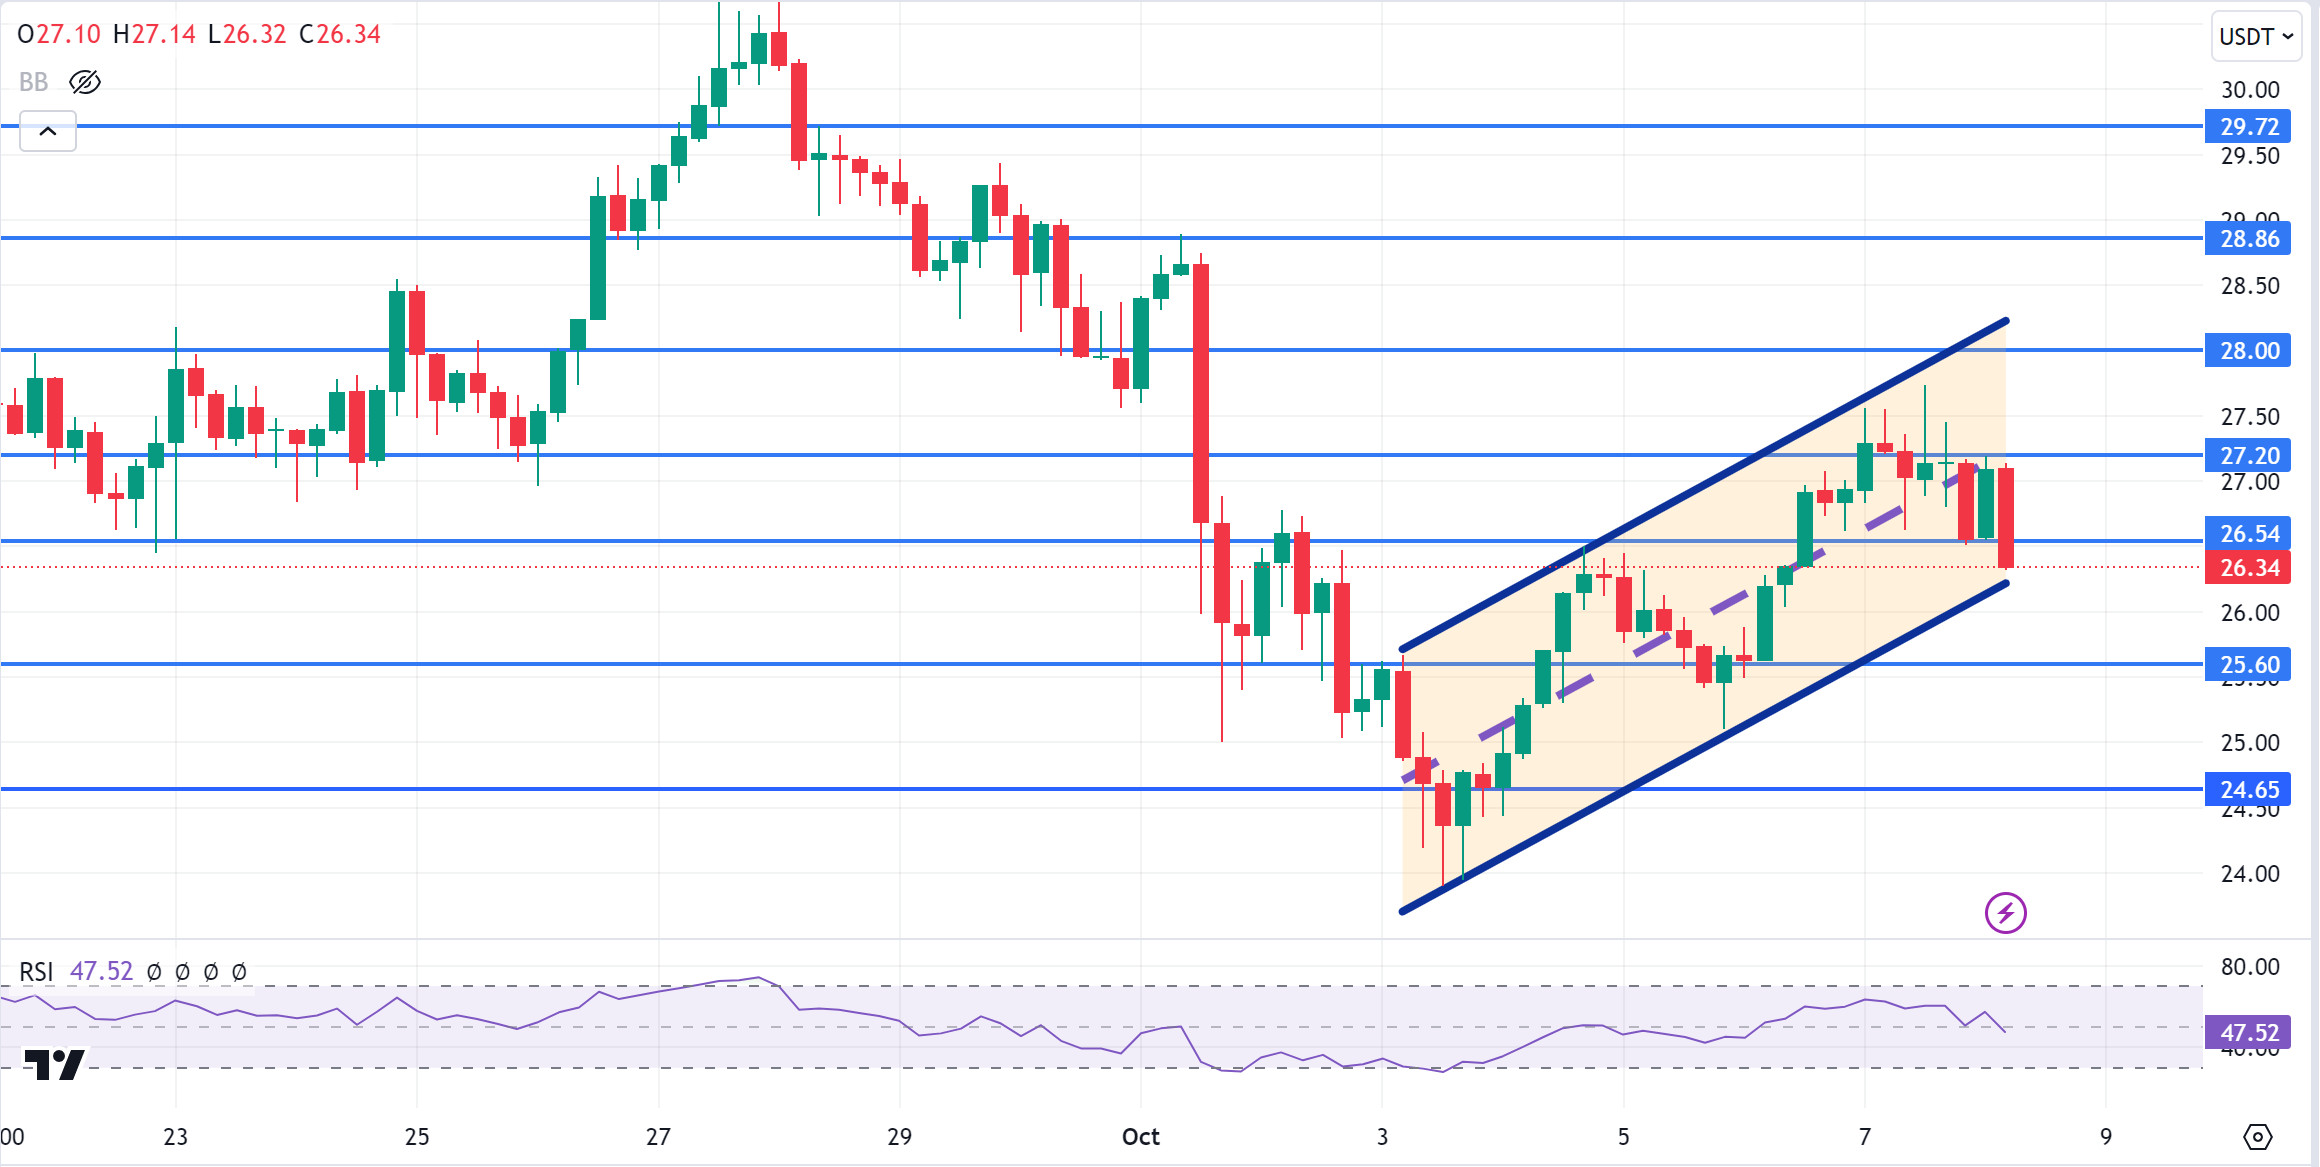
AVAX, currently trading at 26.34, is moving within the ascending channel on the 4-hour chart. It is in the lower band of the ascending channel and can be expected to rise slightly from these levels with the RSI 47 value. In such a case, the channel may move to the middle band and test the 27.20 resistance. In case of news of increasing tension in the Middle East, sales may increase and test 25.60 support. As long as it stays above 24.65 support during the day, the desire to rise may continue. With the break of 24.65 support, sales may increase.
Supports 26.54 – 25.60 – 24.65
Resistances 27.20 – 28.00 – 28.86
TRX/USDT
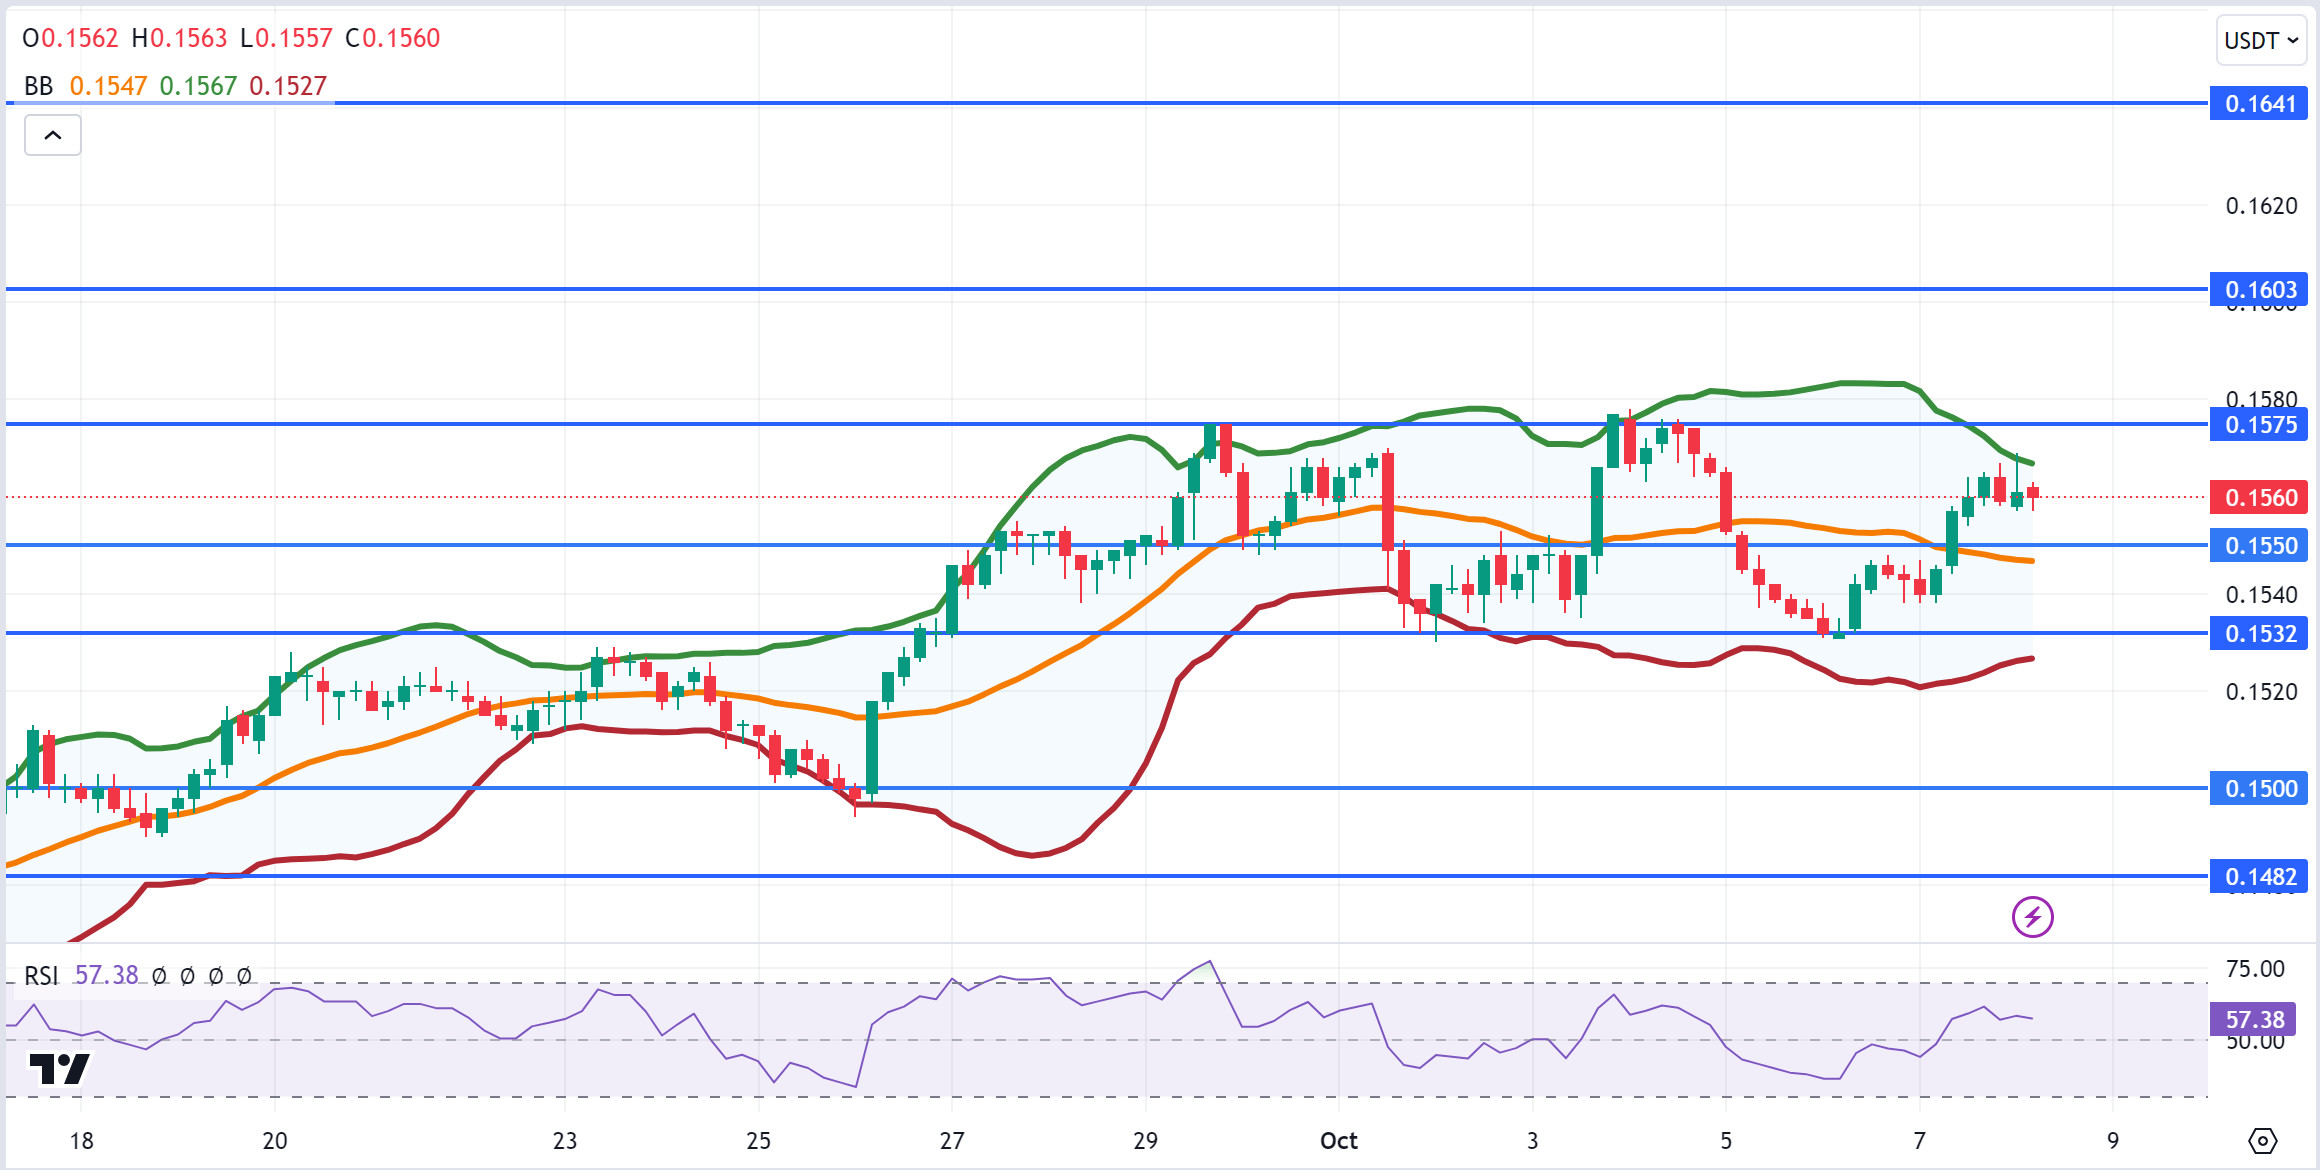
TRX, which started yesterday at 0.1543, rose 1% during the day and closed the day at 0.1559. There is no scheduled data expected to affect the market today. The market will be closely following the news flows regarding the tension in the Middle East. TRX, which is currently trading at 0.1560, is moving downwards towards the Bollinger mid-band on the 4-hour chart and can be expected to decline a little more from its level with an RSI value of 57. In such a case, it may move to the Bollinger middle band and test the support at 0.1550. If the tension in the Middle East decreases, it may test 0.1575 resistance with future purchases. As long as TRX stays above 0.1482 support, the desire to rise may continue. If this support is broken downwards, sales can be expected to increase.
Supports 0.1550 – 0.1532 – 0.1500
Resistances 0.1575 – 0.1603 – 0.1641
XRP/USDT
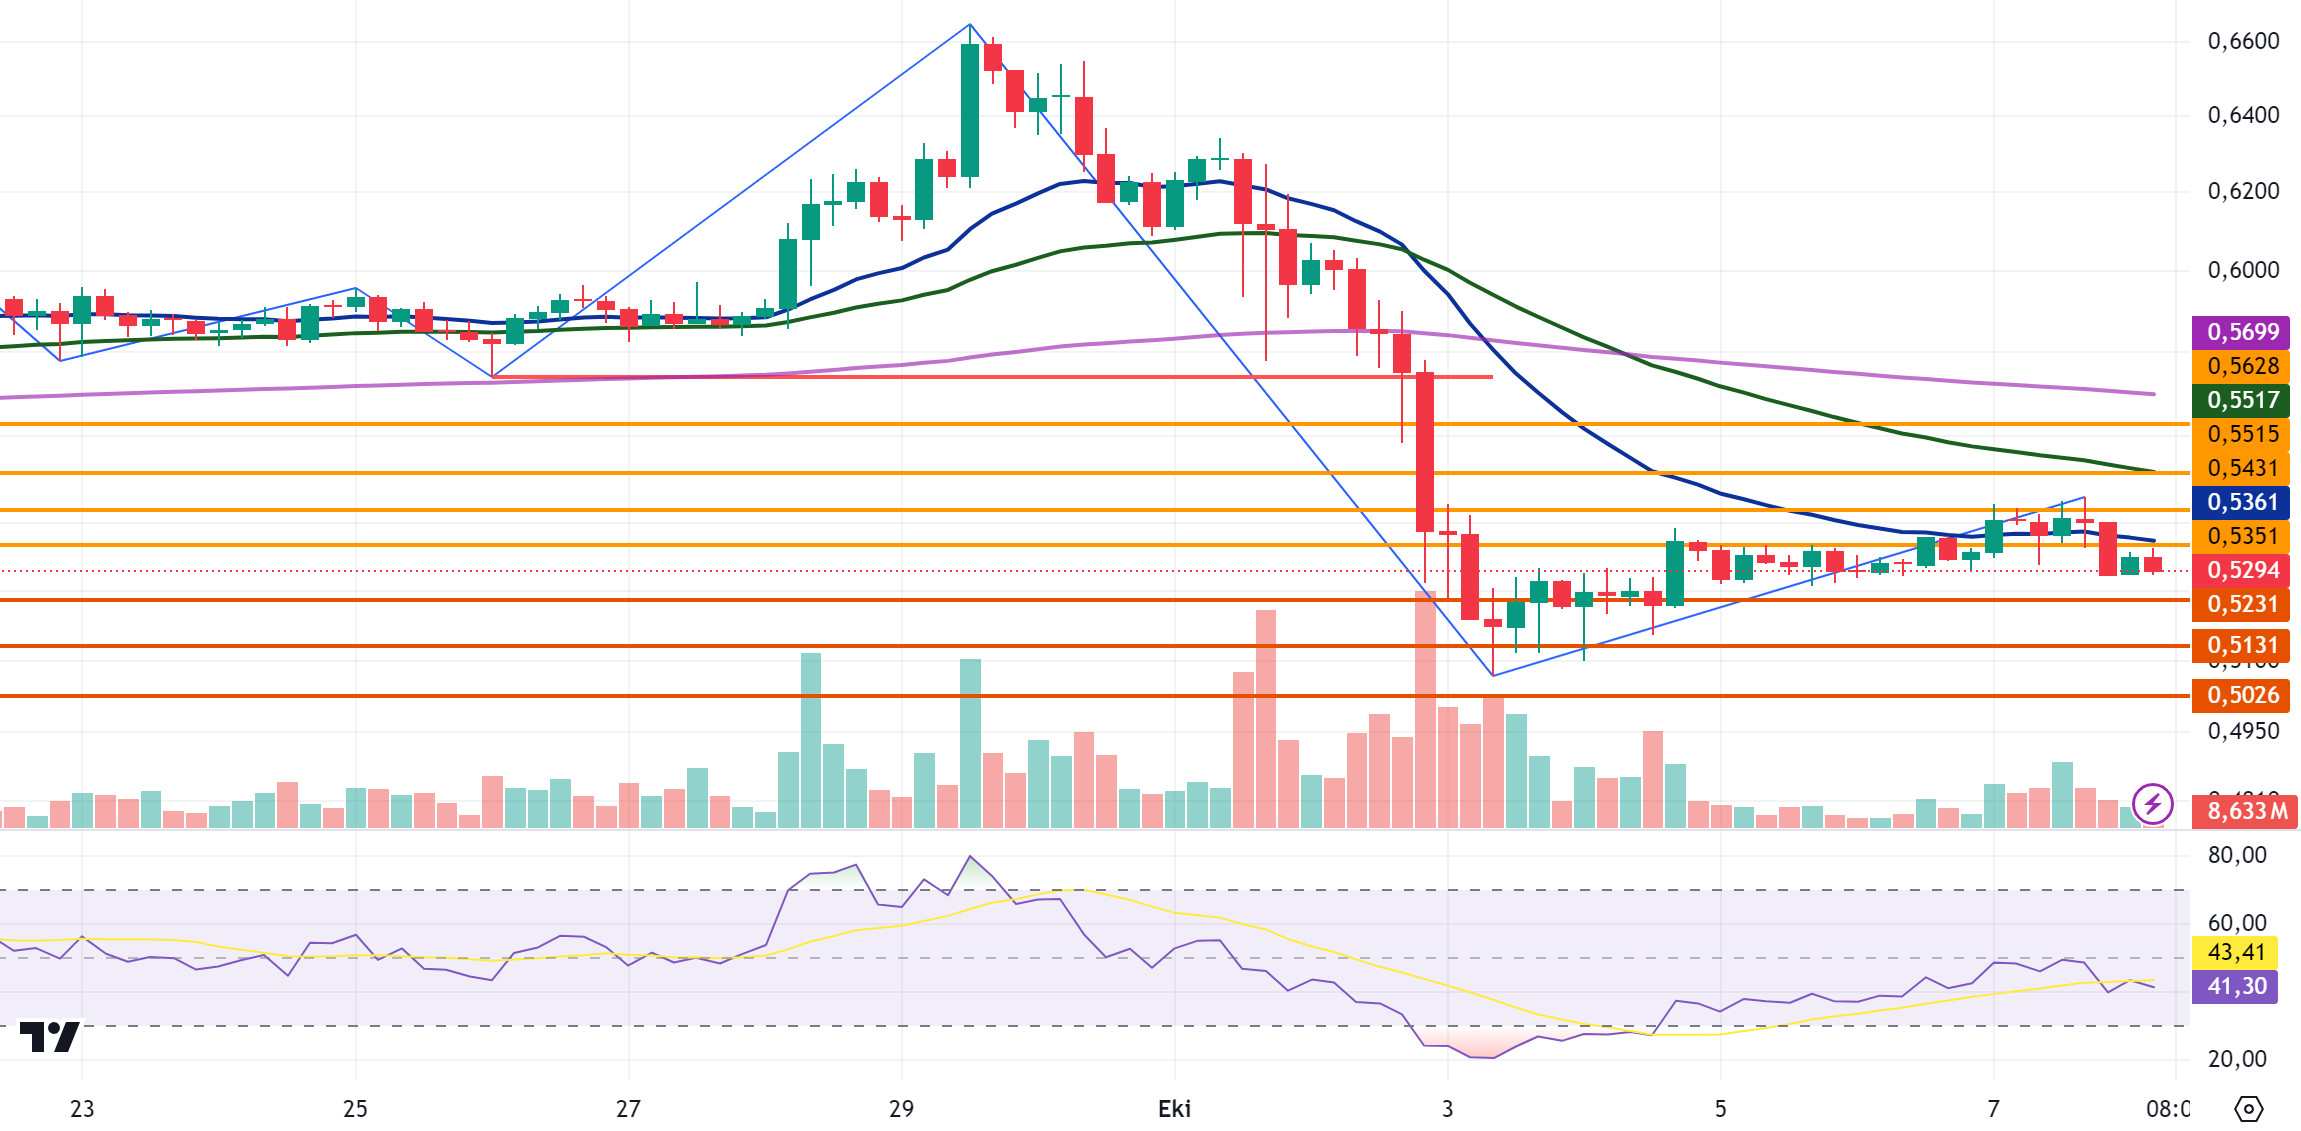
XRP closed the day at 0.5282 with a 1% depreciation yesterday. In the 4-hour analysis, it fell with the EMA20 and the sell-off at 0.5351 in its rise today and continues to trade at the start of the day. The RSI (14) value is at 41.3 and this data shows that it is neither overbought nor oversold and may continue to move in a neutral horizontal band. XRP, which fell with a sell-off at the EMA20 level in its rise, is below the EMA levels in the 4-hour analysis and this may cause selling pressure. In case of a decline with the formation of selling pressure, it may test the support levels of 0.5231-0.5131-0.5026 with its decline. If it rises with positive developments for the crypto market and XRP, it may test the resistance levels of 0.5351-0.5431-0.5515.
XRP, which continues to be traded in a horizontal band, may decline with possible sales at 0.54 in its rise and may offer a short trading opportunity. In its decline, it may rise with purchases that may come at 0.52 and may offer a long trading opportunity.
EMA20 (Blue Line) – EMA50 (Green Line) – EMA200 (Purple Line)
Supports 0.5231 – 0. 5131 – 0.5026
Resistances 0.5351 – 0.5431 – 0.5515
DOGE/USDT
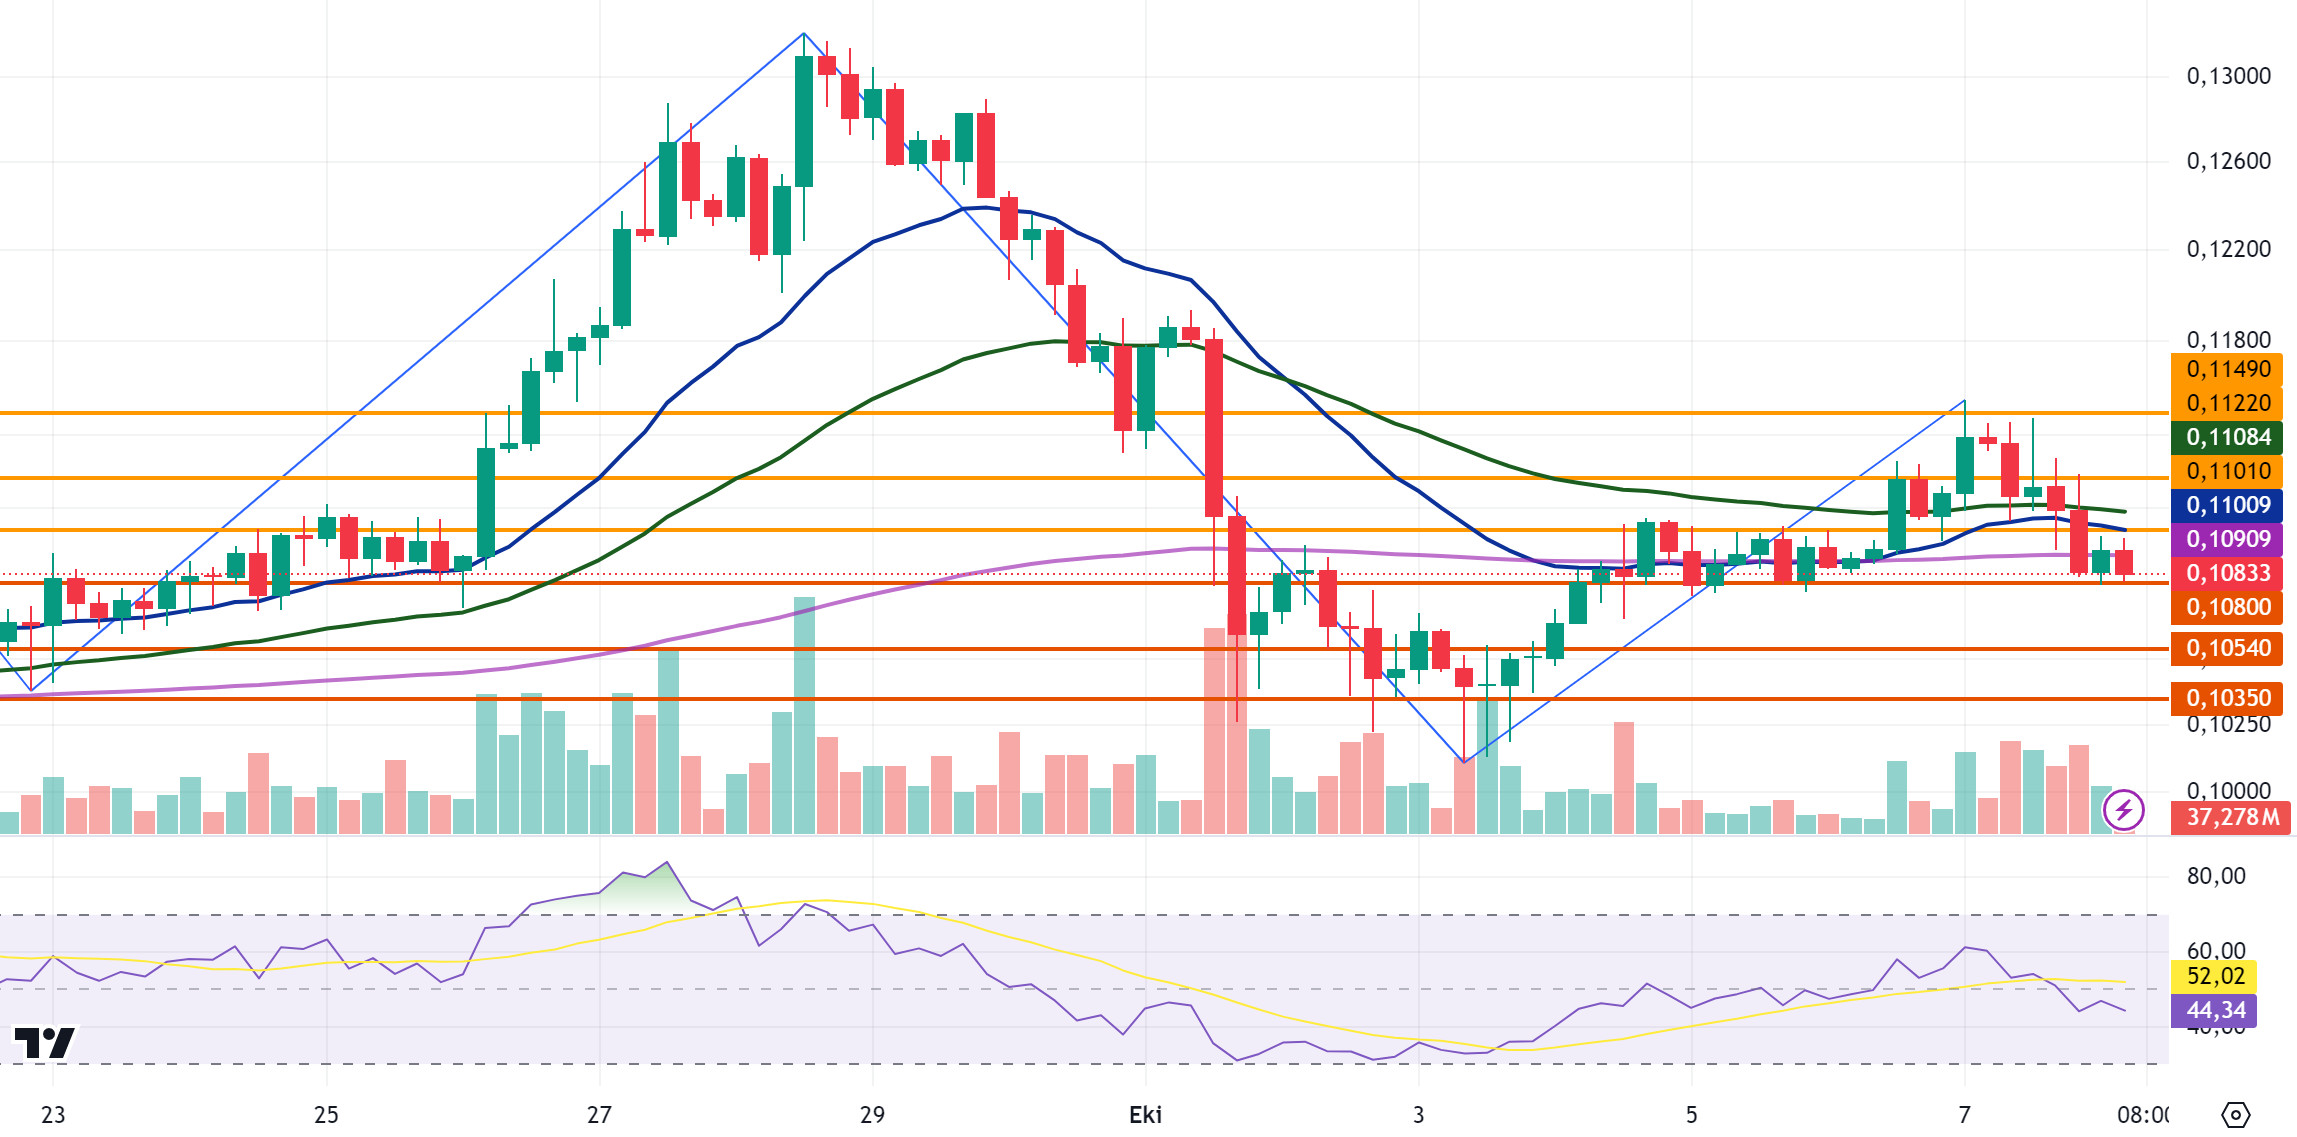
DOGE, which started today at 0.1083 with a 2.83% loss of value yesterday, fell with the sales that came after the rise it experienced in the opening candle in the 4-hour analysis and fell to the starting level of the day. It tested the 0.1080 support level with its decline. With the selling pressure that may occur on DOGE, which is located below the EMA levels, it may test the support levels of 0.1054-0.1035 in the continuation of the decline. DOGE may test the resistance levels of 0.1101-0.1122-0.1149 if it starts to rise with possible purchases.
The RSI (14) for DOGE is 44.34. It is not in overbought or oversold territory. The RSI (14) data is neutral and the possibility of moving within the horizontal band is strengthening.
EMA20 (Blue Line) – EMA50 (Green Line) – EMA200 (Purple Line)
Supports 0.1080 – 0.1054 – 0.1035
Resistances 0.1101 – 0.1122 – 0.1149
DOT/USDT
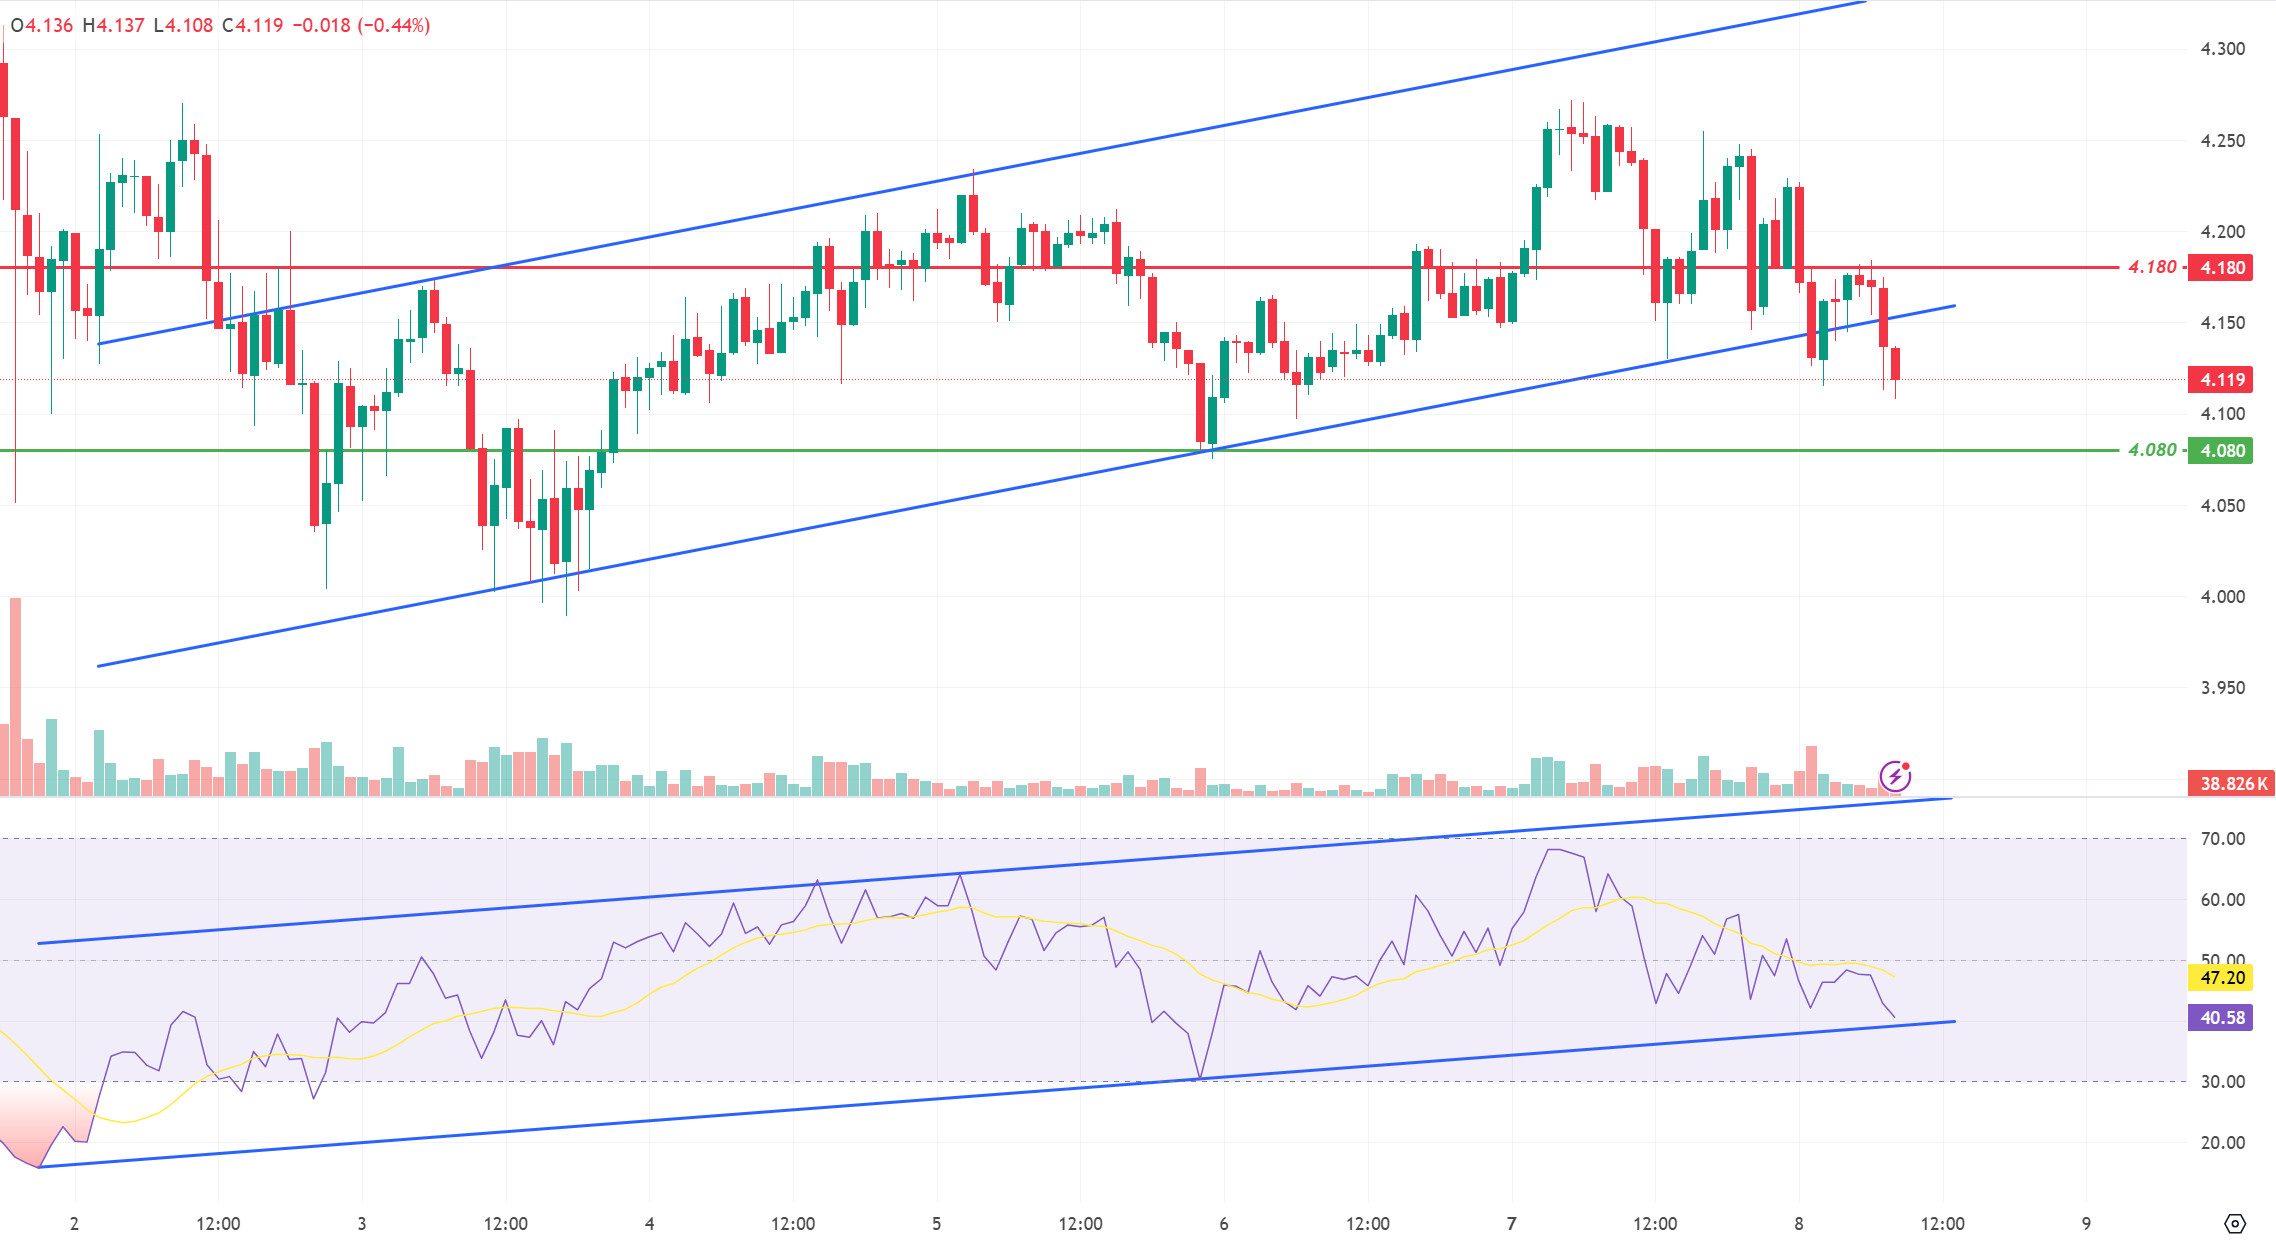
When we examine the DOT chart, we see that the price broke the lower band of the rising channel. RSI seems to be in the lower band of the rising channel. If the selling pressure continues, the first support level may be 4.080 levels. On the other hand, if the RSI reacts from the lower band of the rising channel, the price may move towards the resistance level of 4.180.
Supports 4.080 – 3.975 – 3.875
Resistances 4.180 – 4.210 – 4.265
SHIB/USDT
The Shiba Inu (SHIB) team emphasized the critical role of the BONE token in the SHIB ecosystem. Lucie, SHIB’s marketing lead, stated that BONE is the “energy source” in Shibarium and the system would grind to a halt without it. In addition to covering gas fees, BONE is also used in the incineration process, which aims to reduce the supply of SHIB. In the last 24 hours, the SHIB burning rate increased by 555%, resulting in the burning of 5,166,319 SHIBs.
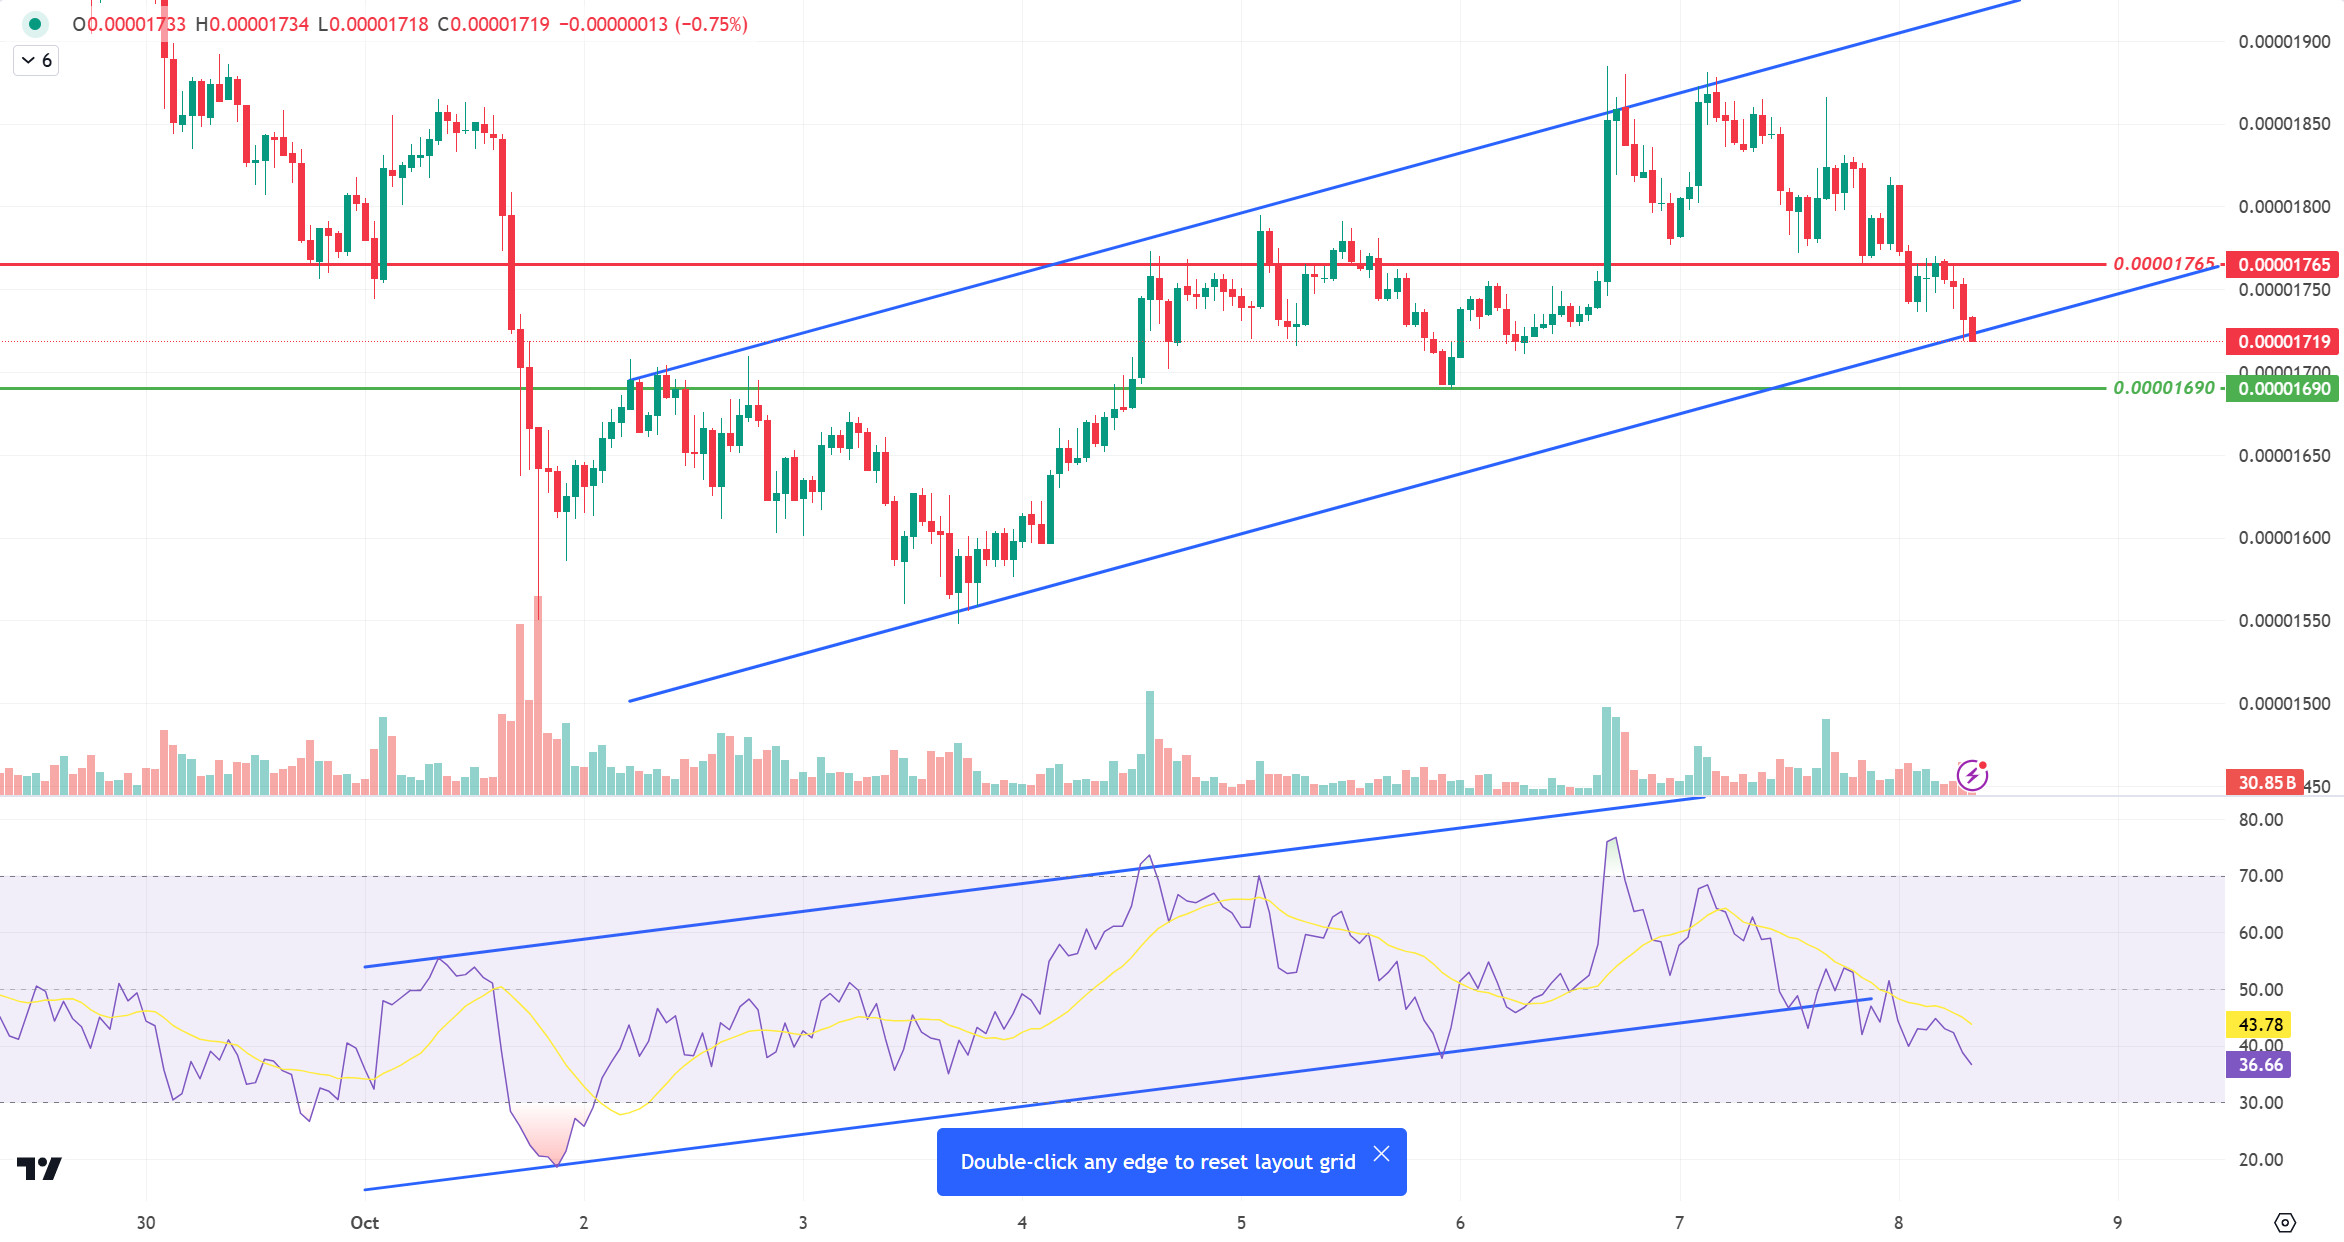
When we examine the SHIB chart, the price retreated to the lower band of the ascending channel as the lower band of the ascending channel was broken down on the RSI. If the price reacts from these levels, the first resistance level may be 0.00001765. On the other hand, if the selling pressure continues, the price may retreat to 0.00001690 levels.
Supports 0.00001690 – 0.00001630 – 0.00001565
Resistances 0.00001765 – 0.00001810 – 0.00001895
LEGAL NOTICE
The investment information, comments and recommendations contained herein do not constitute investment advice. Investment advisory services are provided individually by authorized institutions taking into account the risk and return preferences of individuals. The comments and recommendations contained herein are of a general nature. These recommendations may not be suitable for your financial situation and risk and return preferences. Therefore, making an investment decision based solely on the information contained herein may not produce results in line with your expectations.


