Weekly Ethereum Onchain Report
Active Addresses
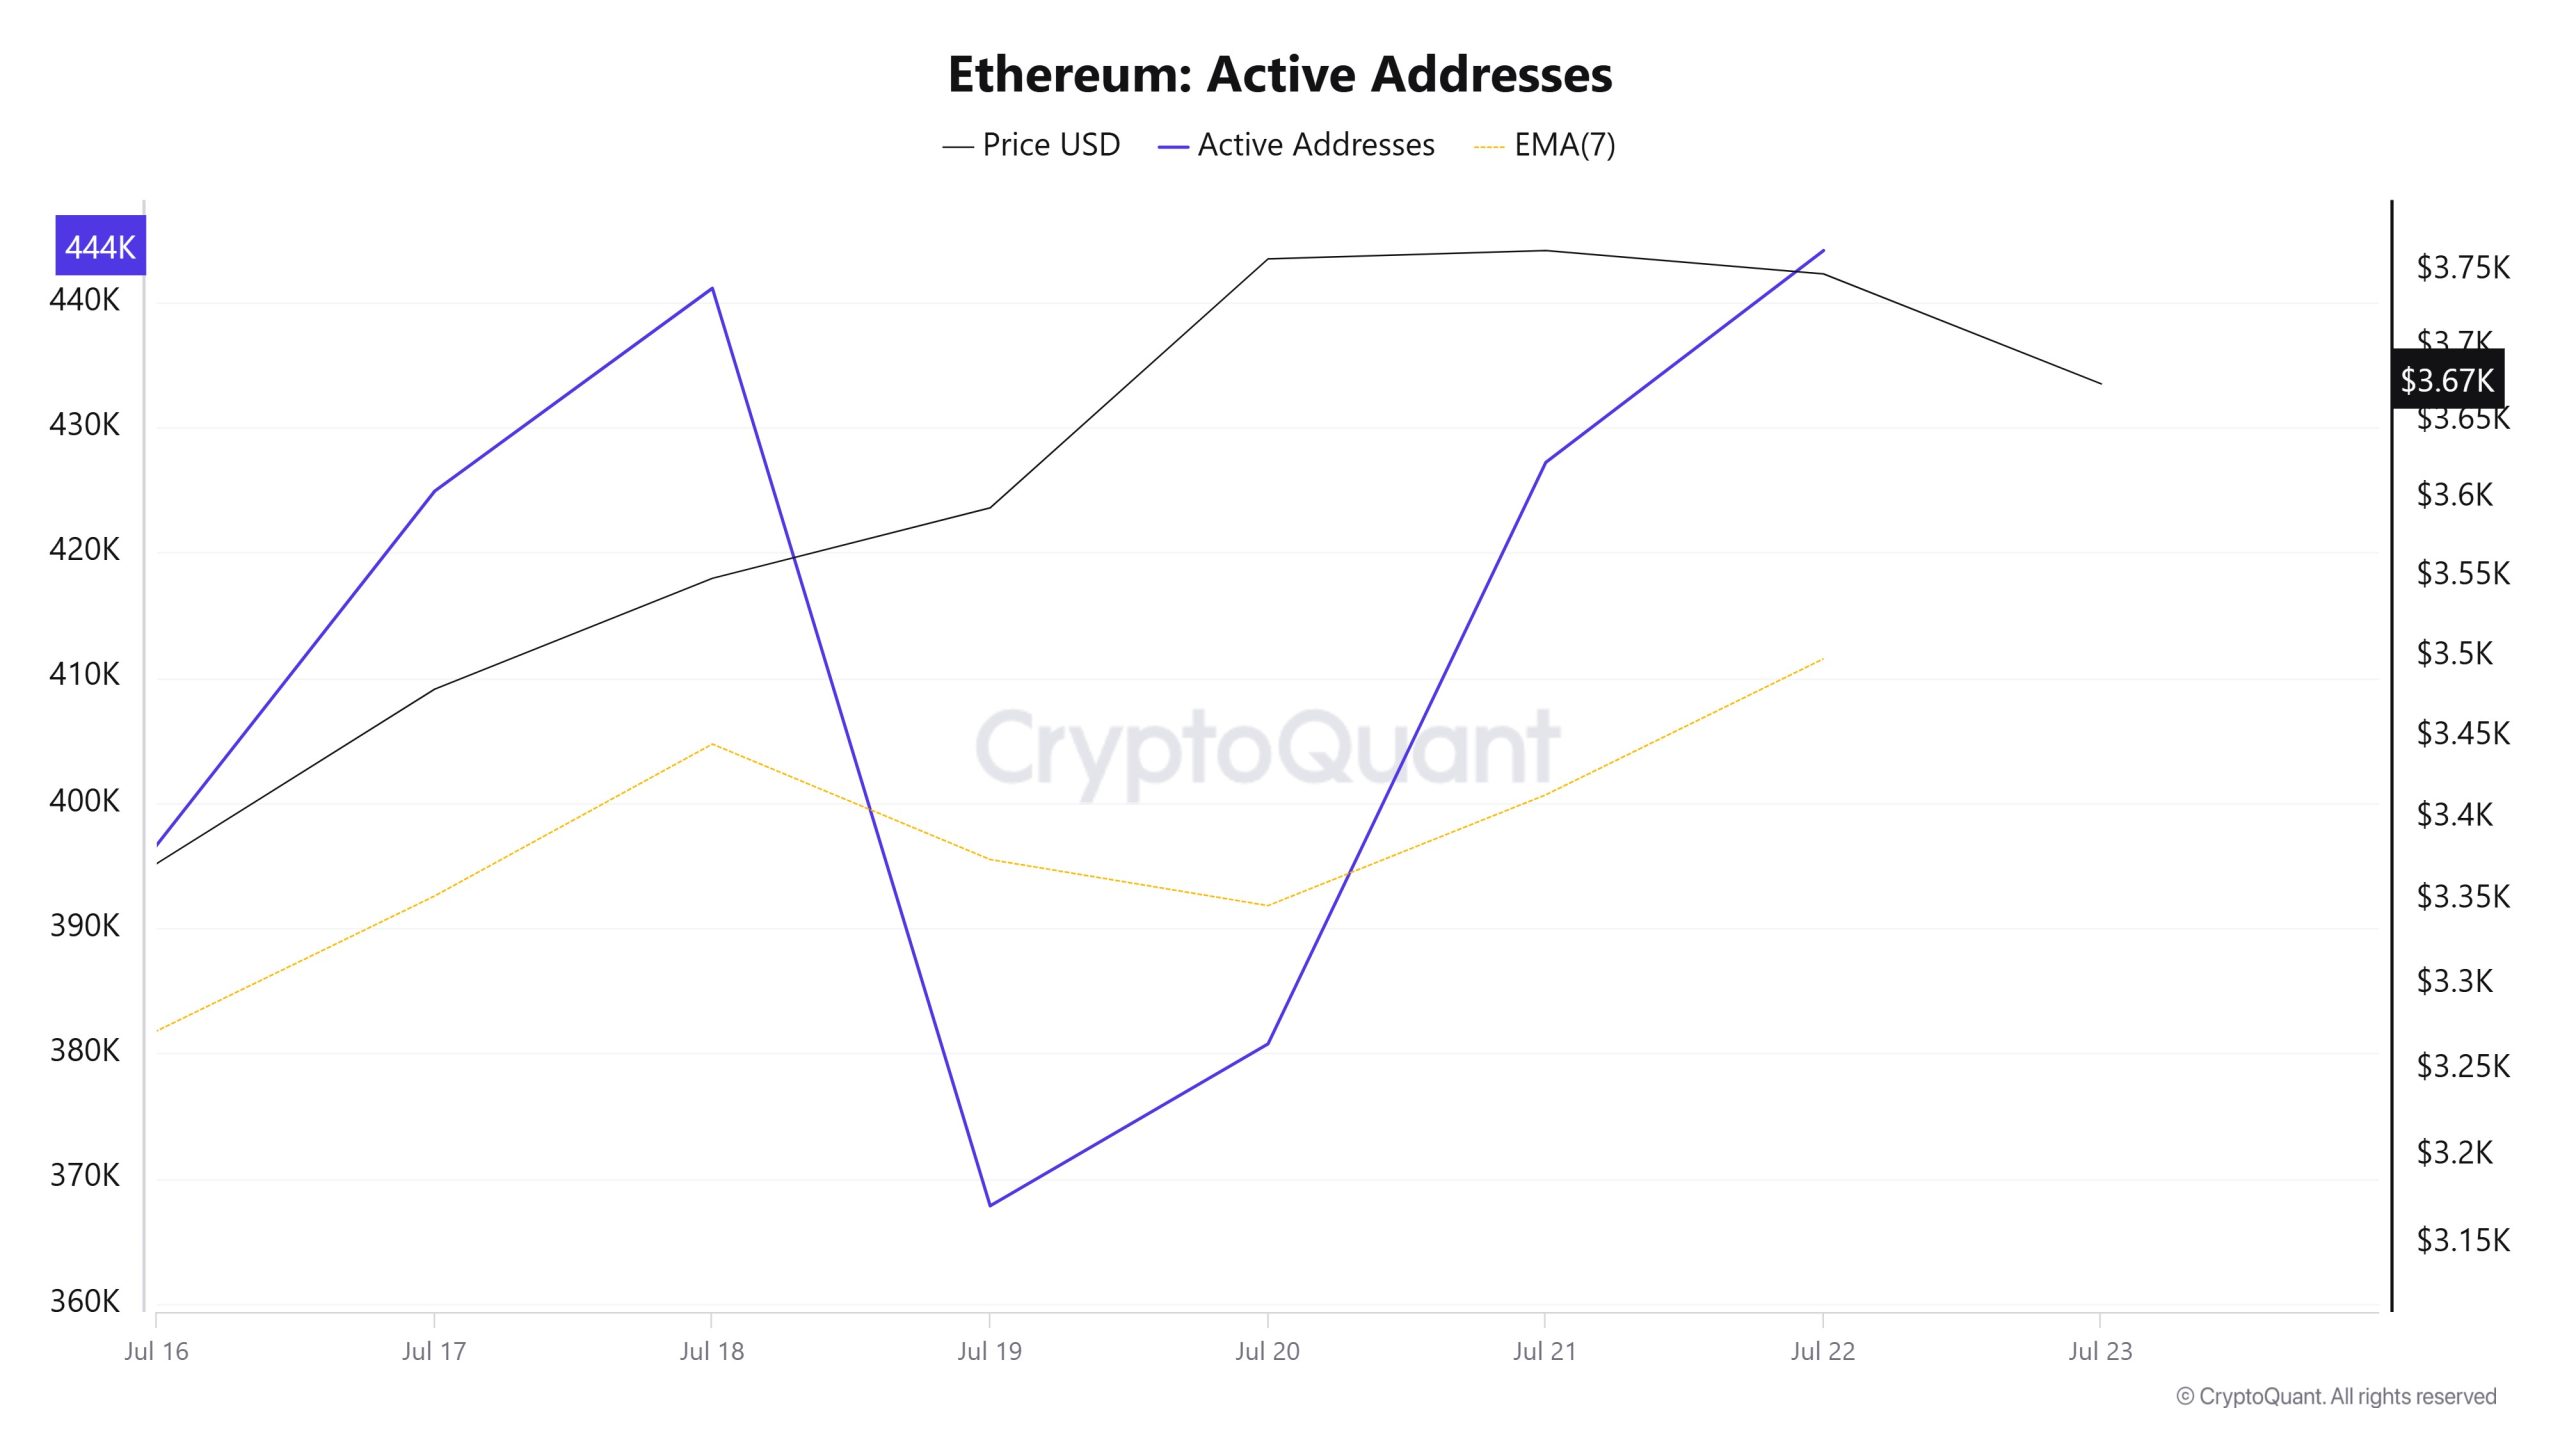
Between 16-23 July, a total of 444,130 active addresses entered the Ethereum network. During this period, the Ethereum price rose from $3,372 to $3,750. Especially on 18 July, at the intersection of the price and the number of active addresses, there was a significant decrease in the number of active addresses while the price continued to rise. This suggests that despite the price increase, short-term participation has decreased, possibly reflecting the predominance of transactions between existing investors. When the 7-day simple moving average (SMA) is examined, it is seen that a general upward trend is dominant in the Ethereum price.
Active Sending Addresses
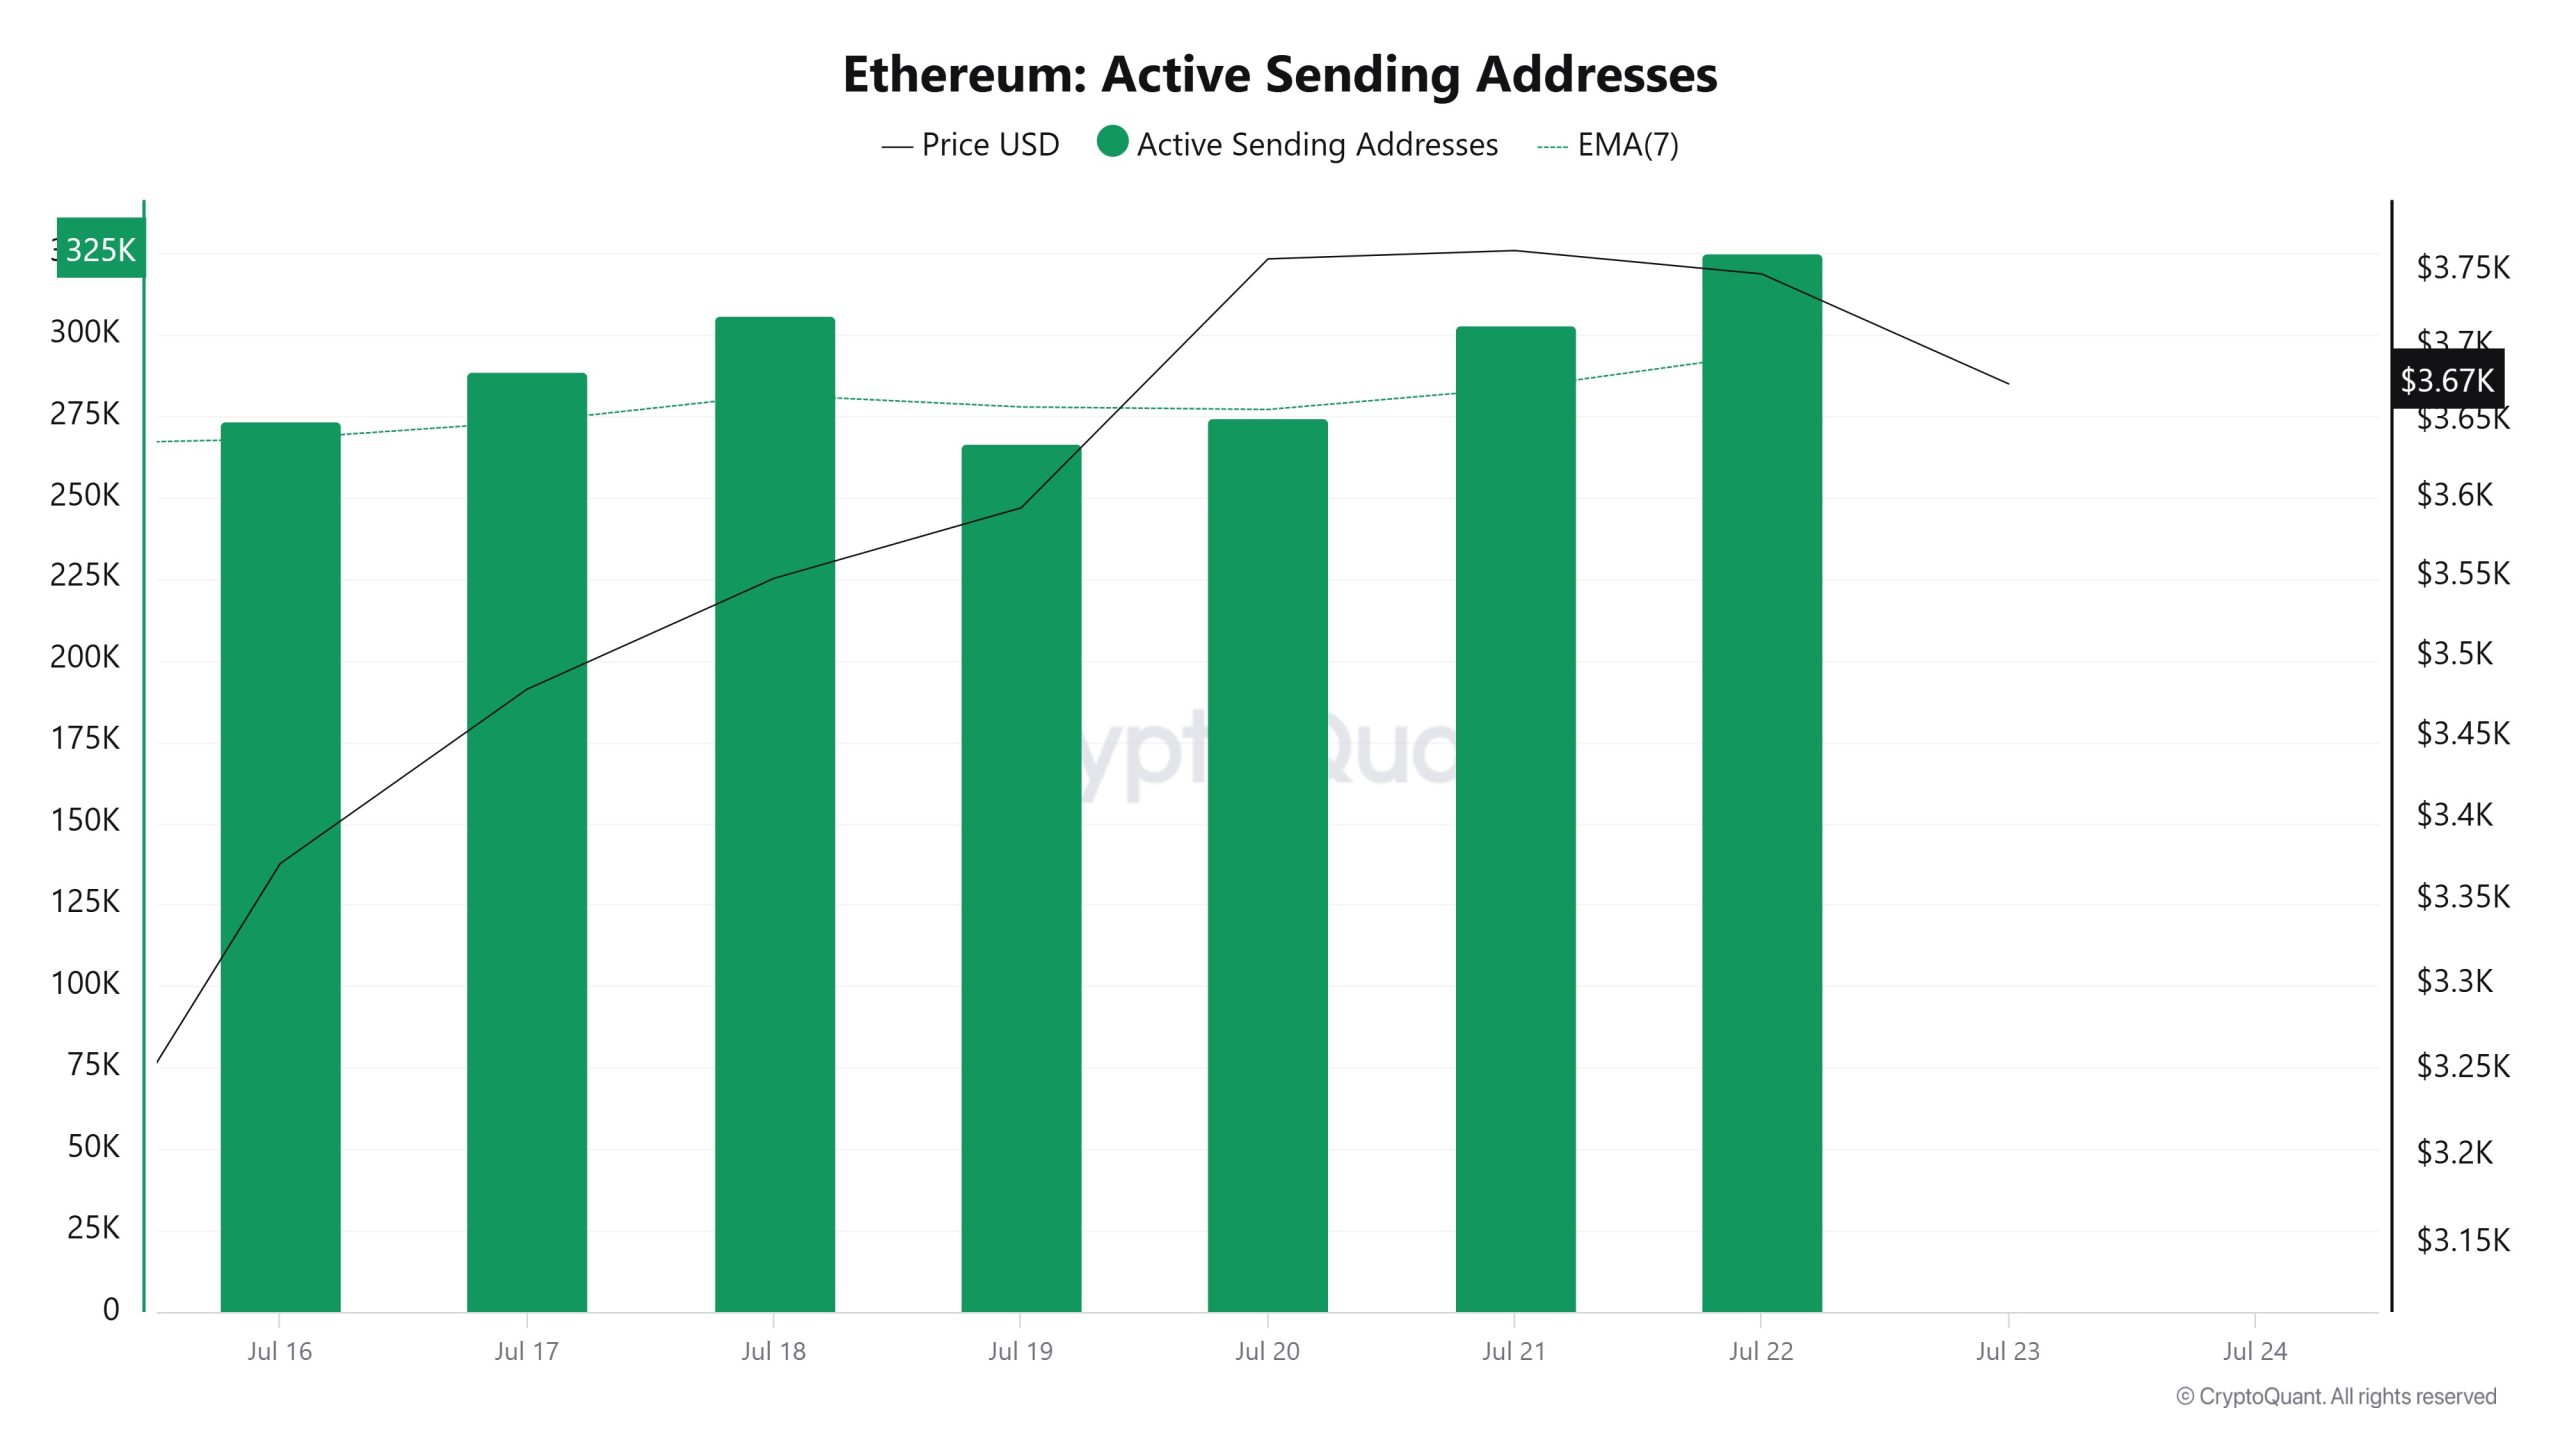
Between 16 July and 23 July, a bullish movement was observed with the Black Line (price line) at active shipping addresses. On the day when the price reached its highest level on a weekly basis, active shipping addresses were at 325,045 levels; It was observed that Ethereum wallets made similar weekly increases.
Active Receiving Addresses
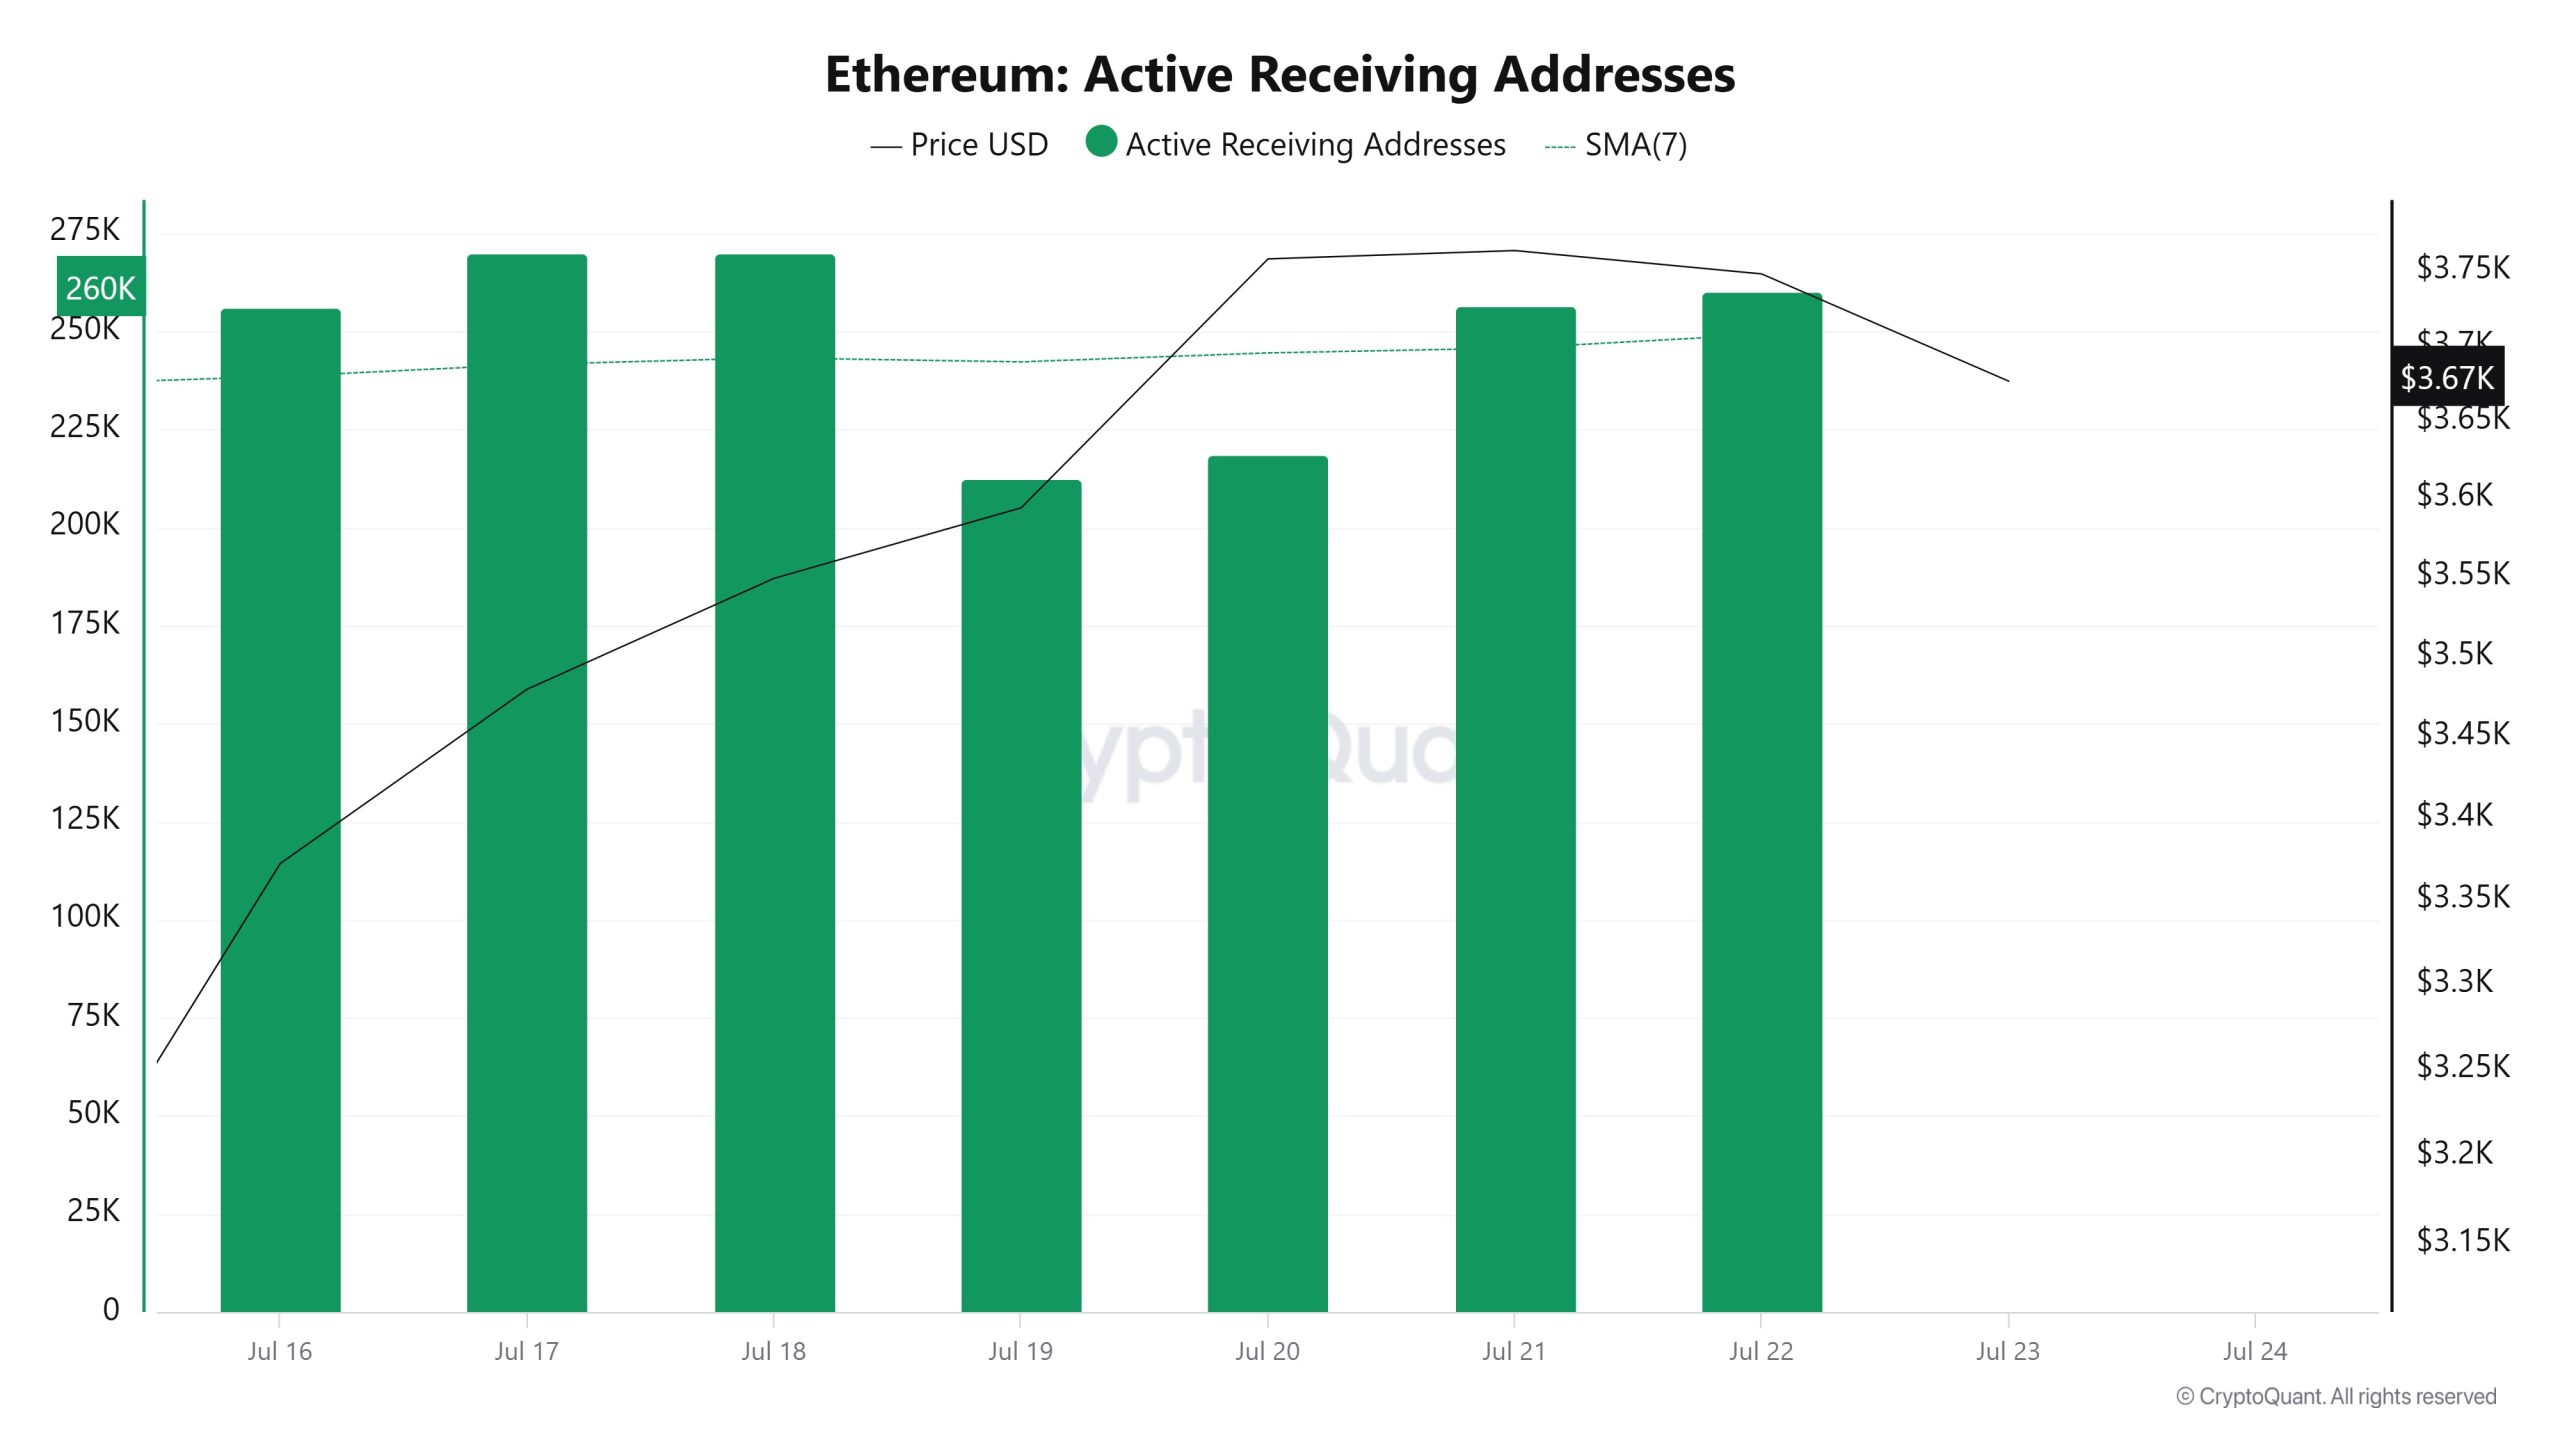
Between 16 July and 23 July, while there was an increase in active buying addresses, it is seen that the price was consolidated in parallel with this. On the day when the price reached its highest level, the active buying addresses rose to 269,948 levels, indicating that the purchases accelerated.
Total Value Staked
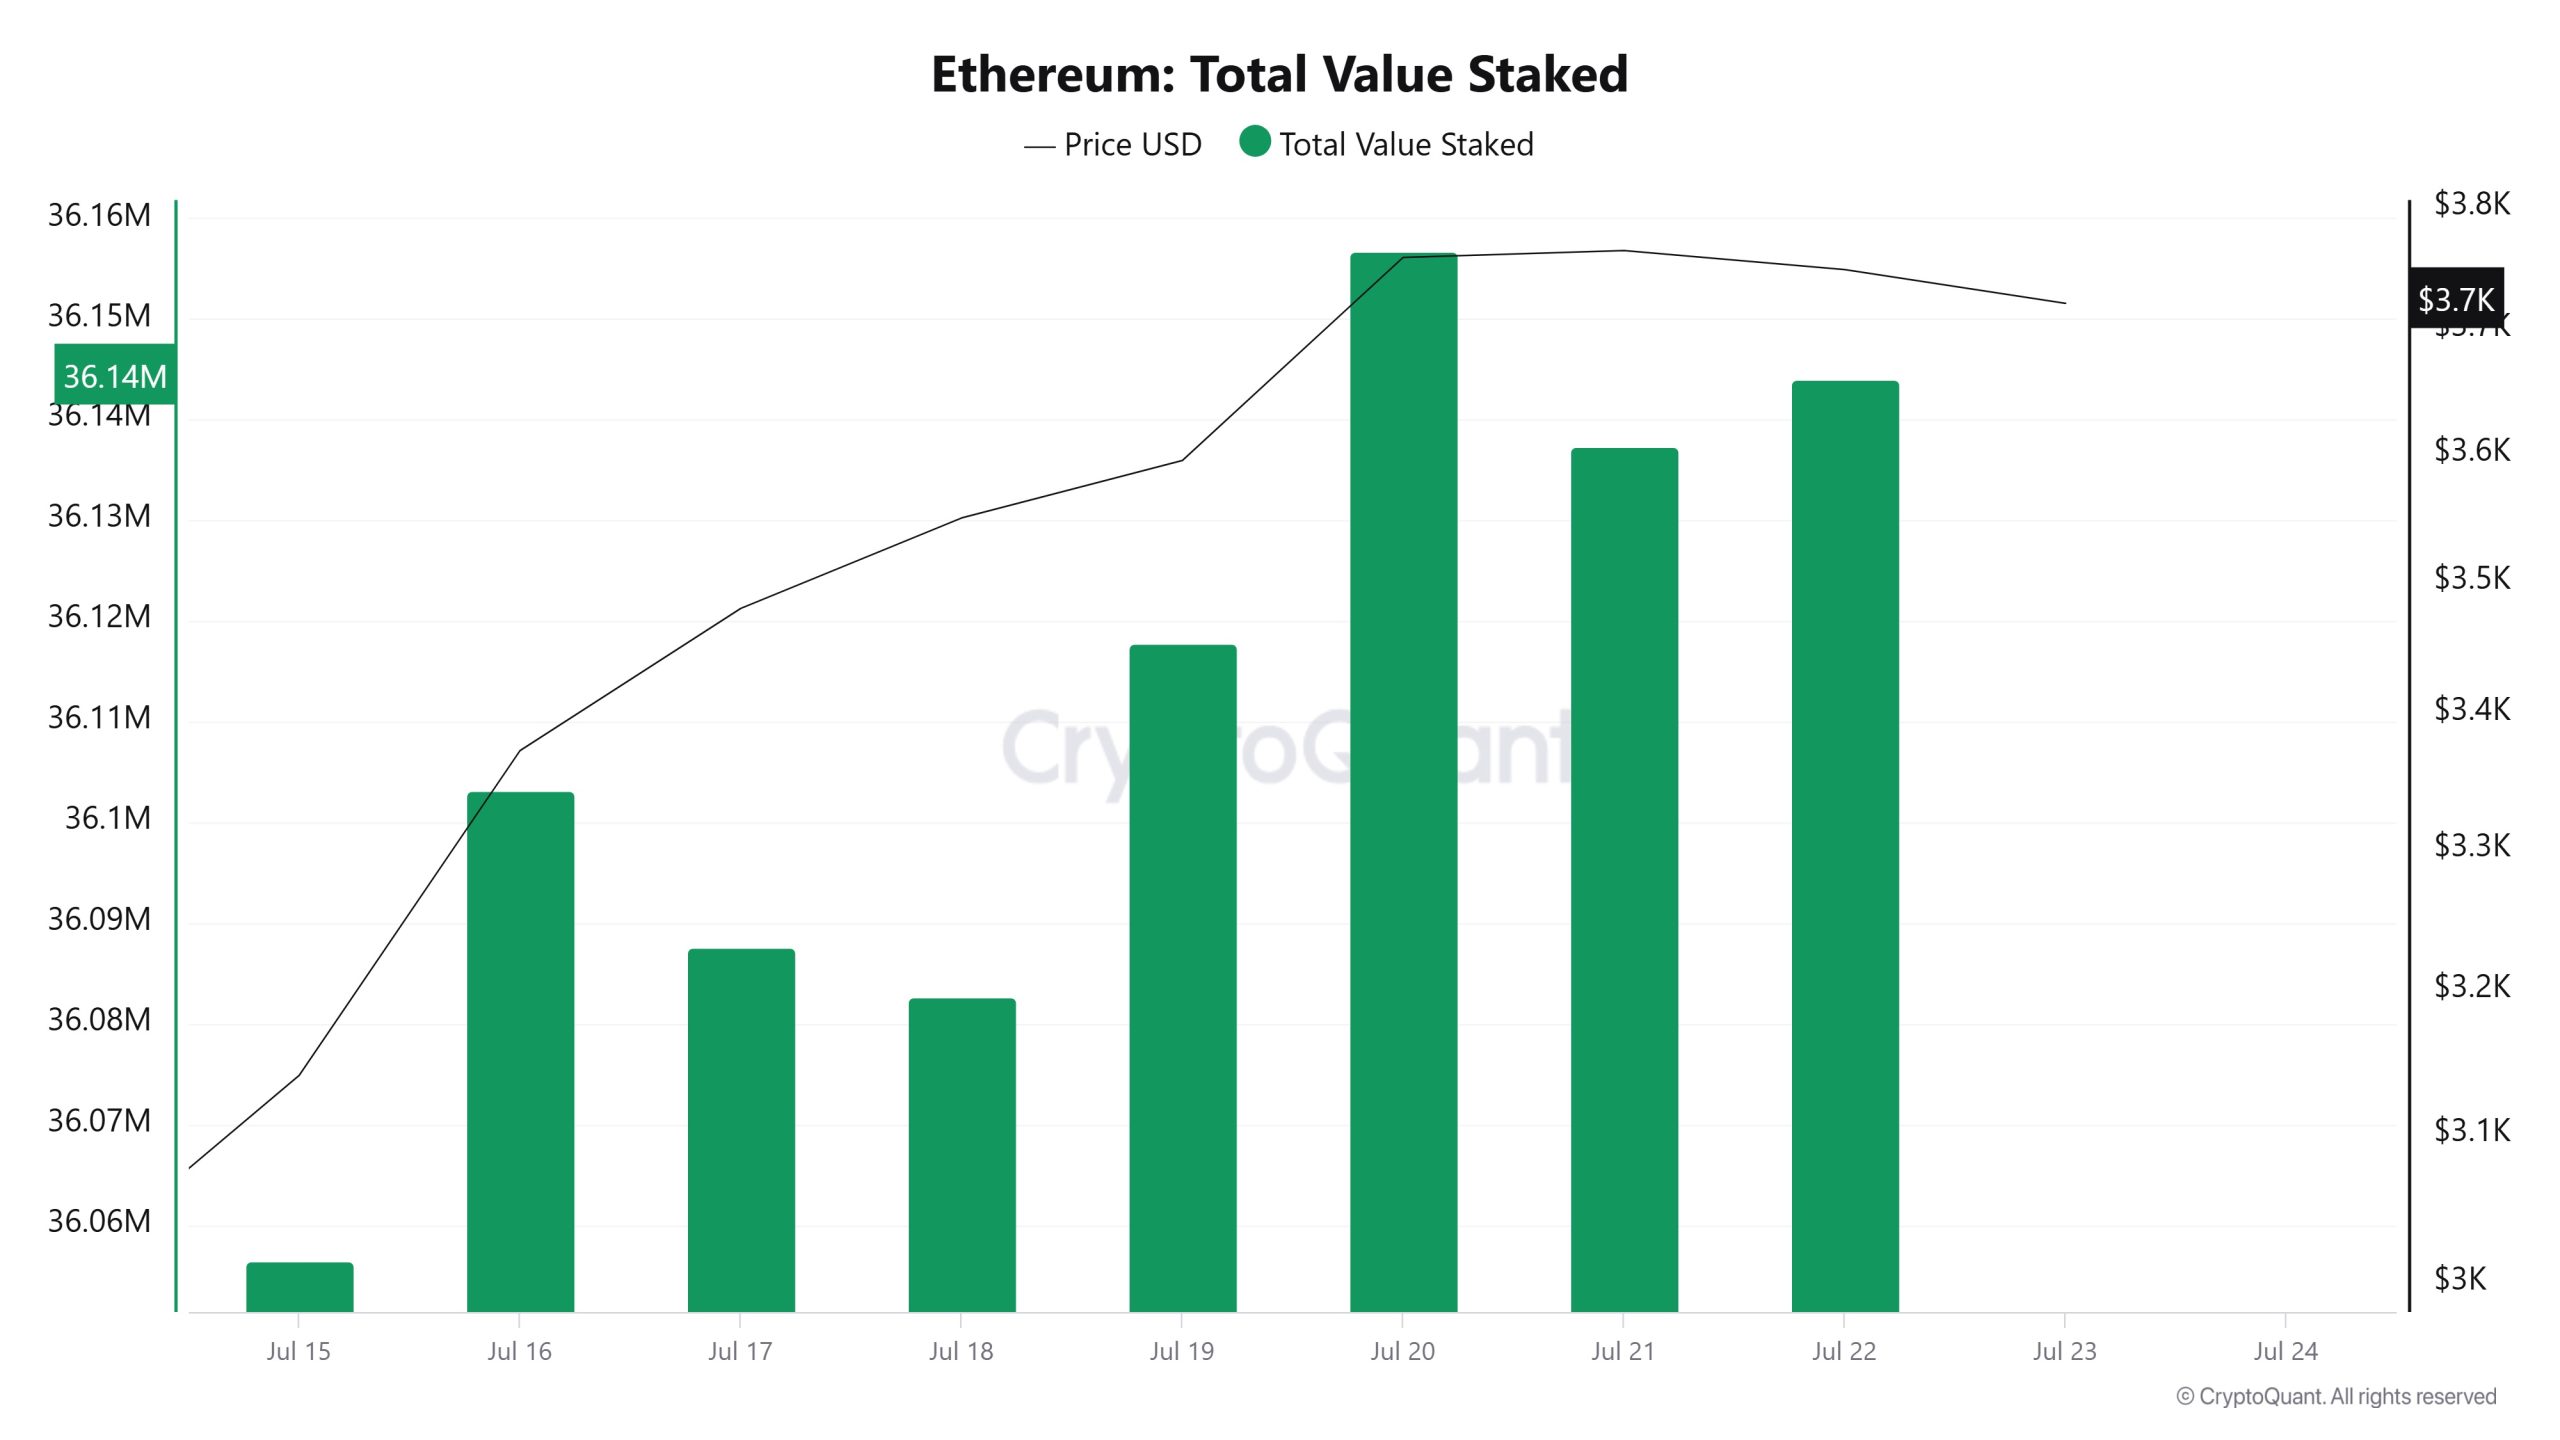
On 16 July, ETH price was at 3.372, while Total Value Staked was at 36,103,195. As of 22 July, ETH price increased to 3,748, an increase of 11.14%, while Total Value Staked increased to 36,143,909, an increase of 0.11%.
Staking Inflows
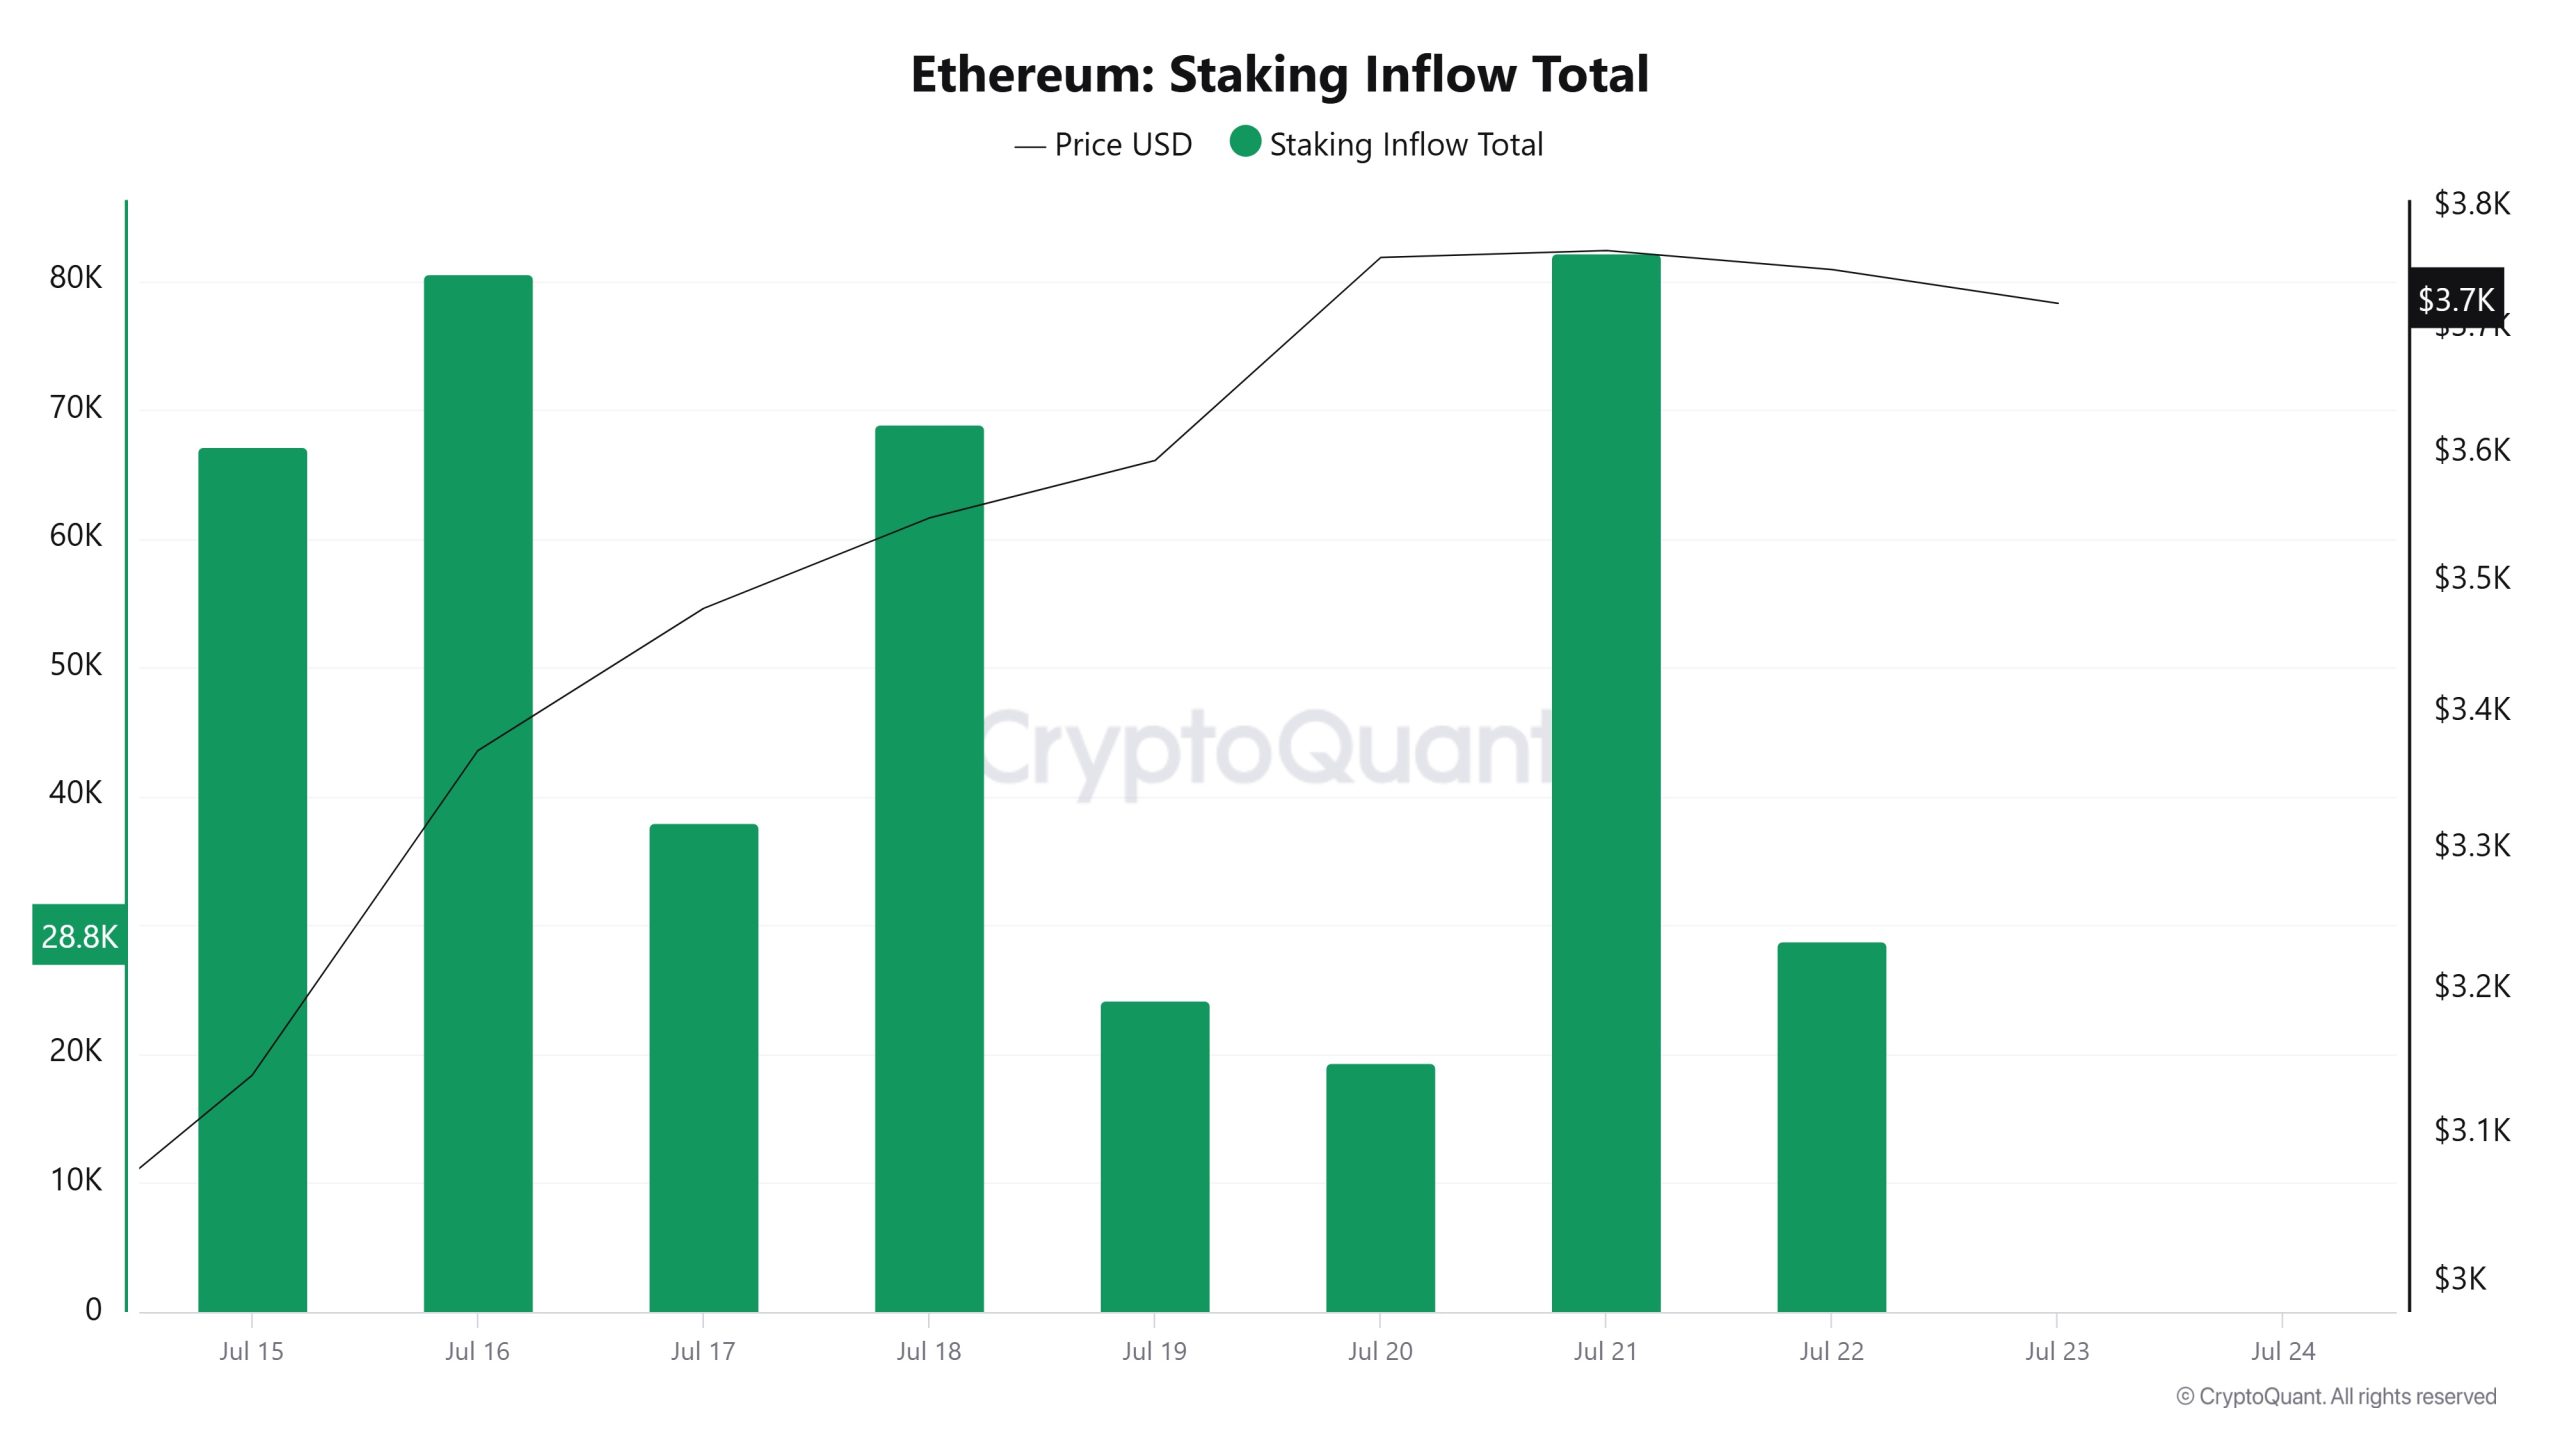
On 16 July, ETH price was at 3.372, while Staking Inflow was 80.551. As of 22 July, ETH price increased to 3,748, an increase of 11.14%, while Staking Inflow decreased to 28,863, a decrease of 64.16%.
Derivatives
Open Interest
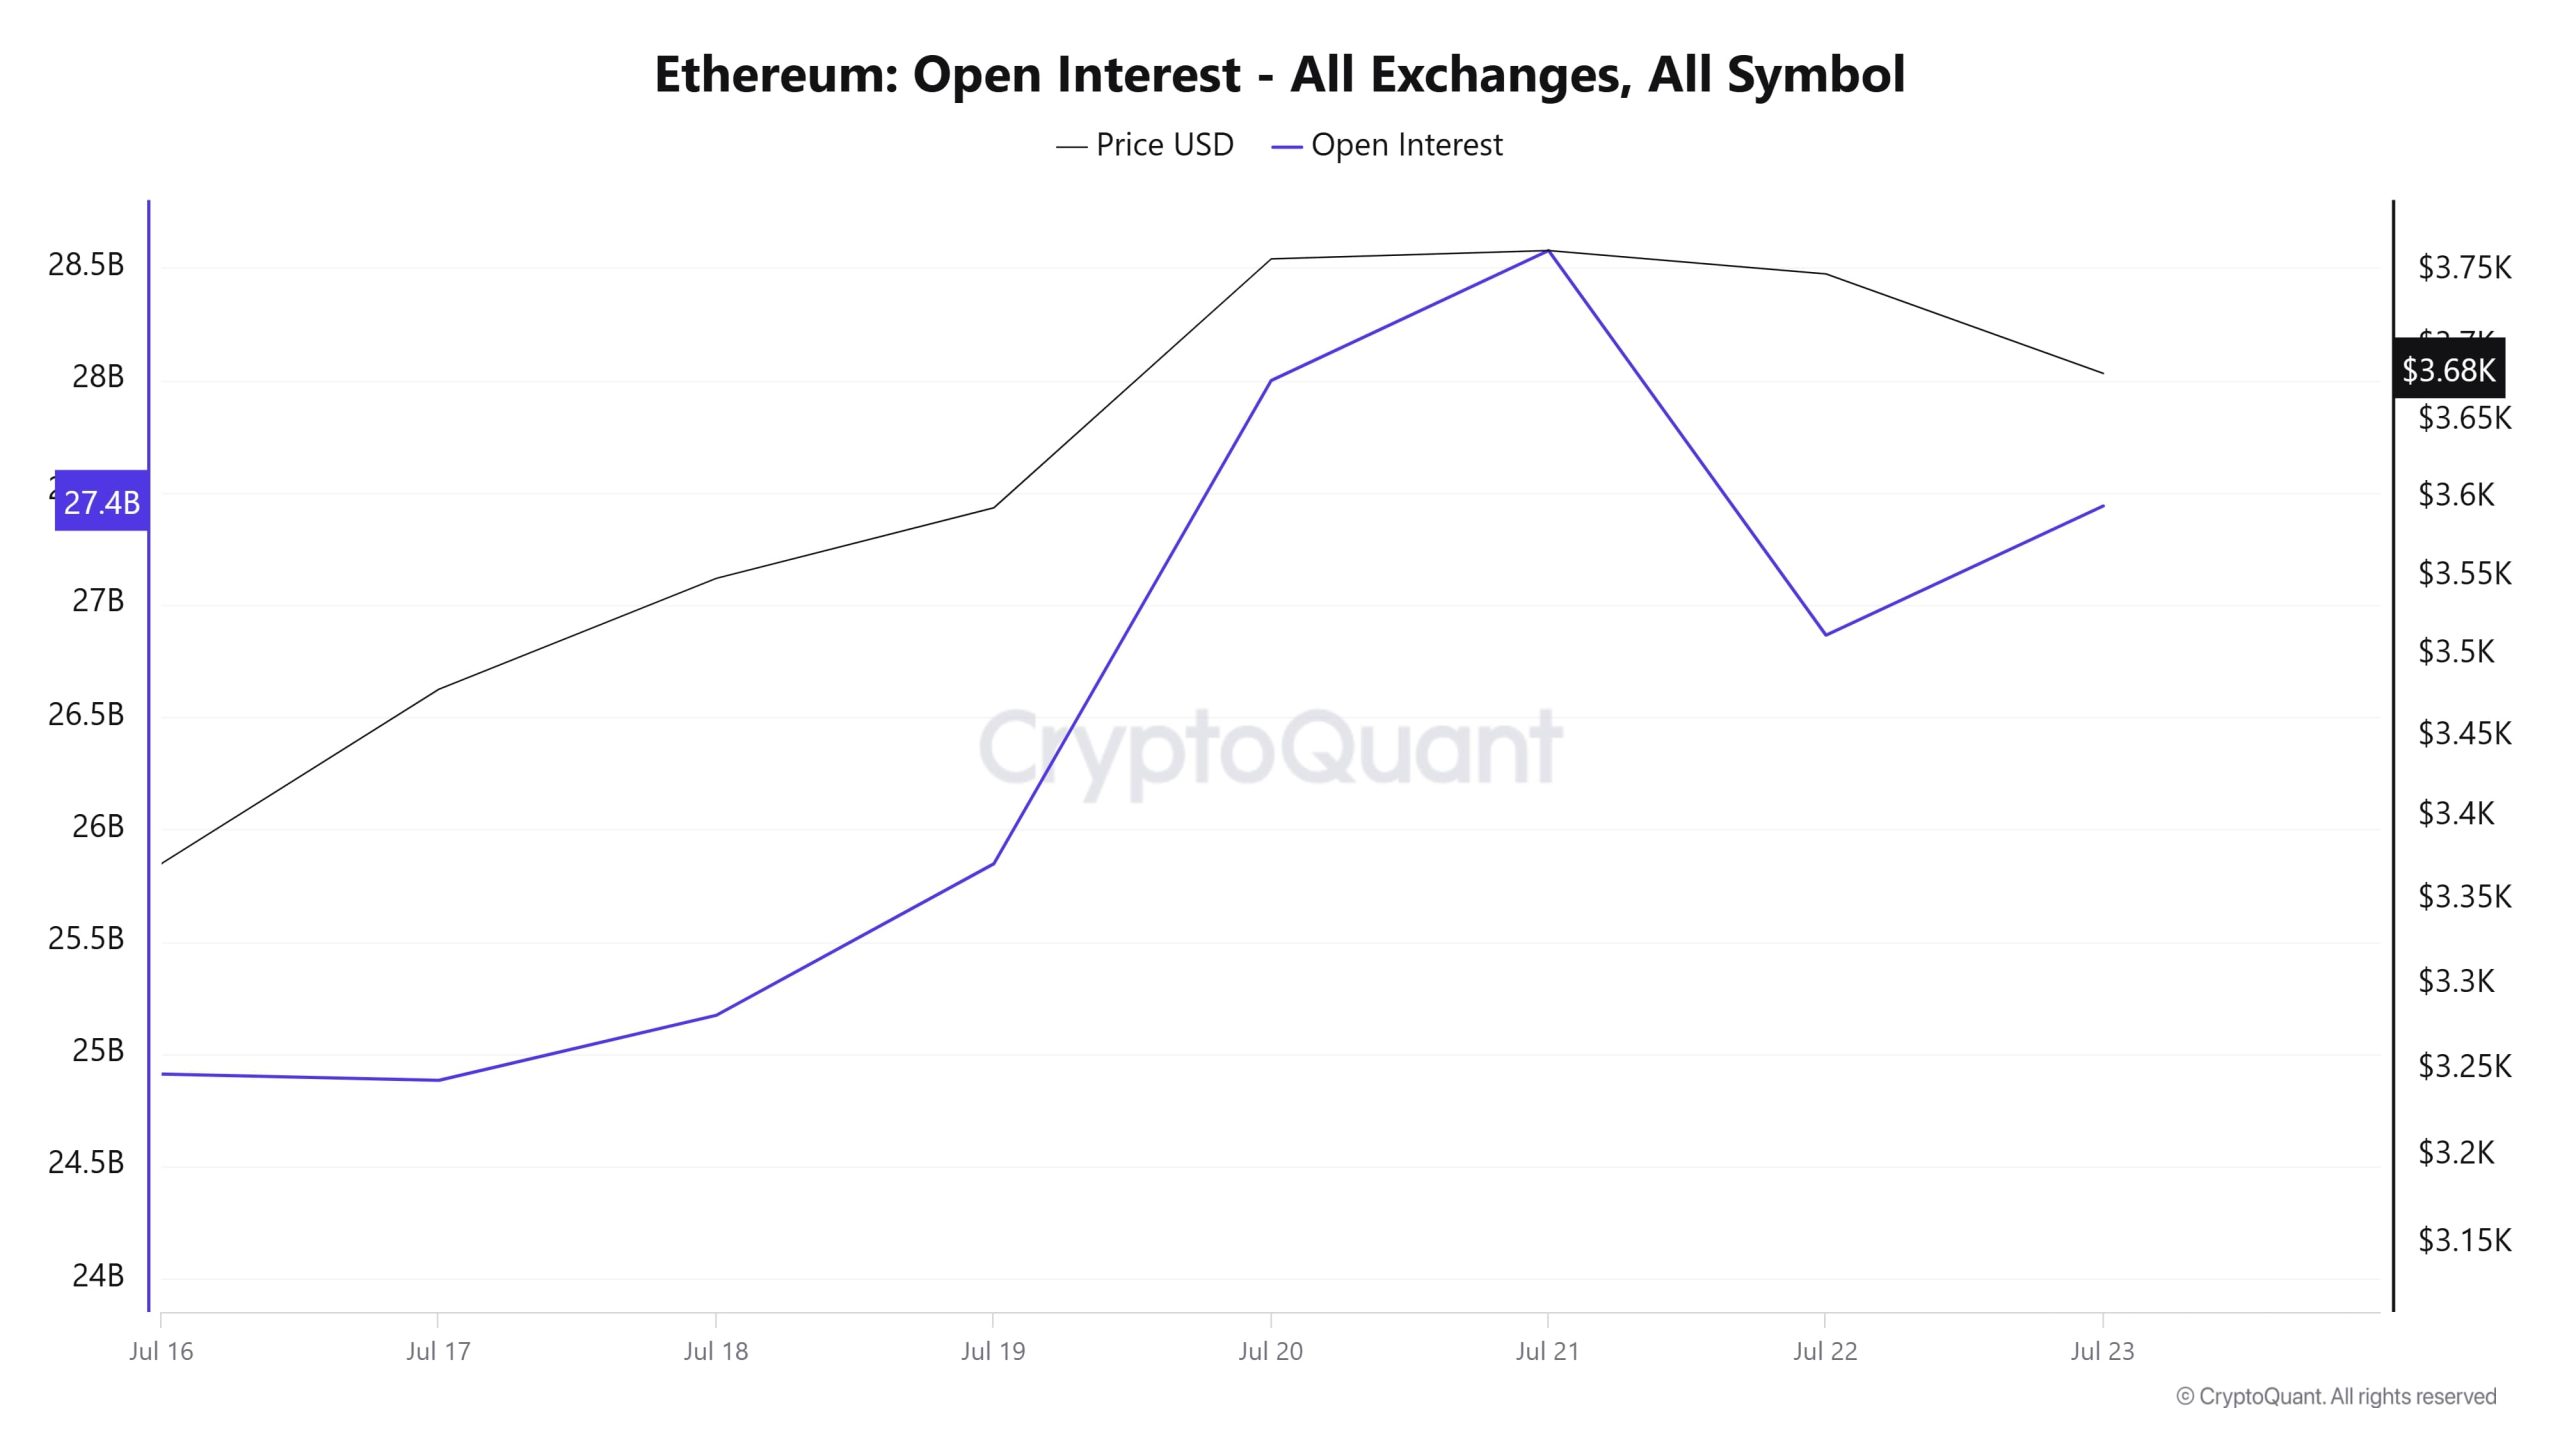
Ethereum’s open interest data gradually increased after 16 July, and as of 21 July, both price and open interest peaked. On this date, ETH price reached $3,860, while open interest reached $28.5 billion. This structure suggests that it was supported by leveraged positions as well as spot purchases. However, on 22 July, there was a sharp decline in open interest and it fell to $ 27 billion. This shows that position closures accelerated and liquidations came into effect. Although the retracement in the price is limited, the decline in open interest is remarkable. On the last day, there is a recovery trend, which shows that the market reacted quickly, and the risk appetite is still alive.
Funding Rate

On the ETH side, the upward trend in funding rates has attracted attention in recent days. Rates, which were at 0.015 on 16 July, have climbed to 0.018 as of 23 July. This increase shows that the market is concentrated on the long side and investors maintain their bullish expectations. The fact that funding rates remained high, especially in the last section, when the price rose to the $3,860 band and eased slightly, indicates that aggressive long positions are still being carried. In the short term, this may create a squeeze. Because both high rates and excessive long accumulation can trigger liquidations in a sudden reverse movement. Nevertheless, the overall structure is positive and the rates rising with the price show that the market maintains its momentum.
Long & Short Liquidations
With the ETH price, which rose sharply last week, reaching $ 3,860, this $ 936 million long $ 680 million short transaction was liquidated.
| Date | Long Amount (Million $) | Short Amount (Million $) |
| July 16 | 39.07 | 140.01 |
| July 17 | 128.01 | 125.61 |
| July 18 | 397.95 | 148.72 |
| July 19 | 25.51 | 23.04 |
| July 20 | 50.44 | 119.19 |
| July 21 | 171.77 | 63.71 |
| July 22 | 123.65 | 60.03 |
| Total | 936.40 | 680.31 |
Supply Distribution
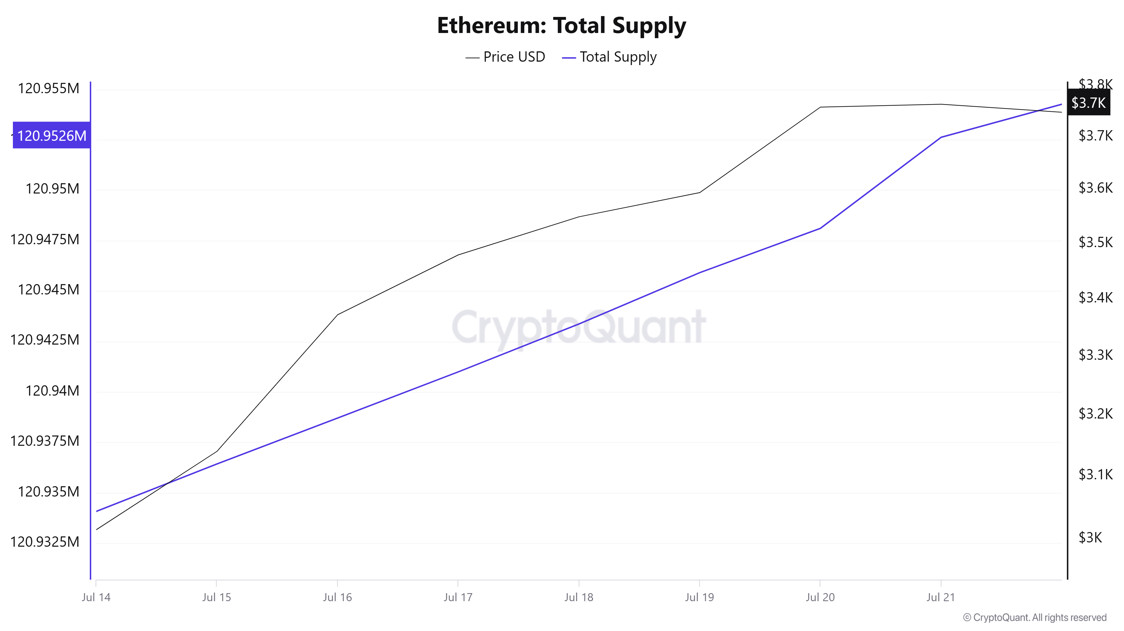
Total Supply: It reached 120,952,618 units, up about 0.0153% from last week.
New Supply: The amount of ETH produced this week was 18,543.
Velocity: Velocity, which was 8.58 last week, was 8.76 as of 21 July.
| Wallet Category | 14.07.2025 (Old) | 14.07.2025 (New) | Change (%) |
|---|---|---|---|
| 100 – 1k ETH | 9.0086M | 8.9037M | −1.1647% |
| 1k – 10k ETH | 13.4681M | 13.4586M | −0.0705% |
| 10k – 100k ETH | 16.4581M | 17.071M | 3.7247% |
| 100k+ ETH | 4.0726M | 4.1136M | 1.0066% |
According to the latest weekly data, a general downward trend in Ethereum wallet distribution stands out. While there was a limited decrease of 1.16% in the number of wallets in the 100 – 1k ETH range, a 0.07% decline was recorded in the 1k – 10k ETH segment. In contrast, a remarkable increase of 3.72% was observed in the 10k – 100k ETH range. In the 100k+ ETH category, a slight increase of 1.00% was seen.
Exchange Reserve
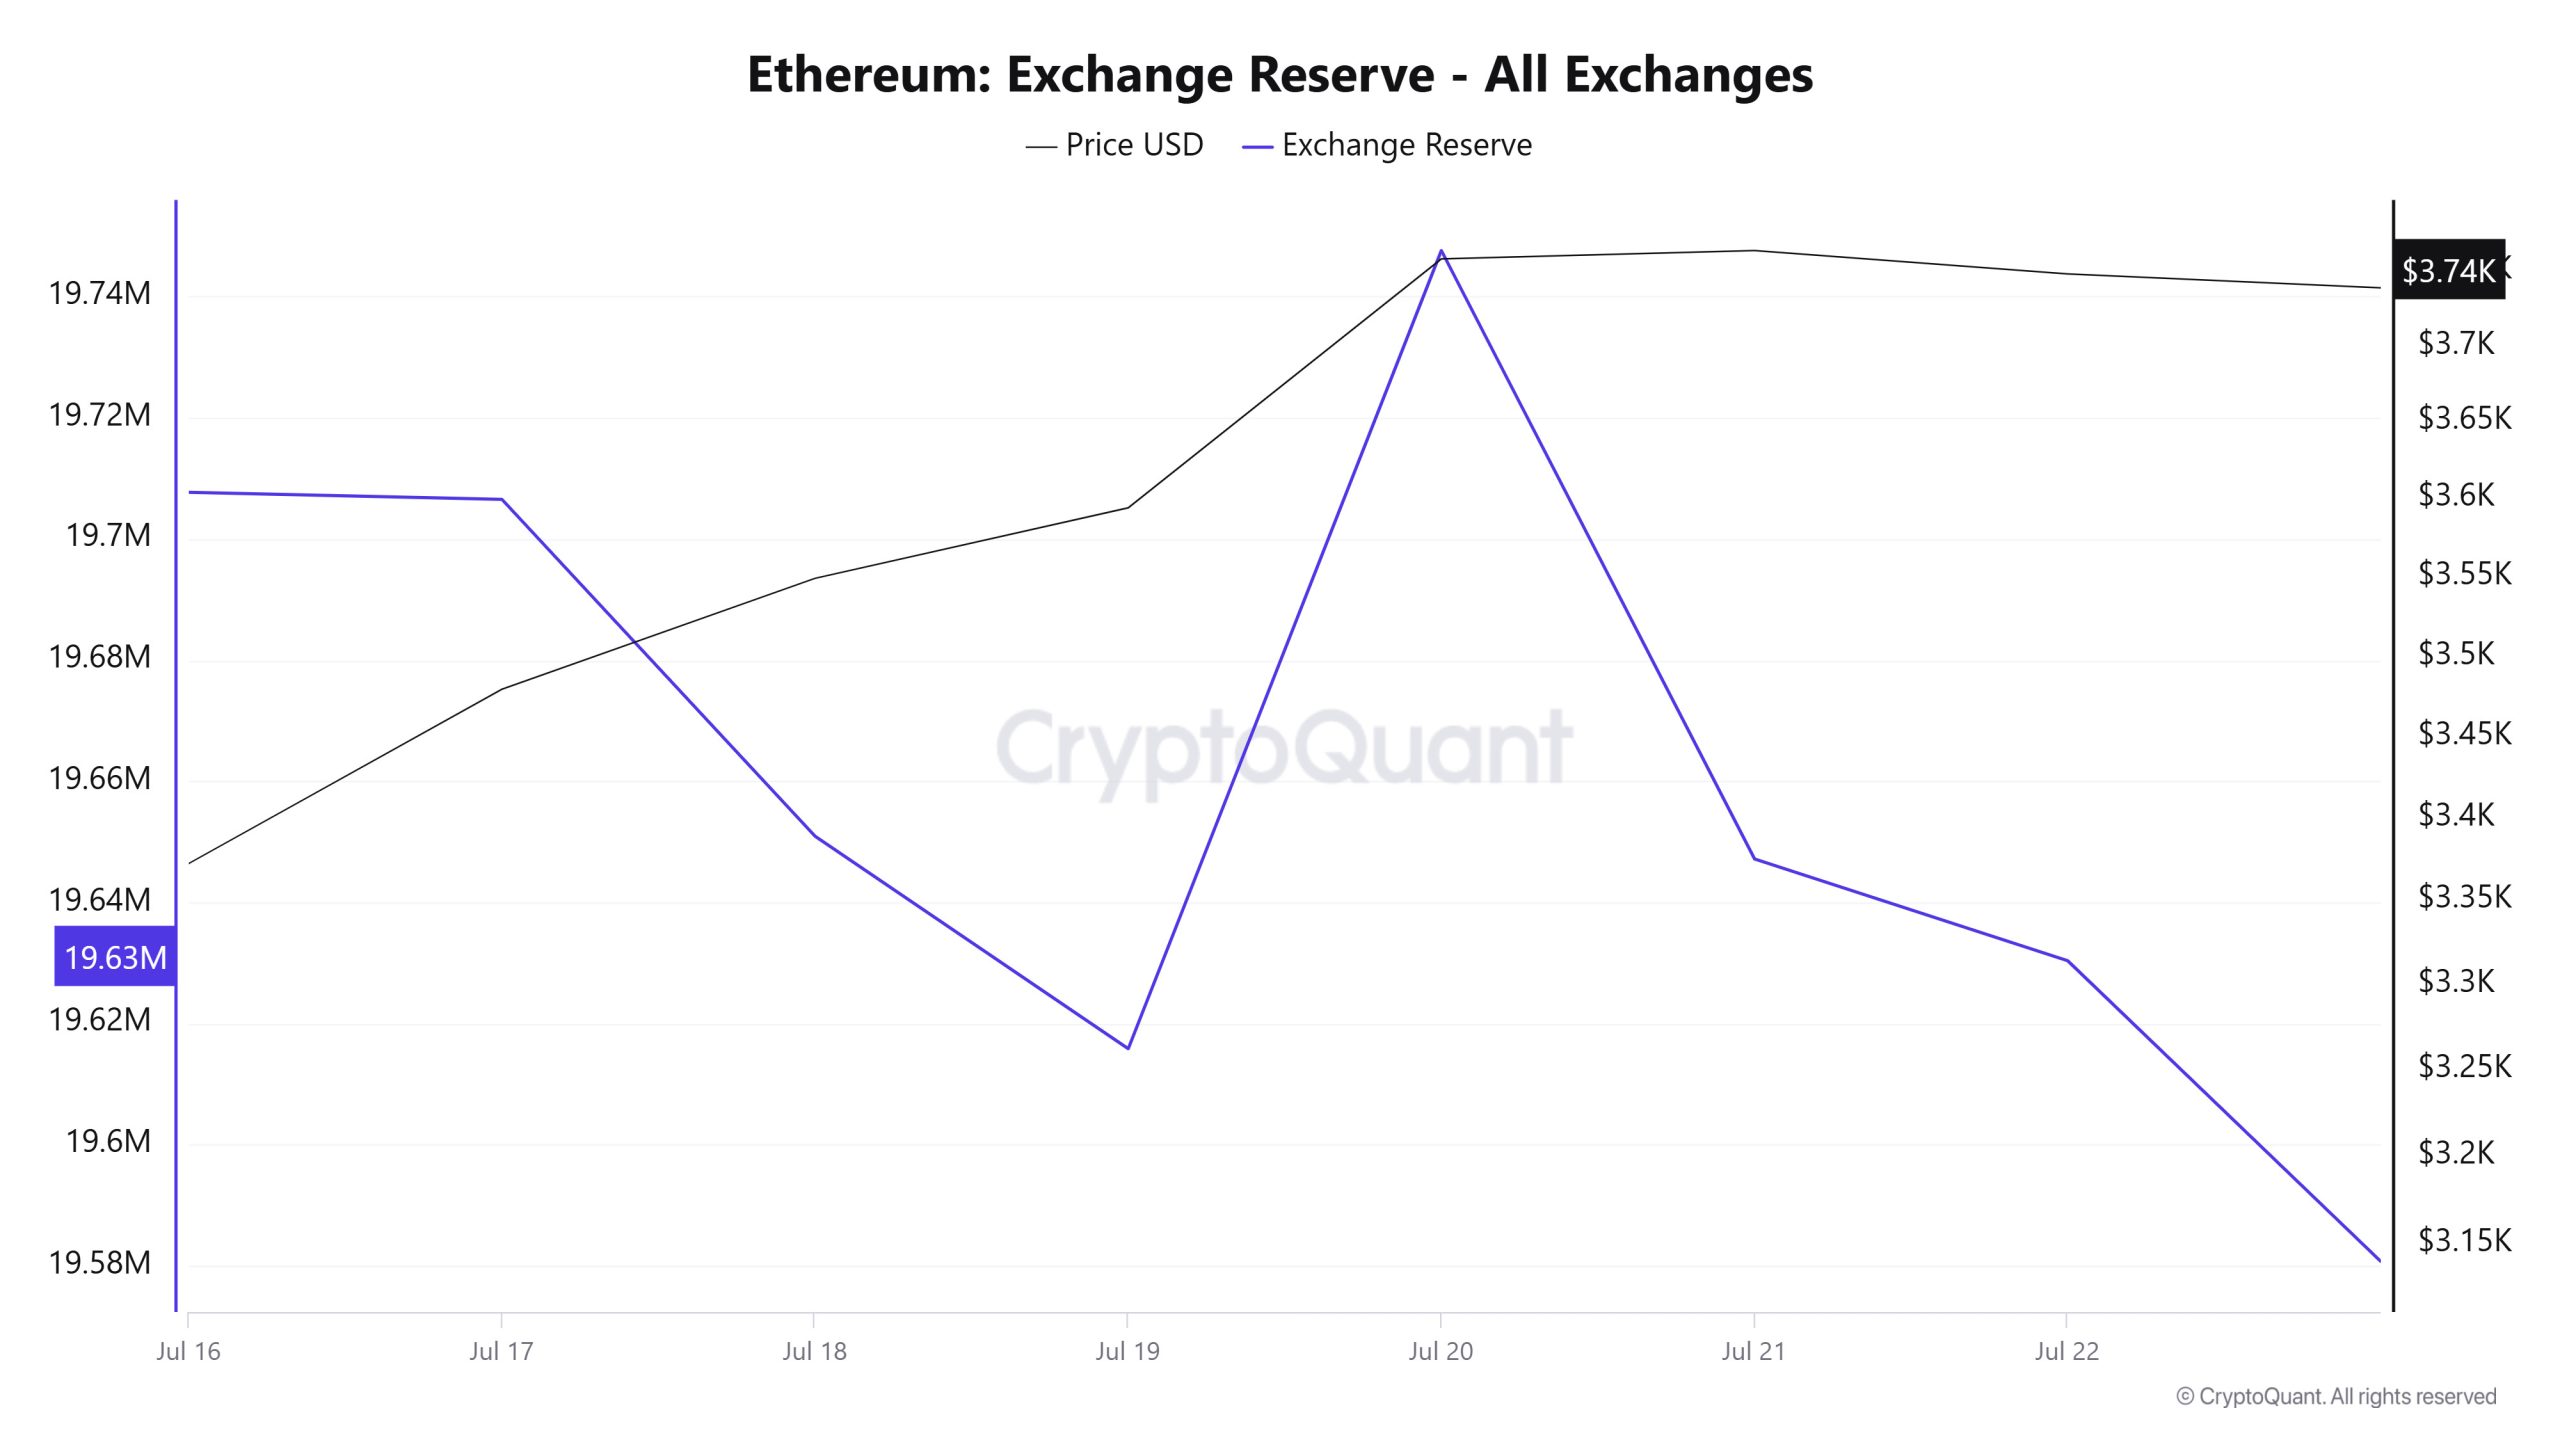
Between 16-22 July 2025, Ethereum reserves on exchanges decreased from 19,707,676 ETH to 19,630,358 ETH. In this process, there was a total net outflow of 77,318 ETH and a decrease of approximately 0.39% in exchange reserves. In the same period, the Ethereum price rose from $3,372 to $3,748, an 11.15% increase in value. The continued outflows of ETH from exchanges as the price rises reveals that investors tend to hold their assets and the selling pressure in the market is decreasing. This picture indicates that market sentiment is strengthening in a positive direction.
| Date | Exchange Inflow | Exchange Outflow | Exchange Netflow | Exchange Reserve | ETH Price |
|---|---|---|---|---|---|
| 16-Jul | 1,964,298 | 1,997,163 | -32,865 | 19,707,676 | 3,372 |
| 17-Jul | 1,880,531 | 1,881,686 | -1,154 | 19,706,521 | 3,479 |
| 18-Jul | 2,354,228 | 2,409,844 | -55,616 | 19,650,906 | 3,549 |
| 19-Jul | 638,604 | 673,676 | -35,072 | 19,615,834 | 3,594 |
| 20-Jul | 874,556 | 742,789 | 131,767 | 19,747,601 | 3,758 |
| 21-Jul | 1,778,372 | 1,878,818 | -100,447 | 19,647,154 | 3,764 |
| 22-Jul | 1,515,351 | 1,532,147 | -16,797 | 19,630,358 | 3,748 |
Fees and Revenues
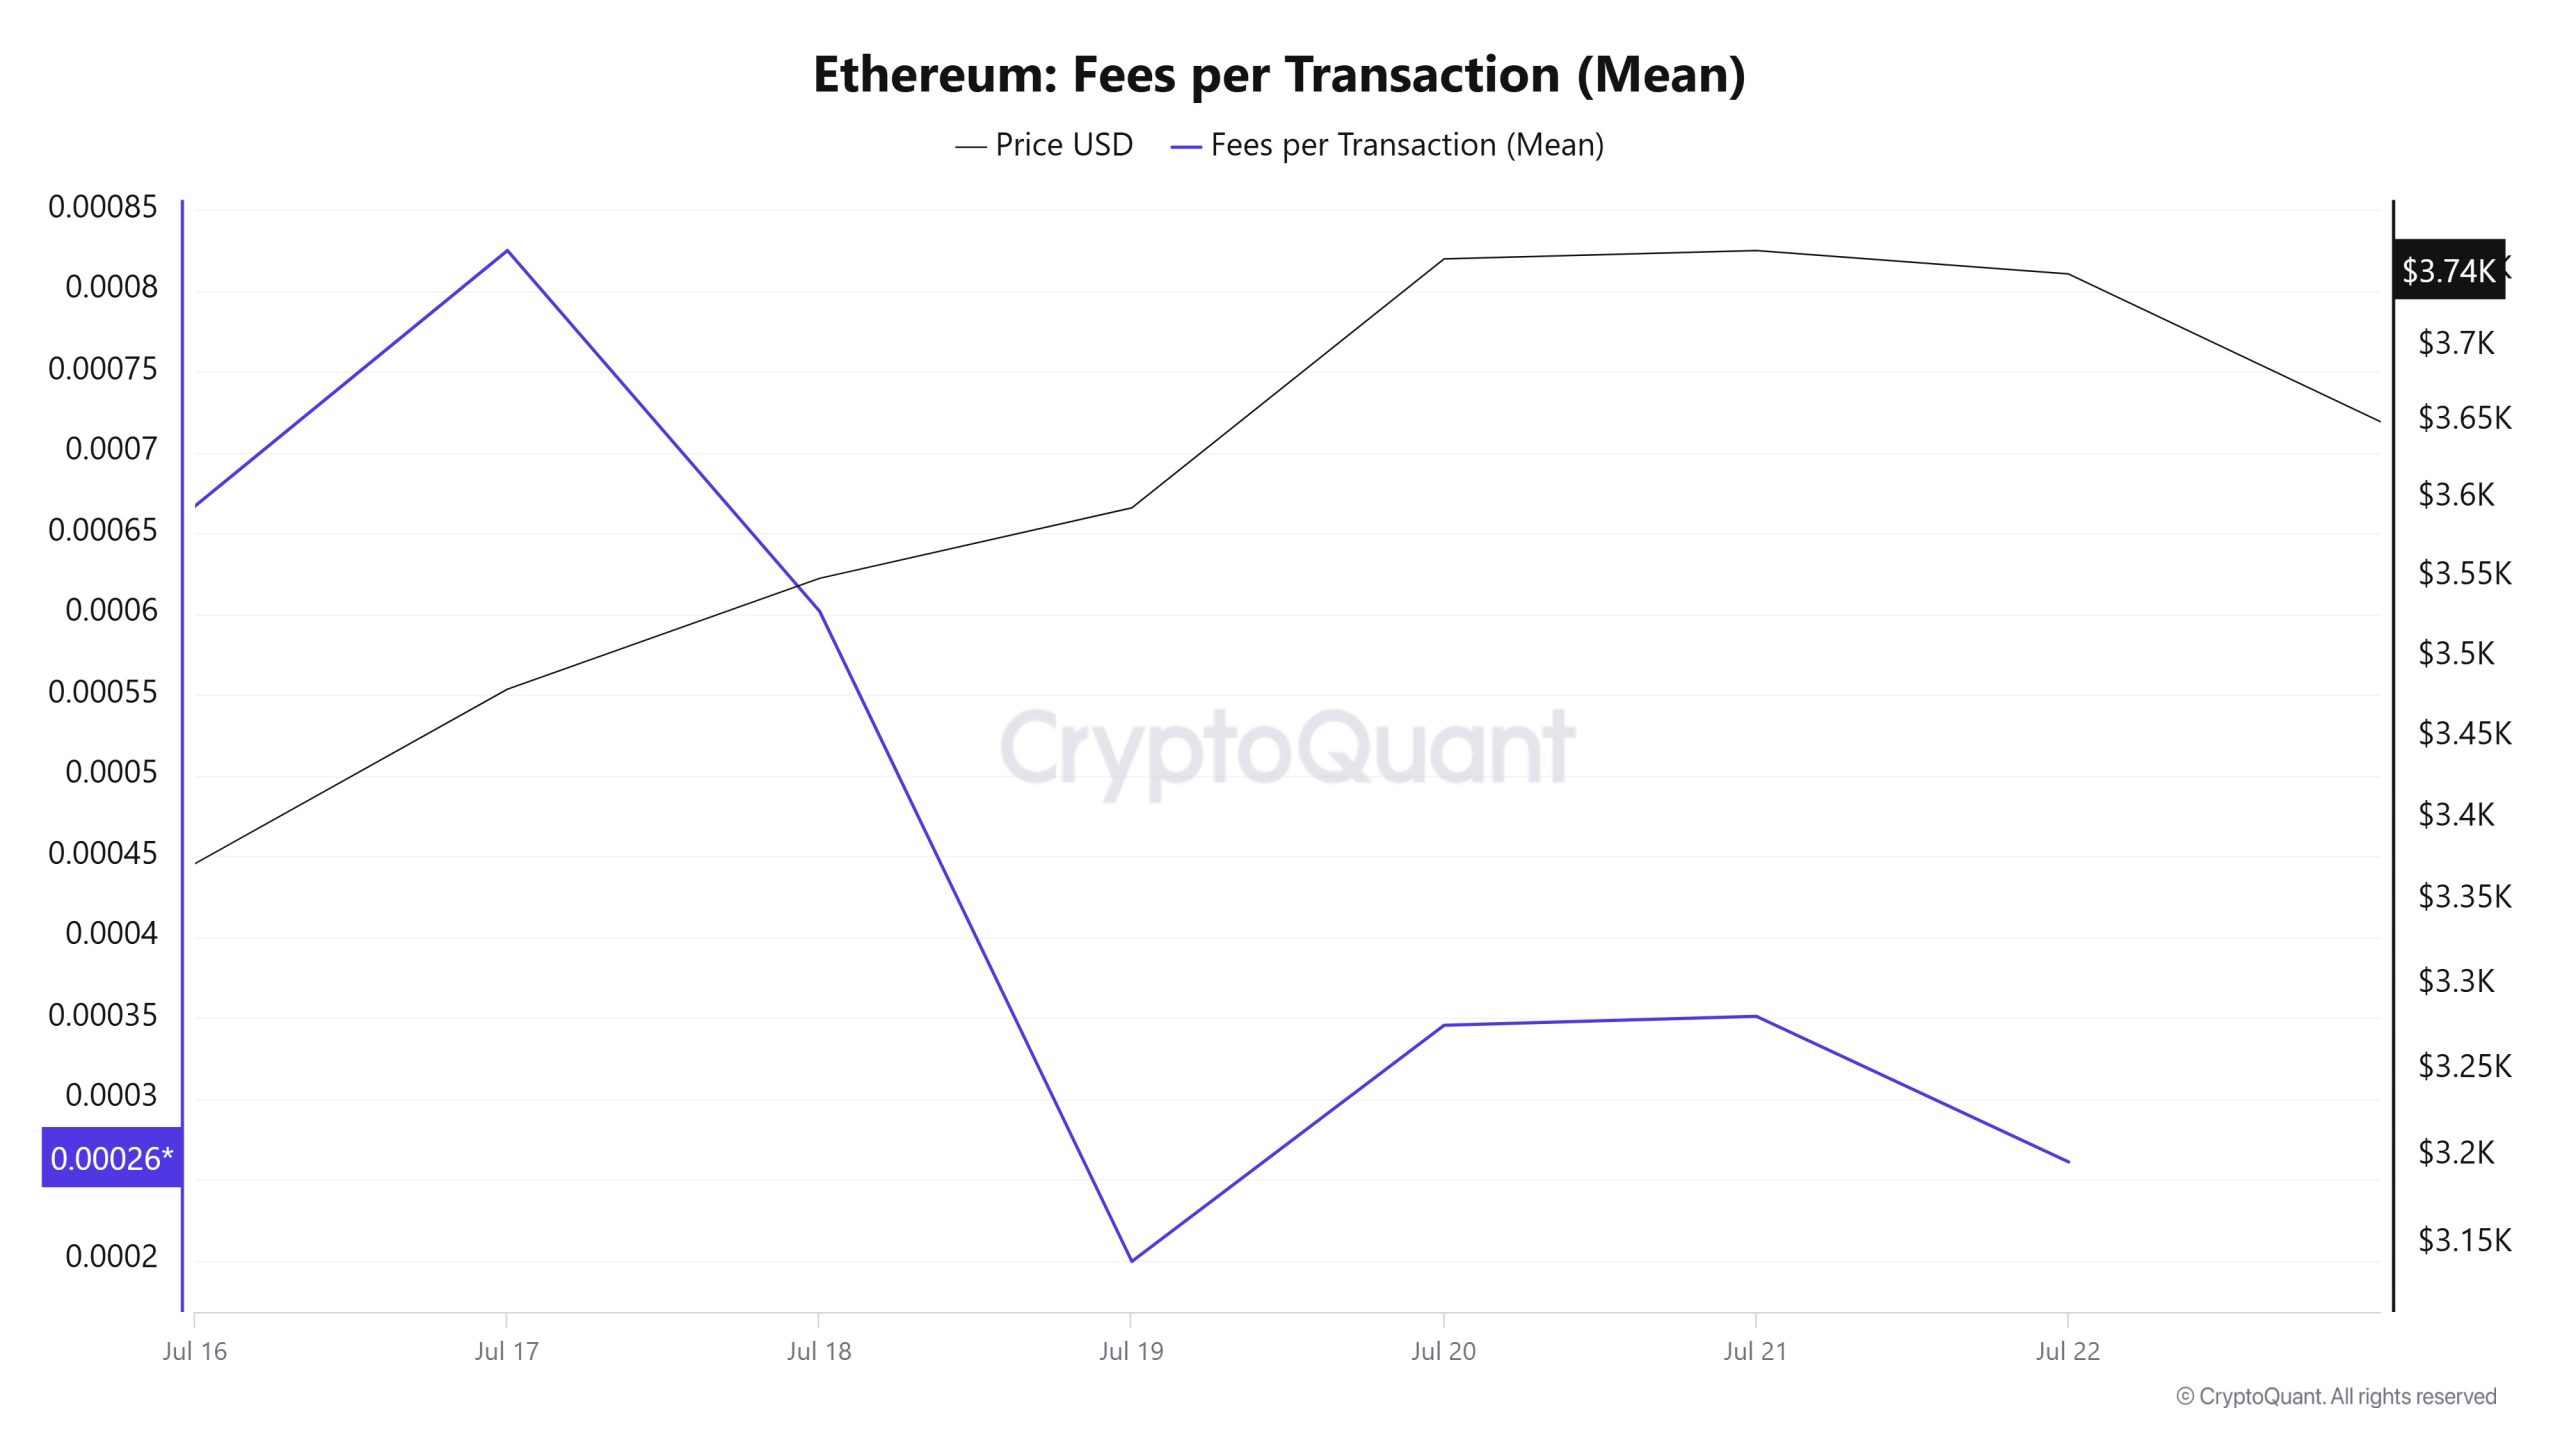
When the Ethereum Fees per Transaction (Mean) data between 16 and 22 July are examined, it is seen that this indicator was at the level of 0.000666891752305581 on 16 July, the first day of the week.
As of this date, a fluctuating course was observed with the effect of volatile movements in the Ethereum price; As of 19 July, it reached 0.000199424931470126, reaching the lowest level of the week.
In the following days, Ethereum Fees per Transaction (Mean) started to rise again and closed at 0.000260990160554954 on 22 July, the last day of the week.
Bitcoin: Fees (Total)
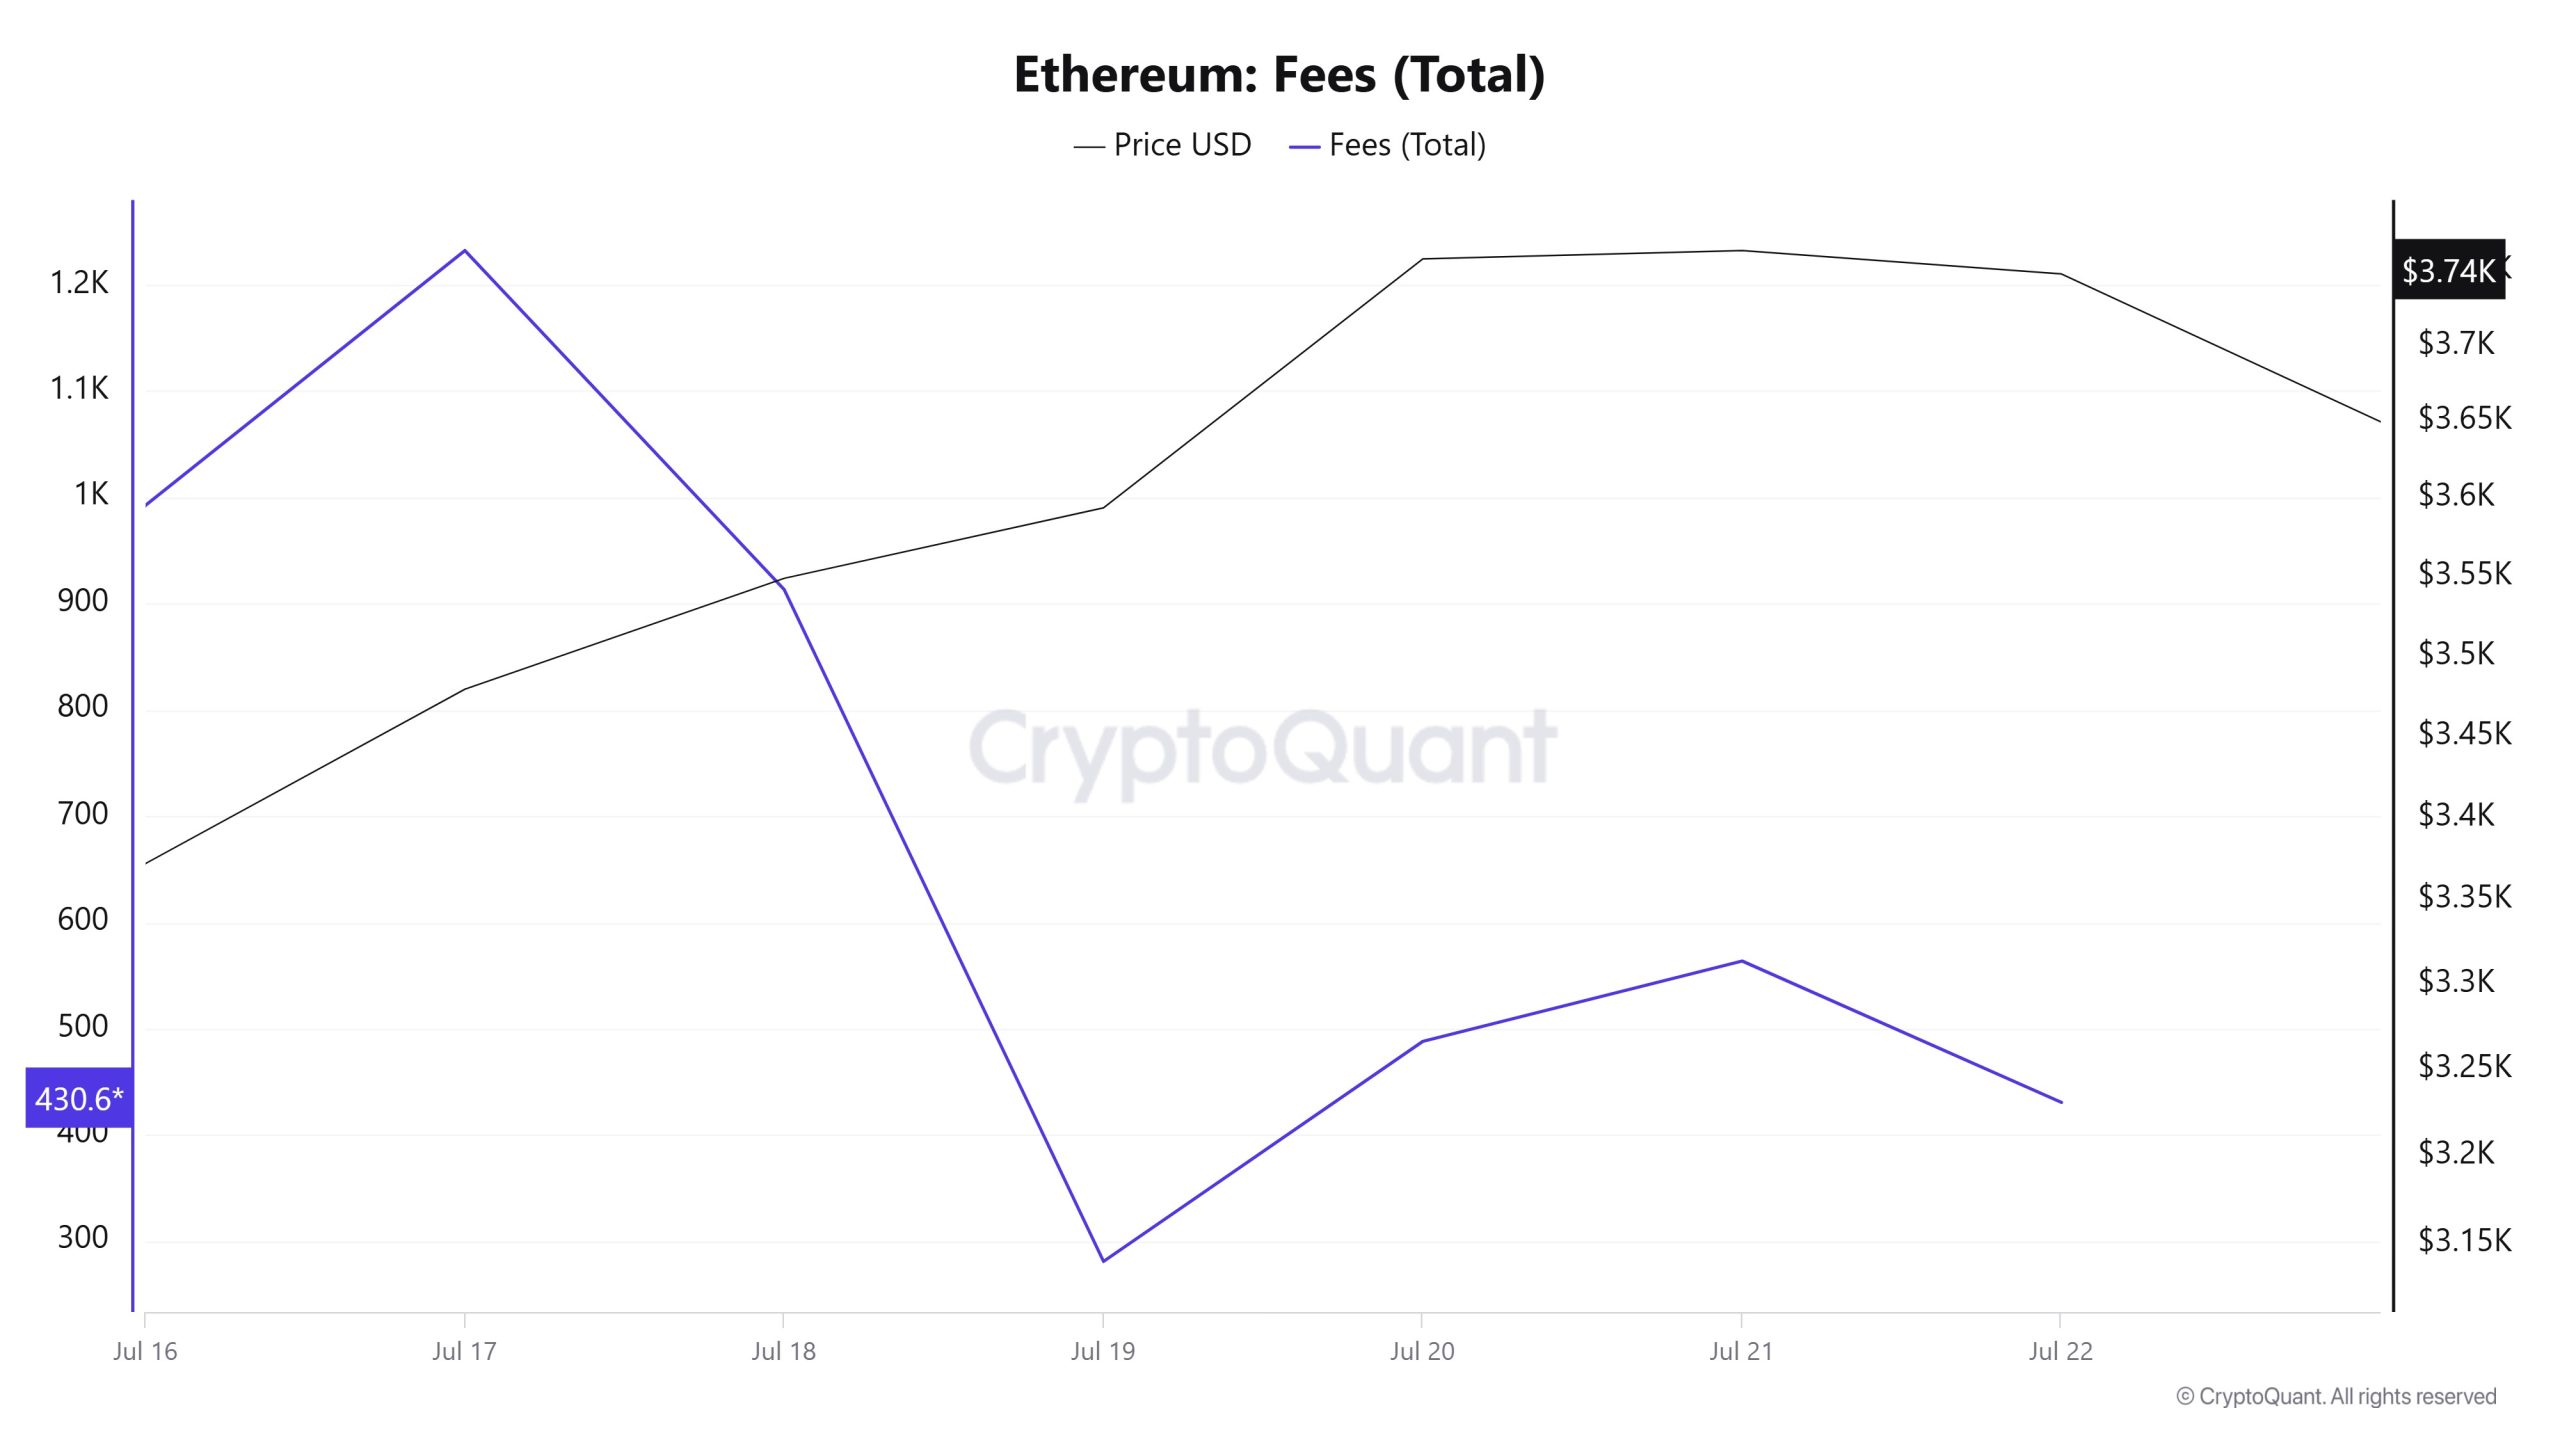
Similarly, when Ethereum Fees (Total) data between 16 and 22 July are examined, it is seen that this indicator was 992.5223240131019 on 16 July, the first day of the week.
As of this date, a fluctuating course was observed due to the volatile movements in the Ethereum price; As of 19 July, it reached 280.9753698463413, reaching the lowest level of the week.
In the following days, Ethereum Fees (Total) started to rise again and closed at 430.618366496202 on 22 July, the last day of the week.
Blocks Mined
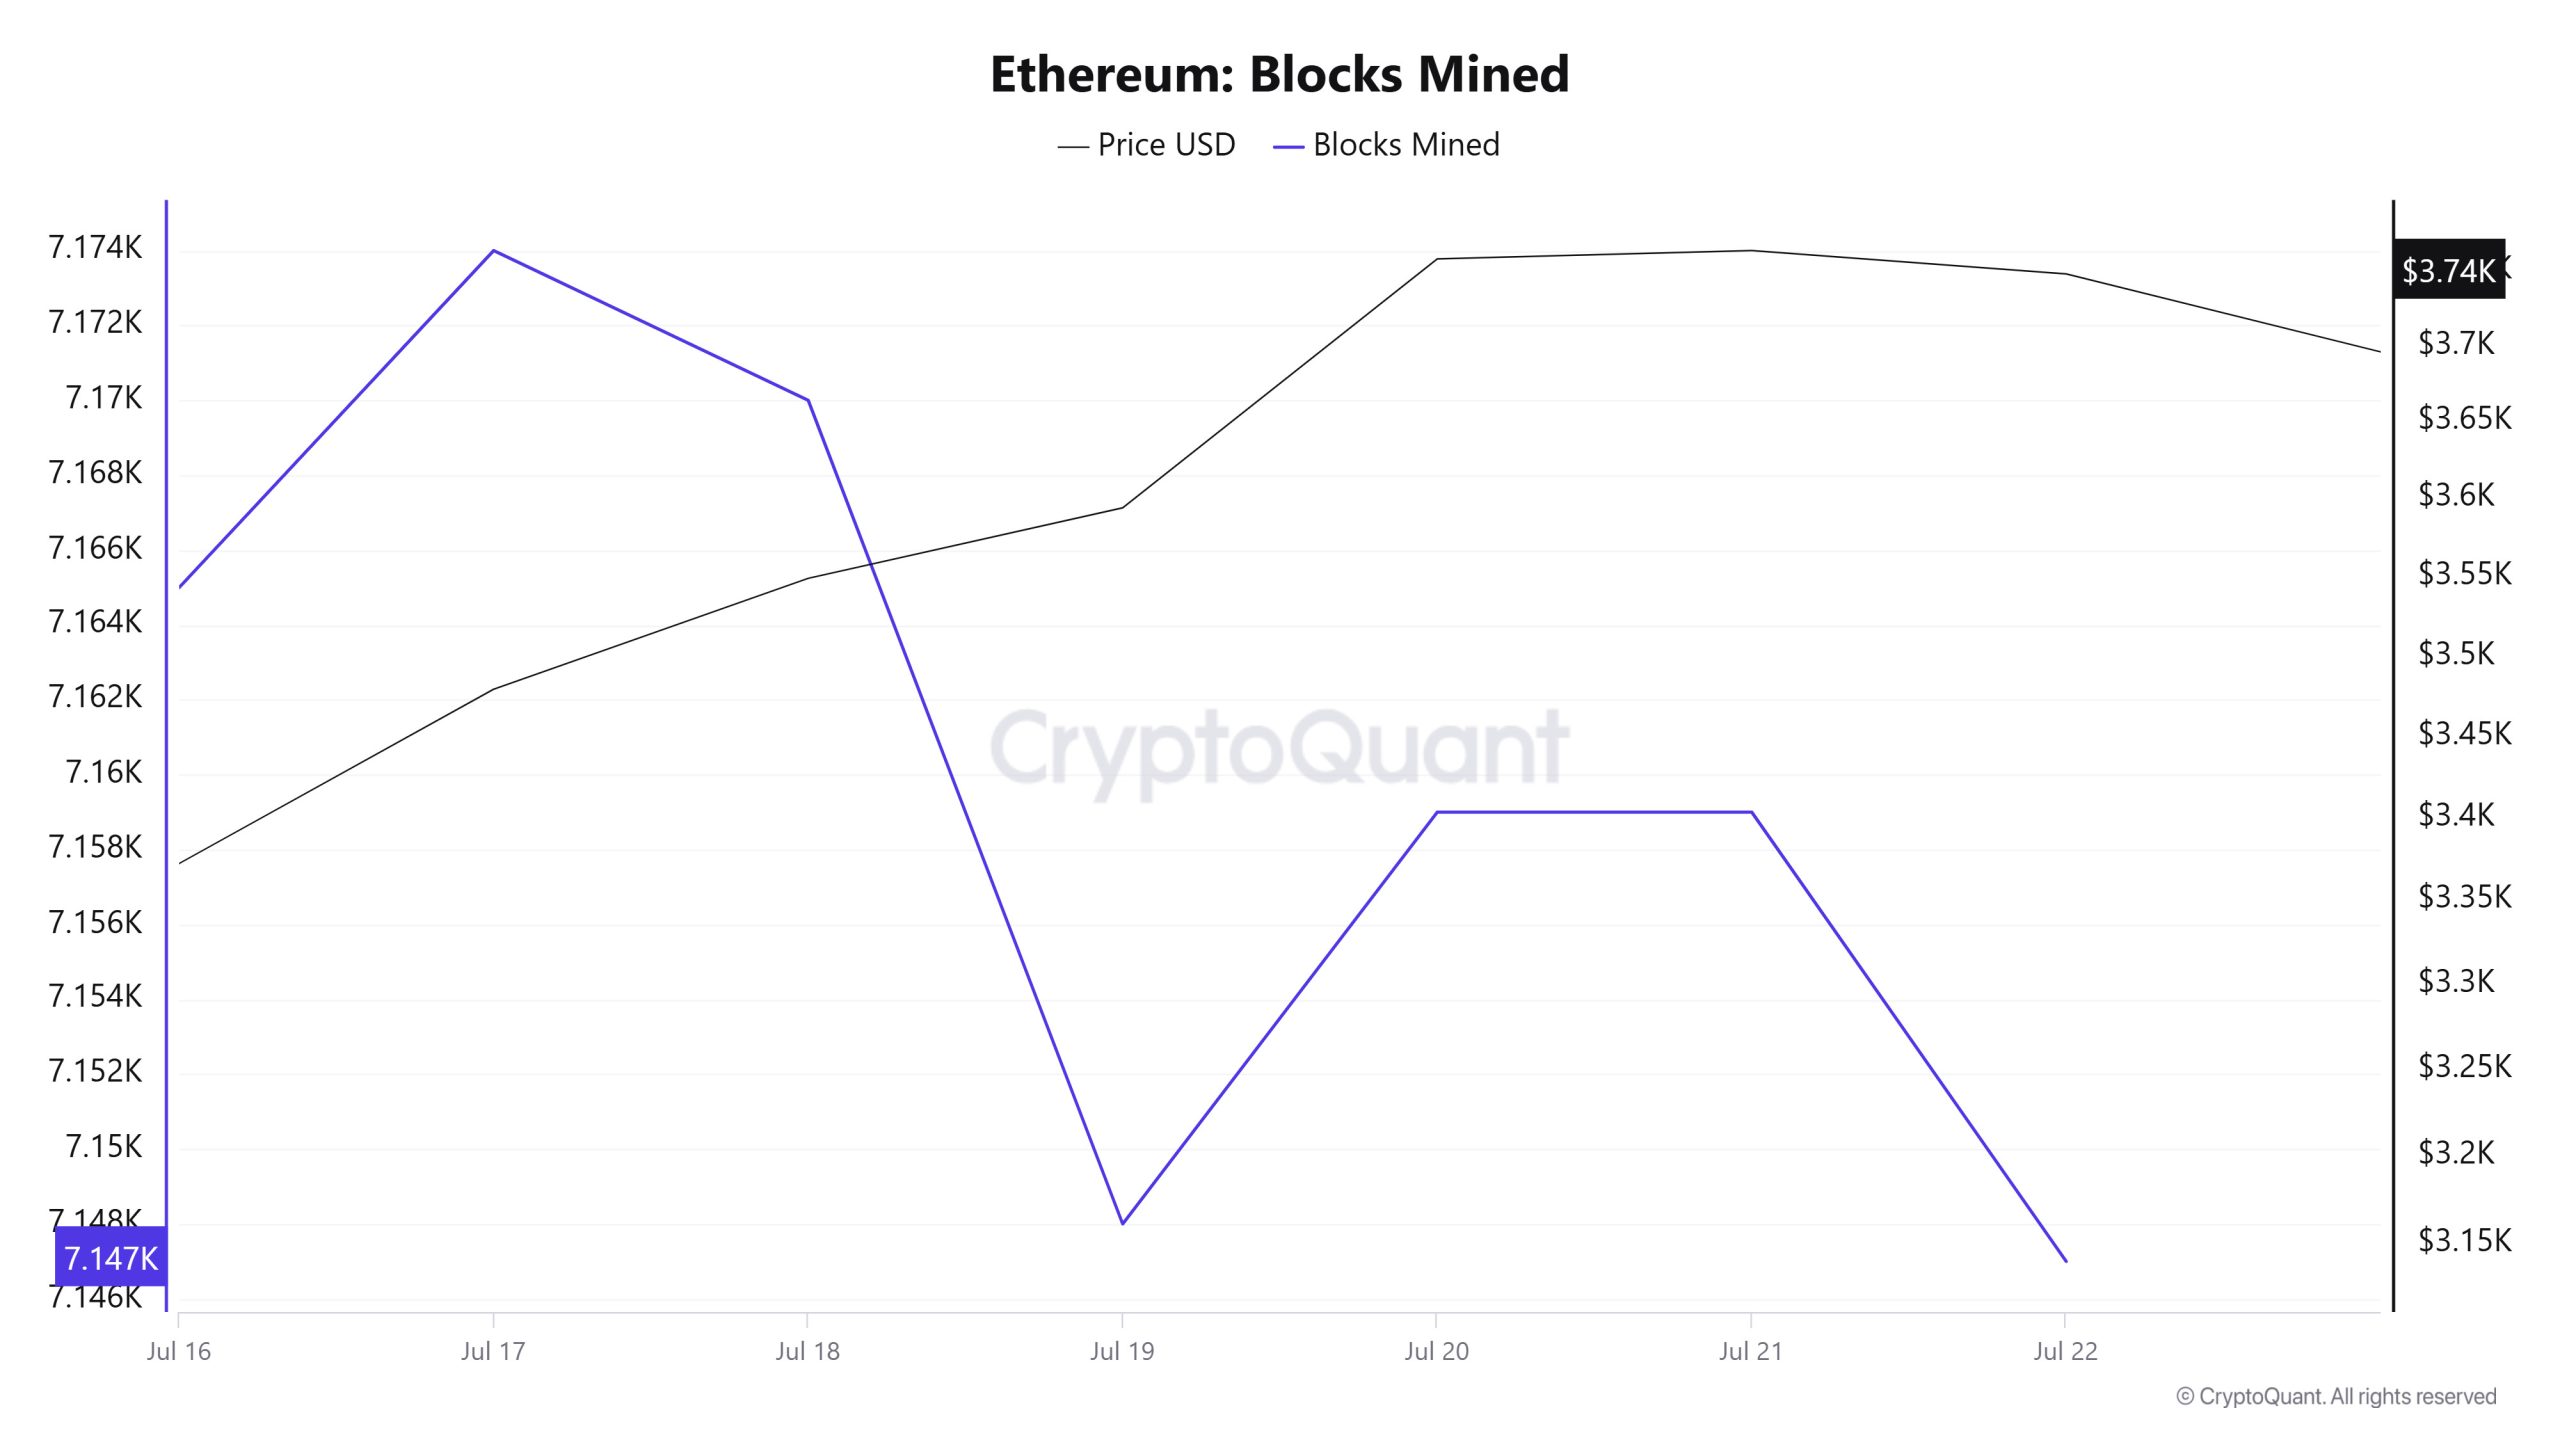
When the Ethereum block production data between 16 – 22 July is examined, there was a slight decrease throughout the week. While 7,165 blocks were produced on 16 July, this number decreased to 7,147 as of 22 July. A positive correlation was observed between the Ethereum price and the number of block production throughout the week.
Block Size

When the Ethereum block size data between 16 – 22 July is examined, it has been observed that it has made a serious increase throughout the week. On 16 July, the average block size was 93,624 bytes, while this value decreased to 115,527 bytes as of 22 July. This increase indicates an increase in the transaction density on the Ethereum network. In the relevant period, a positive correlation was observed between block size and Ethereum price throughout the week.
Block Interval
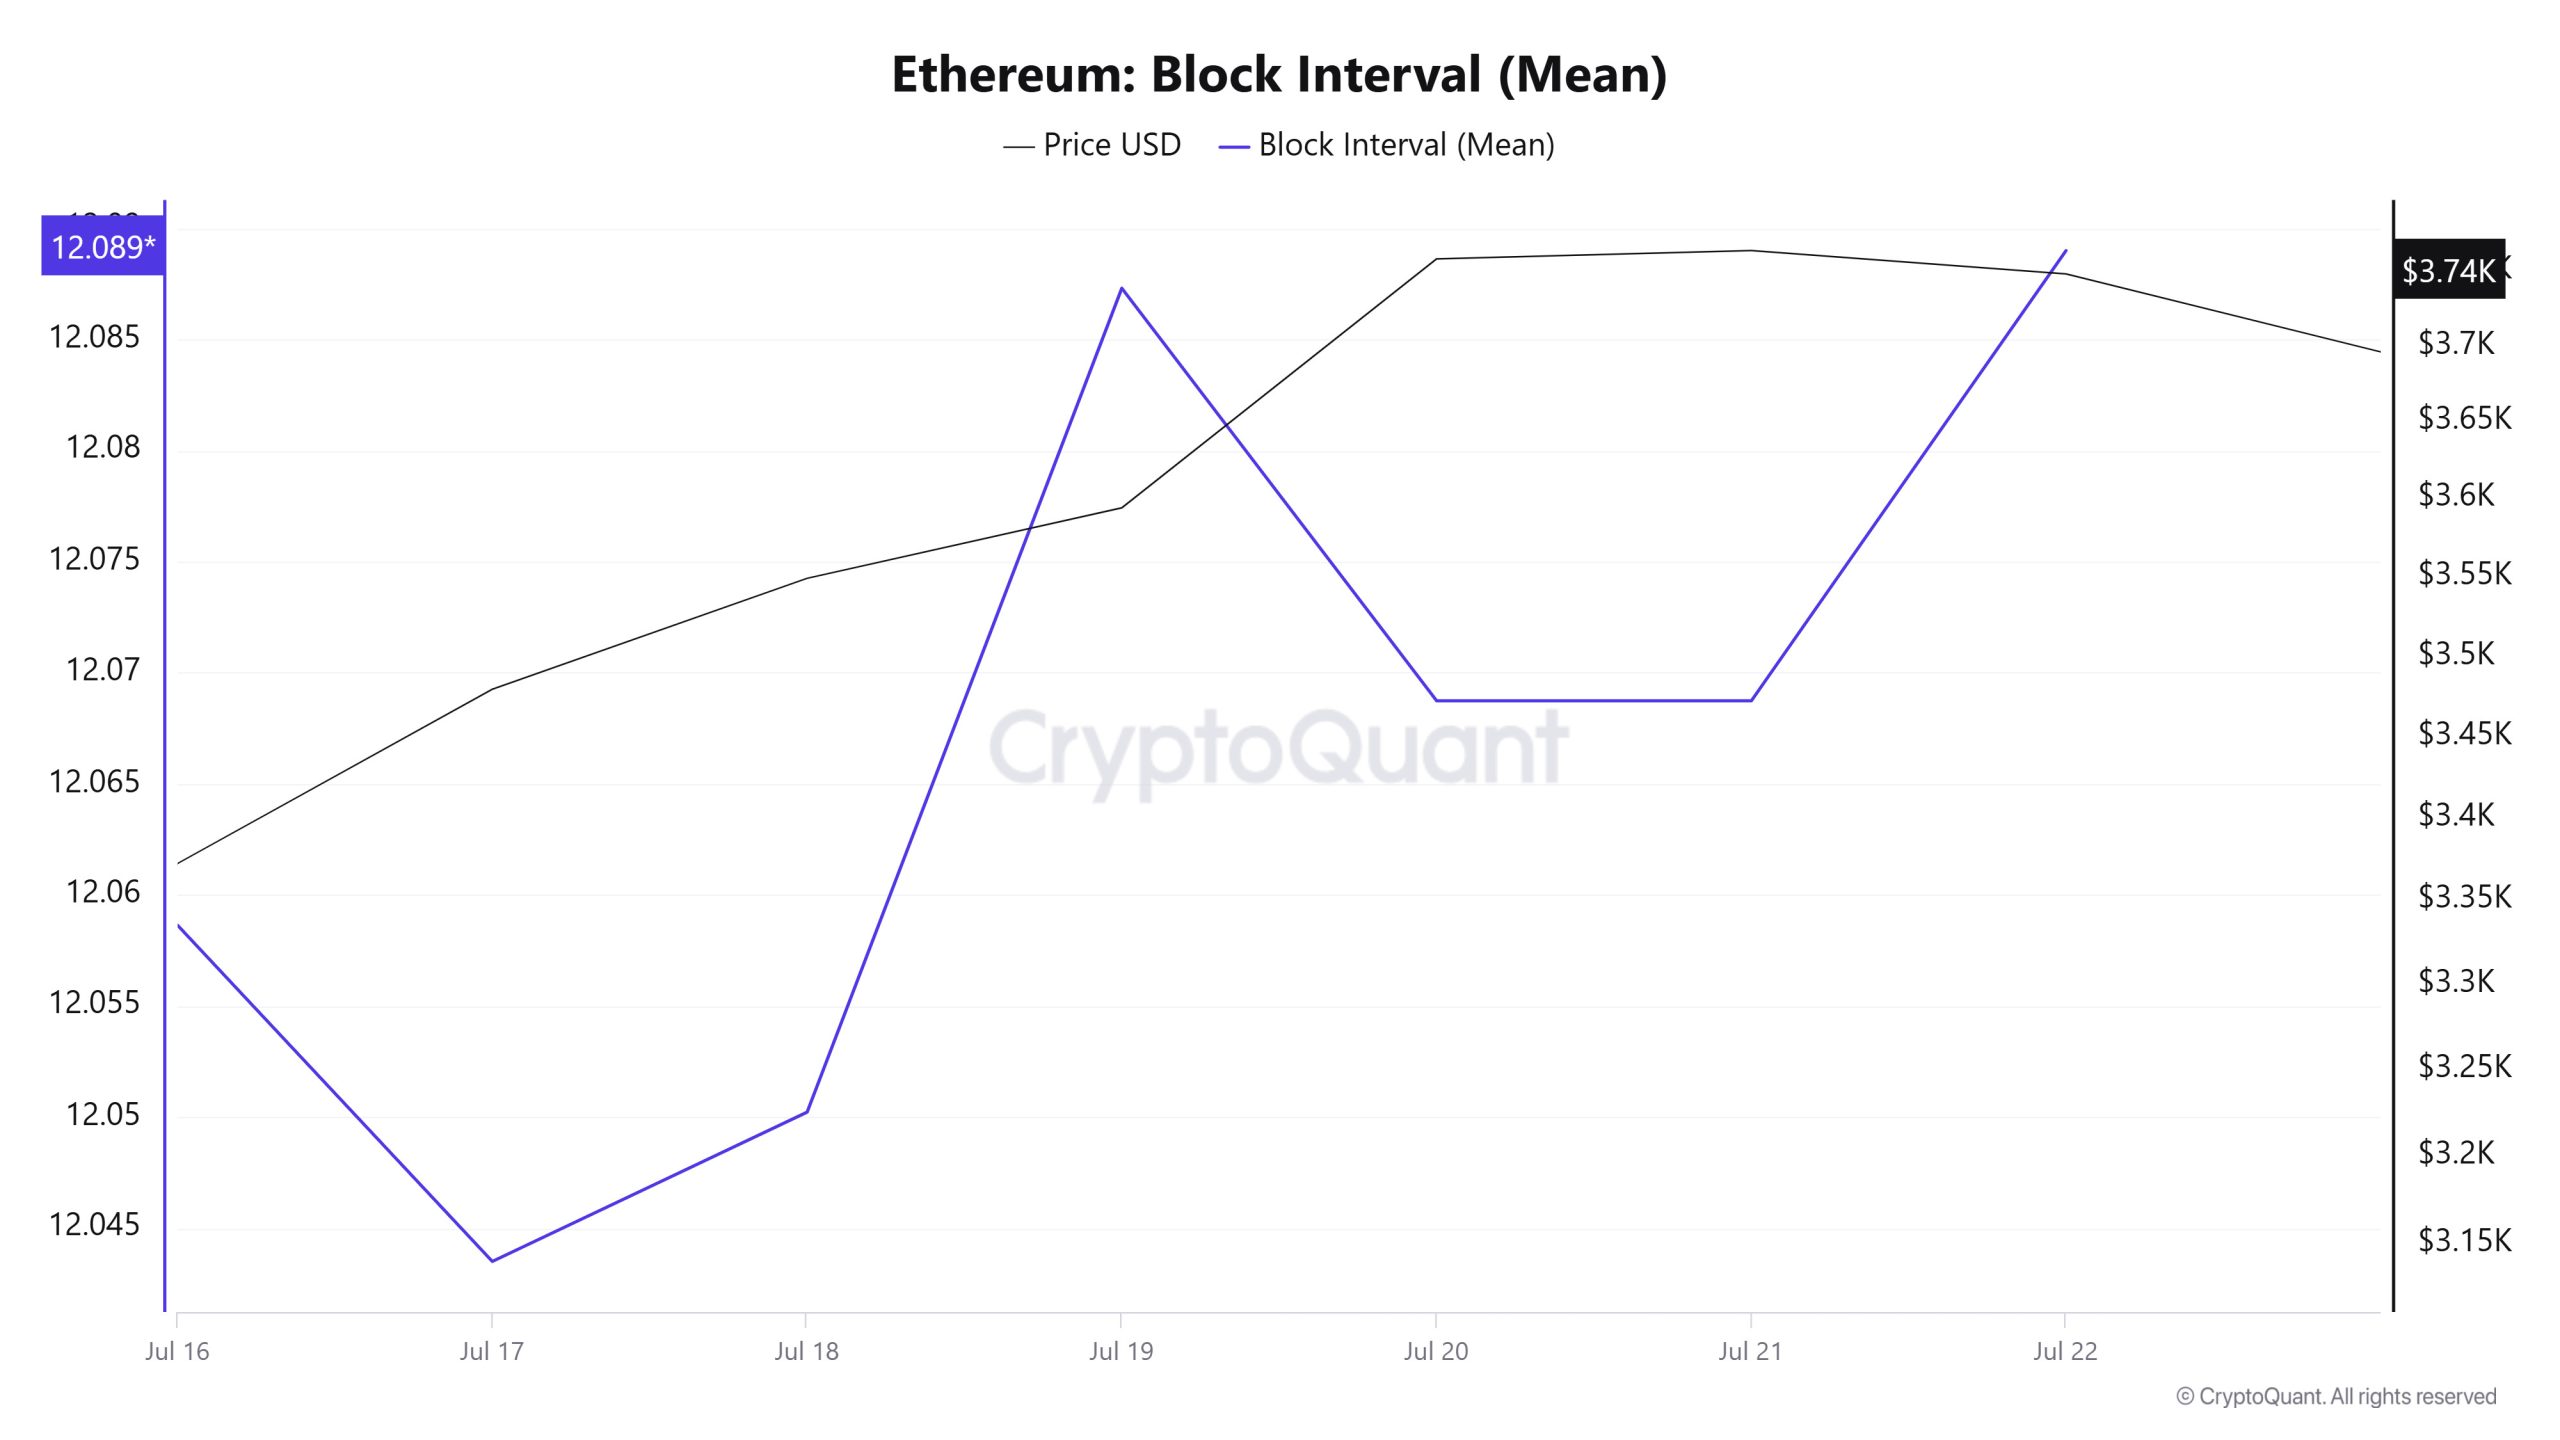
When the Ethereum block data between 16 – 22 July is examined, there has been some increase throughout the week. While the average block time was recorded as 12.05 seconds on 16 July, this time increased to 12.08 seconds as of 22 July. In the period in question, there was a negative correlation between Ethereum block duration and price movement throughout the week.
Transaction
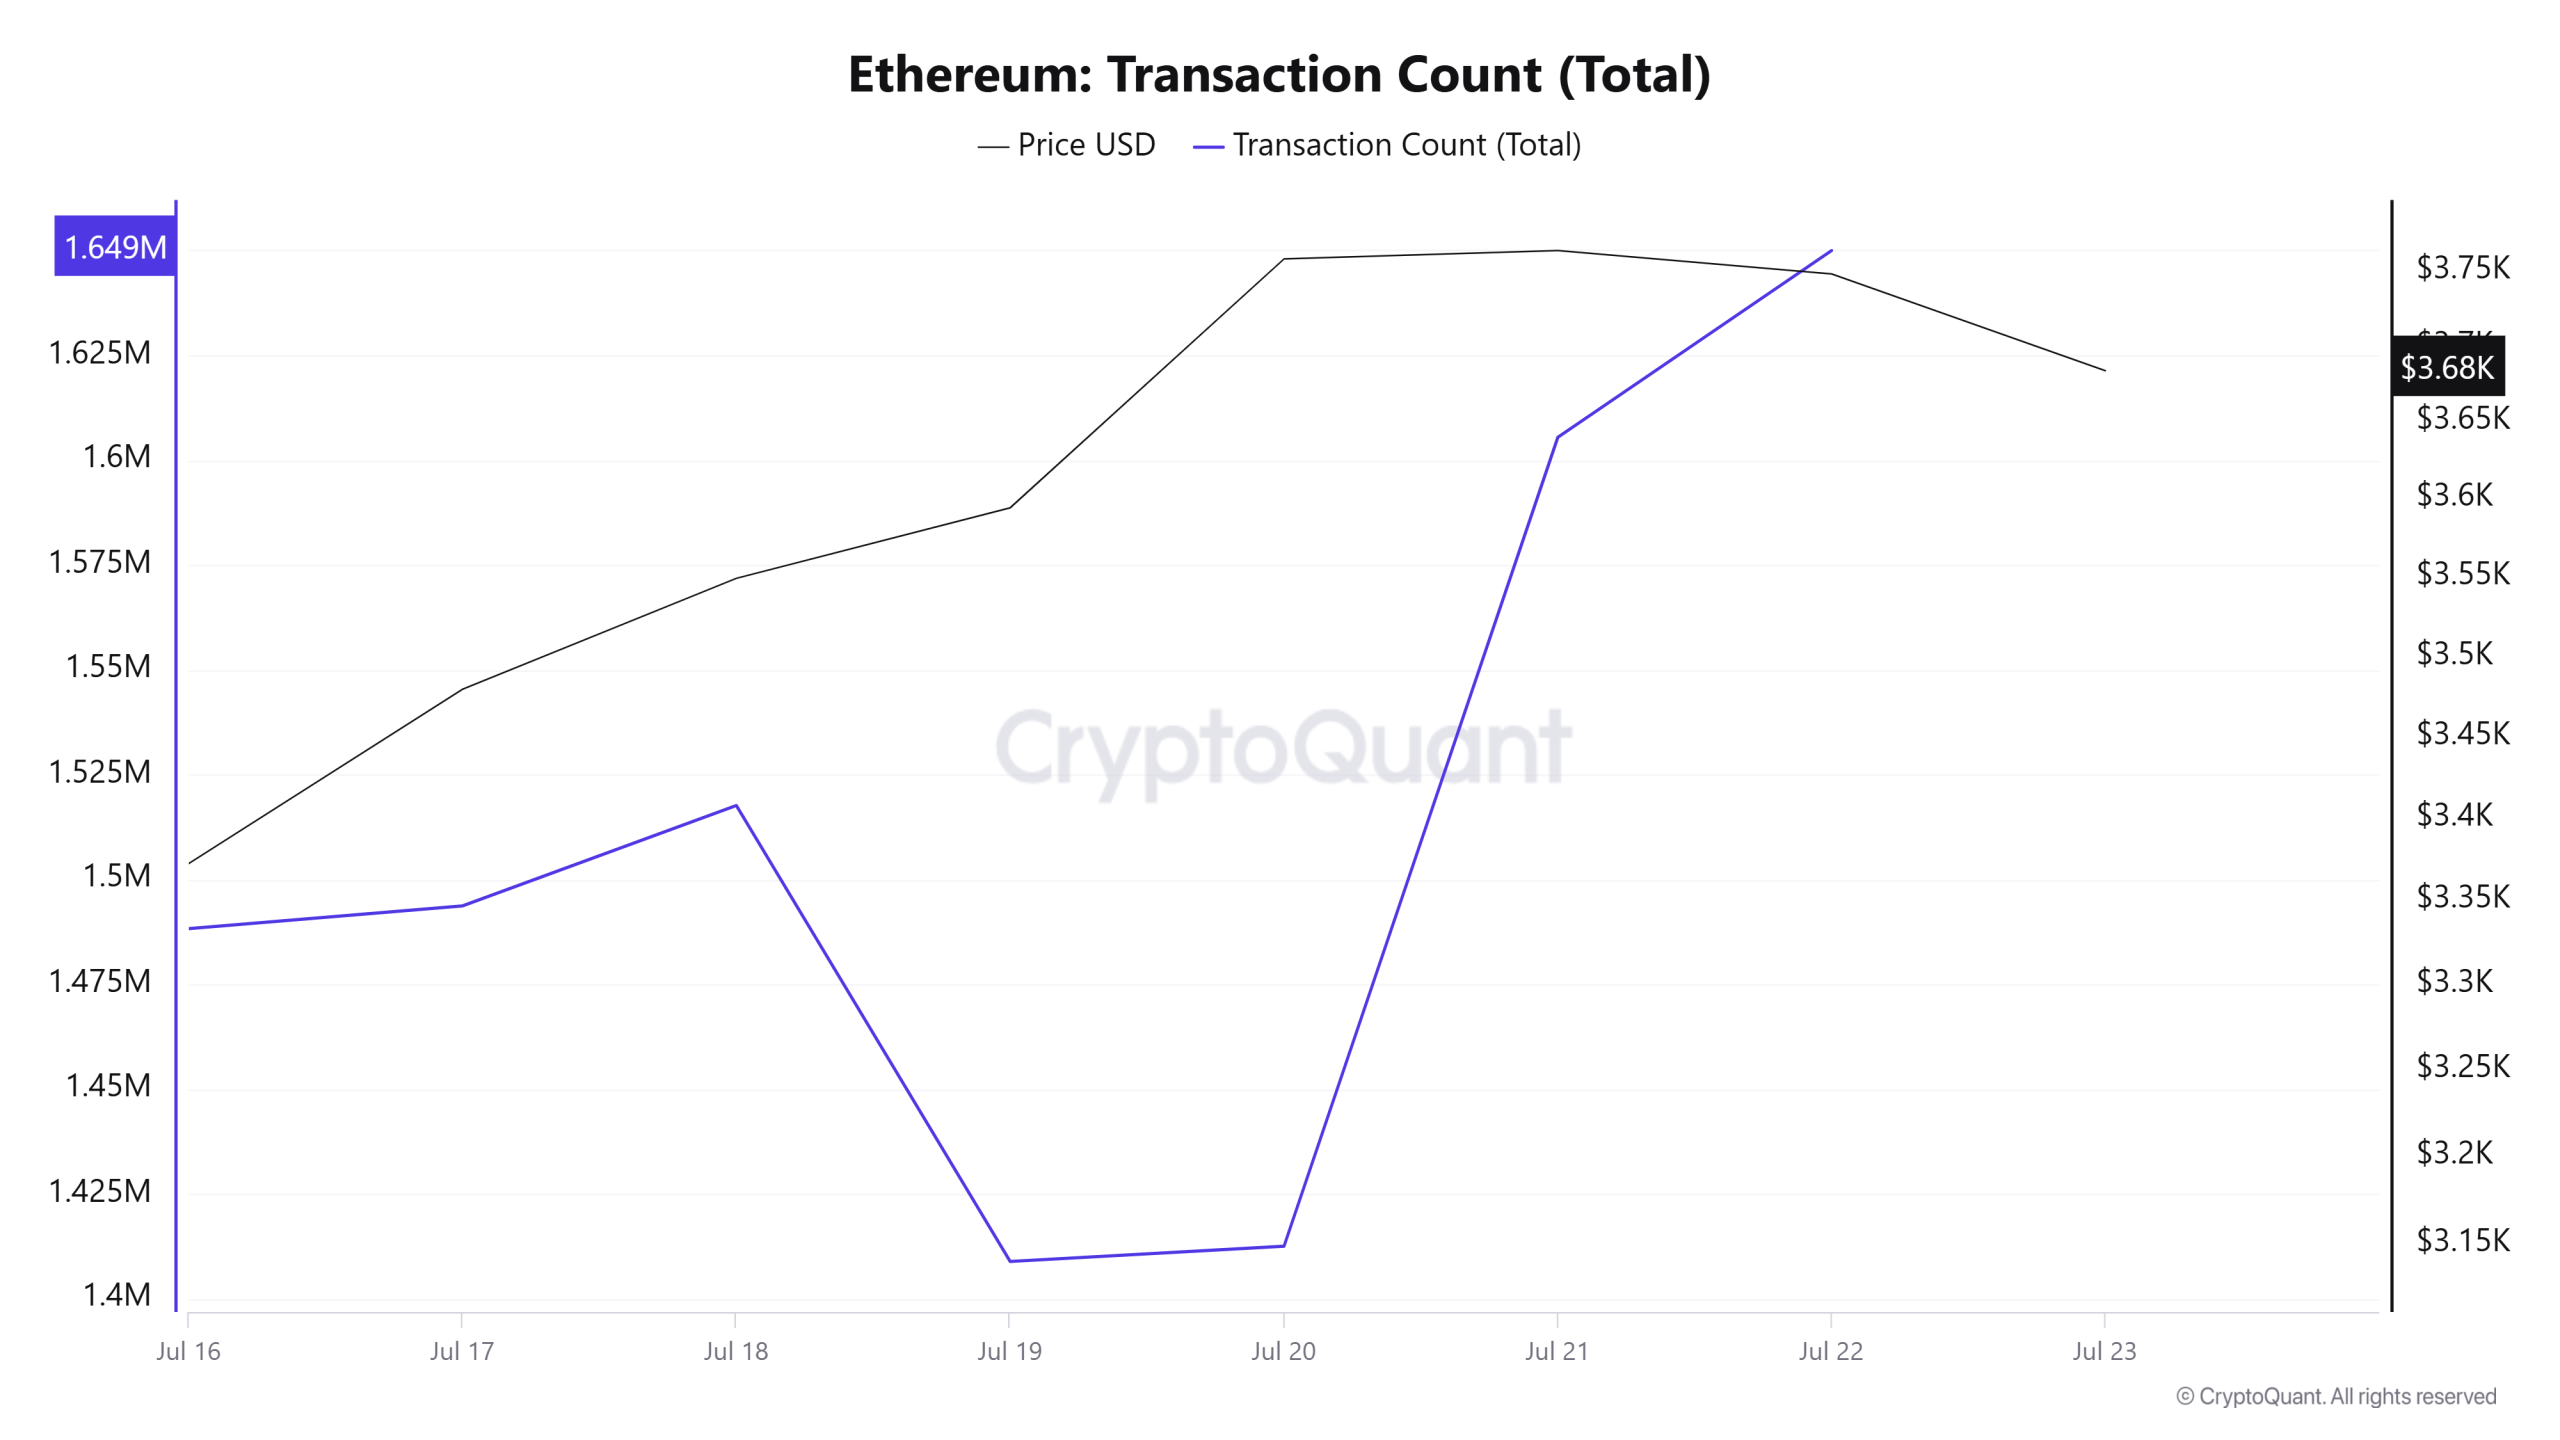
Last week, a total of 10,143,208 transactions were executed on the Ethereum network, while this week that number increased by about 4.27% to 10,576,447. The highest weekly transaction count was 1,649,941 on July 22, while the lowest was 1,408,928 on July 19.
This change in the number of transactions shows that the usage on the network continues to increase and accordingly, Ethereum burns have also increased compared to last week. The correlation between the price and the number of transactions was generally stable throughout the week.
Tokens Transferred
Last week, the total amount of ETH transferred on the Ethereum network was 17,183,427, while this week this amount increased by approximately 30.1% to 22,354,842. 5,159,365 ETH transfers on July 18th was the highest daily token transfer amount of the week, while July 19th saw the lowest value of the week with only 1,236,734 ETH transferred. Throughout the week, the relationship between price and the amount of tokens transferred showed a positive weighted correlation.
The increase in the number of transfers in use of the network, as well as the rise in the amount of tokens transferred, clearly demonstrates the overall increase in user activity and transaction volume on the Ethereum network.
The relationship between the amount of tokens transferred and the number of transactions shows that the number of high-volume transactions is increasing. This is a strong sign that Ethereum is expanding its user base on DeFi, NFT and other Web3 applications. The acceleration of liquidity movement on the network suggests that users are conducting more transactions and that the Ethereum ecosystem remains vibrant.
Estimated Leverage Ratio
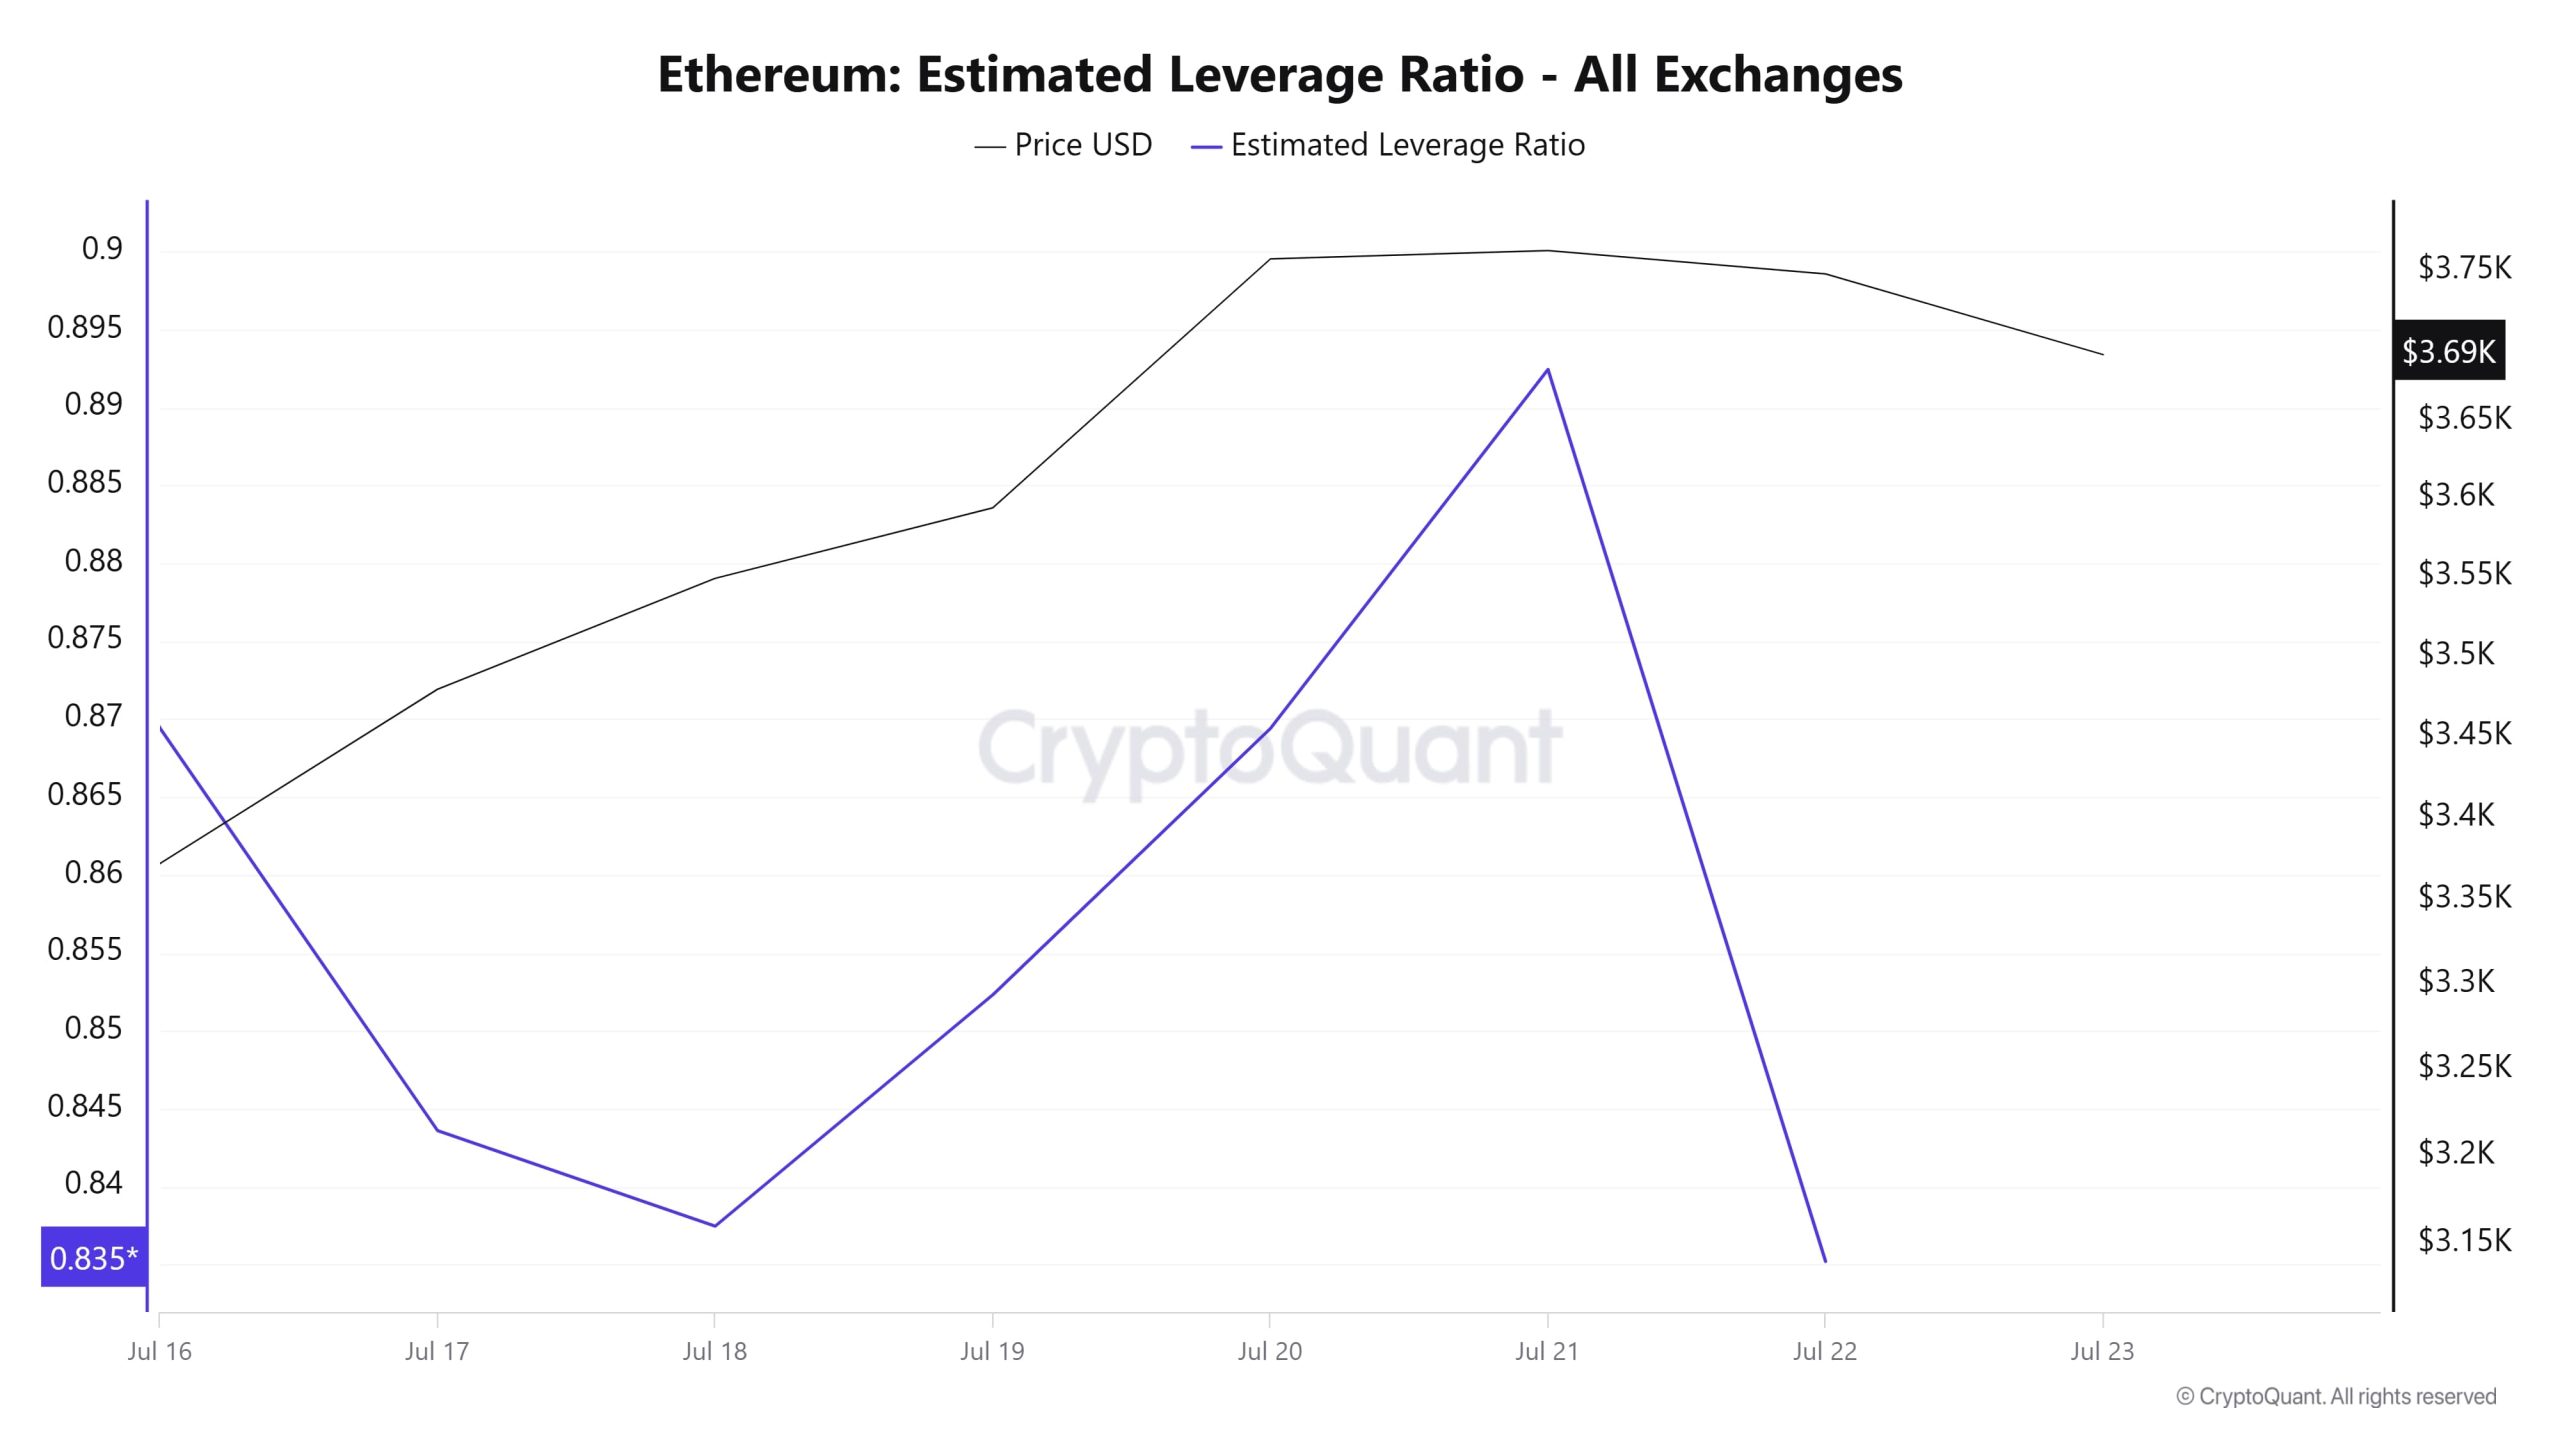
During the 7-day period, the metric generally fell during the first part of the process. ELR (Estimated Leverage Ratio), which had a value of 0.869 at the beginning of the process, fell to 0.837 on July 18. After the rest of the process, the metric started to rise, reaching a peak of 0.892 on July 21. It then declined, reaching a low point of 0.835 at the time of writing. A higher ELR means that participants are willing to take on more risk and generally indicates bullish conditions or expectations. It should be noted that these rallies can also be caused by dwindling reserves. When we look at Ethereum reserves, there were 19.70 million reserves at the beginning of the process, while this figure fluctuated during the rest of the process and is currently 19.56 million. At the same time, Ethereum’s Open Interest is seen as 46.00 billion dollars at the beginning of the process. As of now, the volume has increased in the process and the open interest value stands out as 56.00 billion dollars. With all this data, the ELR metric retreated towards the end of the process. The price of the asset, on the other hand, experienced the highest point of the process with all this data on July 21 and set it at $ 3,855. It realized its lowest point at the beginning of the process and was priced at $ 3.100. As of now, there is a decrease in the increase in the risk appetite of investors and traders. This was reflected in the price, causing the price to fall to the level of $ 3.675 as of now. The fluctuations in the ELR ratio throughout the process show us that although the open interest has increased, the increase in volume is not only due to buying but also to selling transactions. On the other hand, the downward movement of reserves explains the increase in the ELR ratio in the middle of the process. As a result, as a result of the decrease in reserves and the increase in open interest, it shows that the market has lost its appetite at the moment and has a bearish approach.
ETH Onchain Overall
| Metric | Positive 📈 | Negative 📉 | Neutral ➖ |
|---|---|---|---|
| Active Addresses | ✓ | ||
| Total Value Staked | ✓ | ||
| Derivatives | ✓ | ||
| Supply Distribution | ✓ | ||
| Exchange Reserve | ✓ | ||
| Fees and Revenues | ✓ | ||
| Bloks Mined | ✓ | ||
| Transaction | ✓ | ||
| Estimated Leverage Ratio | ✓ |
*The metrics and guidance in the table do not, by themselves, describe or imply an expectation of future price changes for any asset. The prices of digital assets may vary depending on many different variables. The onchain analysis and related guidance are intended to assist investors in their decision-making process, and making financial investments based solely on the results of this analysis may result in harmful transactions. Even if all metrics produce a positive, negative or neutral result at the same time, the expected results may not be seen depending on market conditions. Investors who review the report should take these warnings into consideration.
Legal Notice
The investment information, comments and recommendations contained in this document do not constitute investment advisory services. Investment advisory services are provided by authorized institutions on a personal basis, taking into account the risk and return preferences of individuals. The comments and recommendations contained in this document are of a general type. These recommendations may not be suitable for your financial situation and risk and return preferences. Therefore, making an investment decision based solely on the information contained in this document may not result in results that are in line with your expectations.
NOTE: All data used in Ethereum onchain analysis is based on Cryptoqaunt.