
Active Adresses
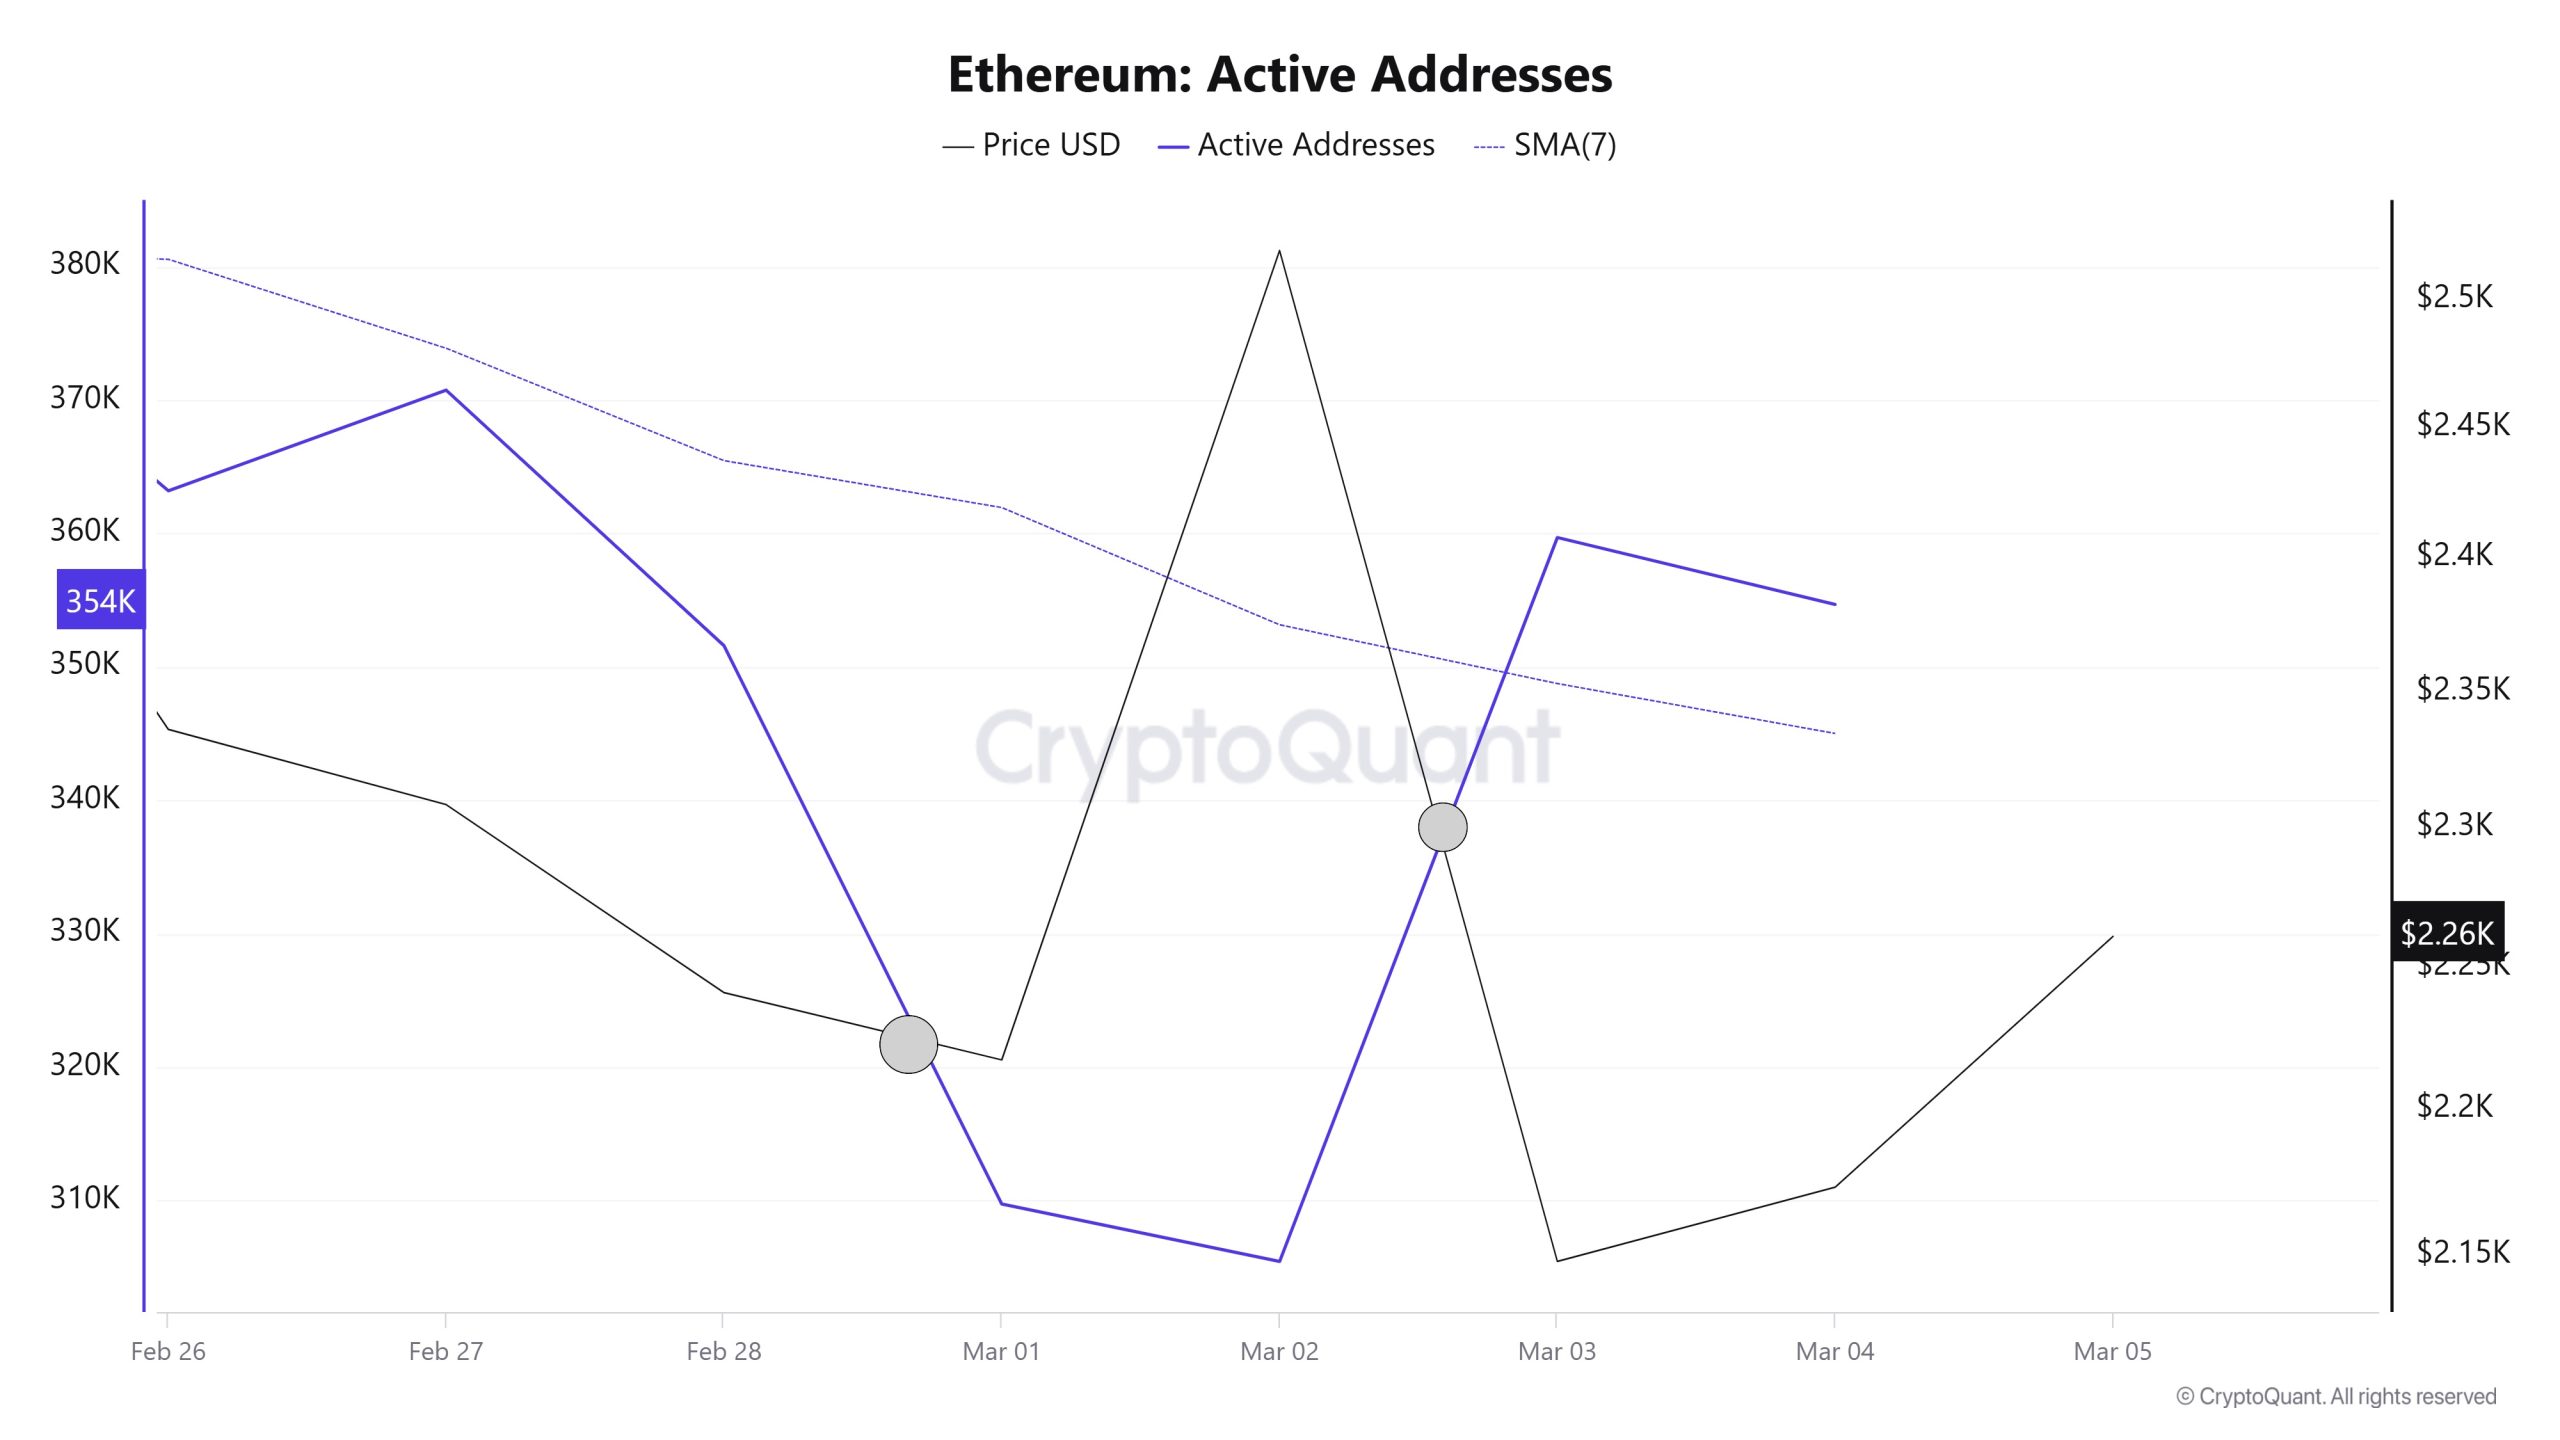
In the number of active addresses, there were 359,688 active entries to the ETH network between Febbraio 26 and Febbraio 5, 2025 this week. During this period, Ethereum fell from $2,519 to $2,147. In the region marked on the chart, where the price and the number of active addresses intersect, Ethereum purchases are gradually decreasing. When we follow the 7-day simple moving average, it is observed that the price follows a downward trend on the dates when this average cuts the price. This situation indicates that the Ethereum price is experiencing entries from the $ 2,150 levels
Active Sending Addresses
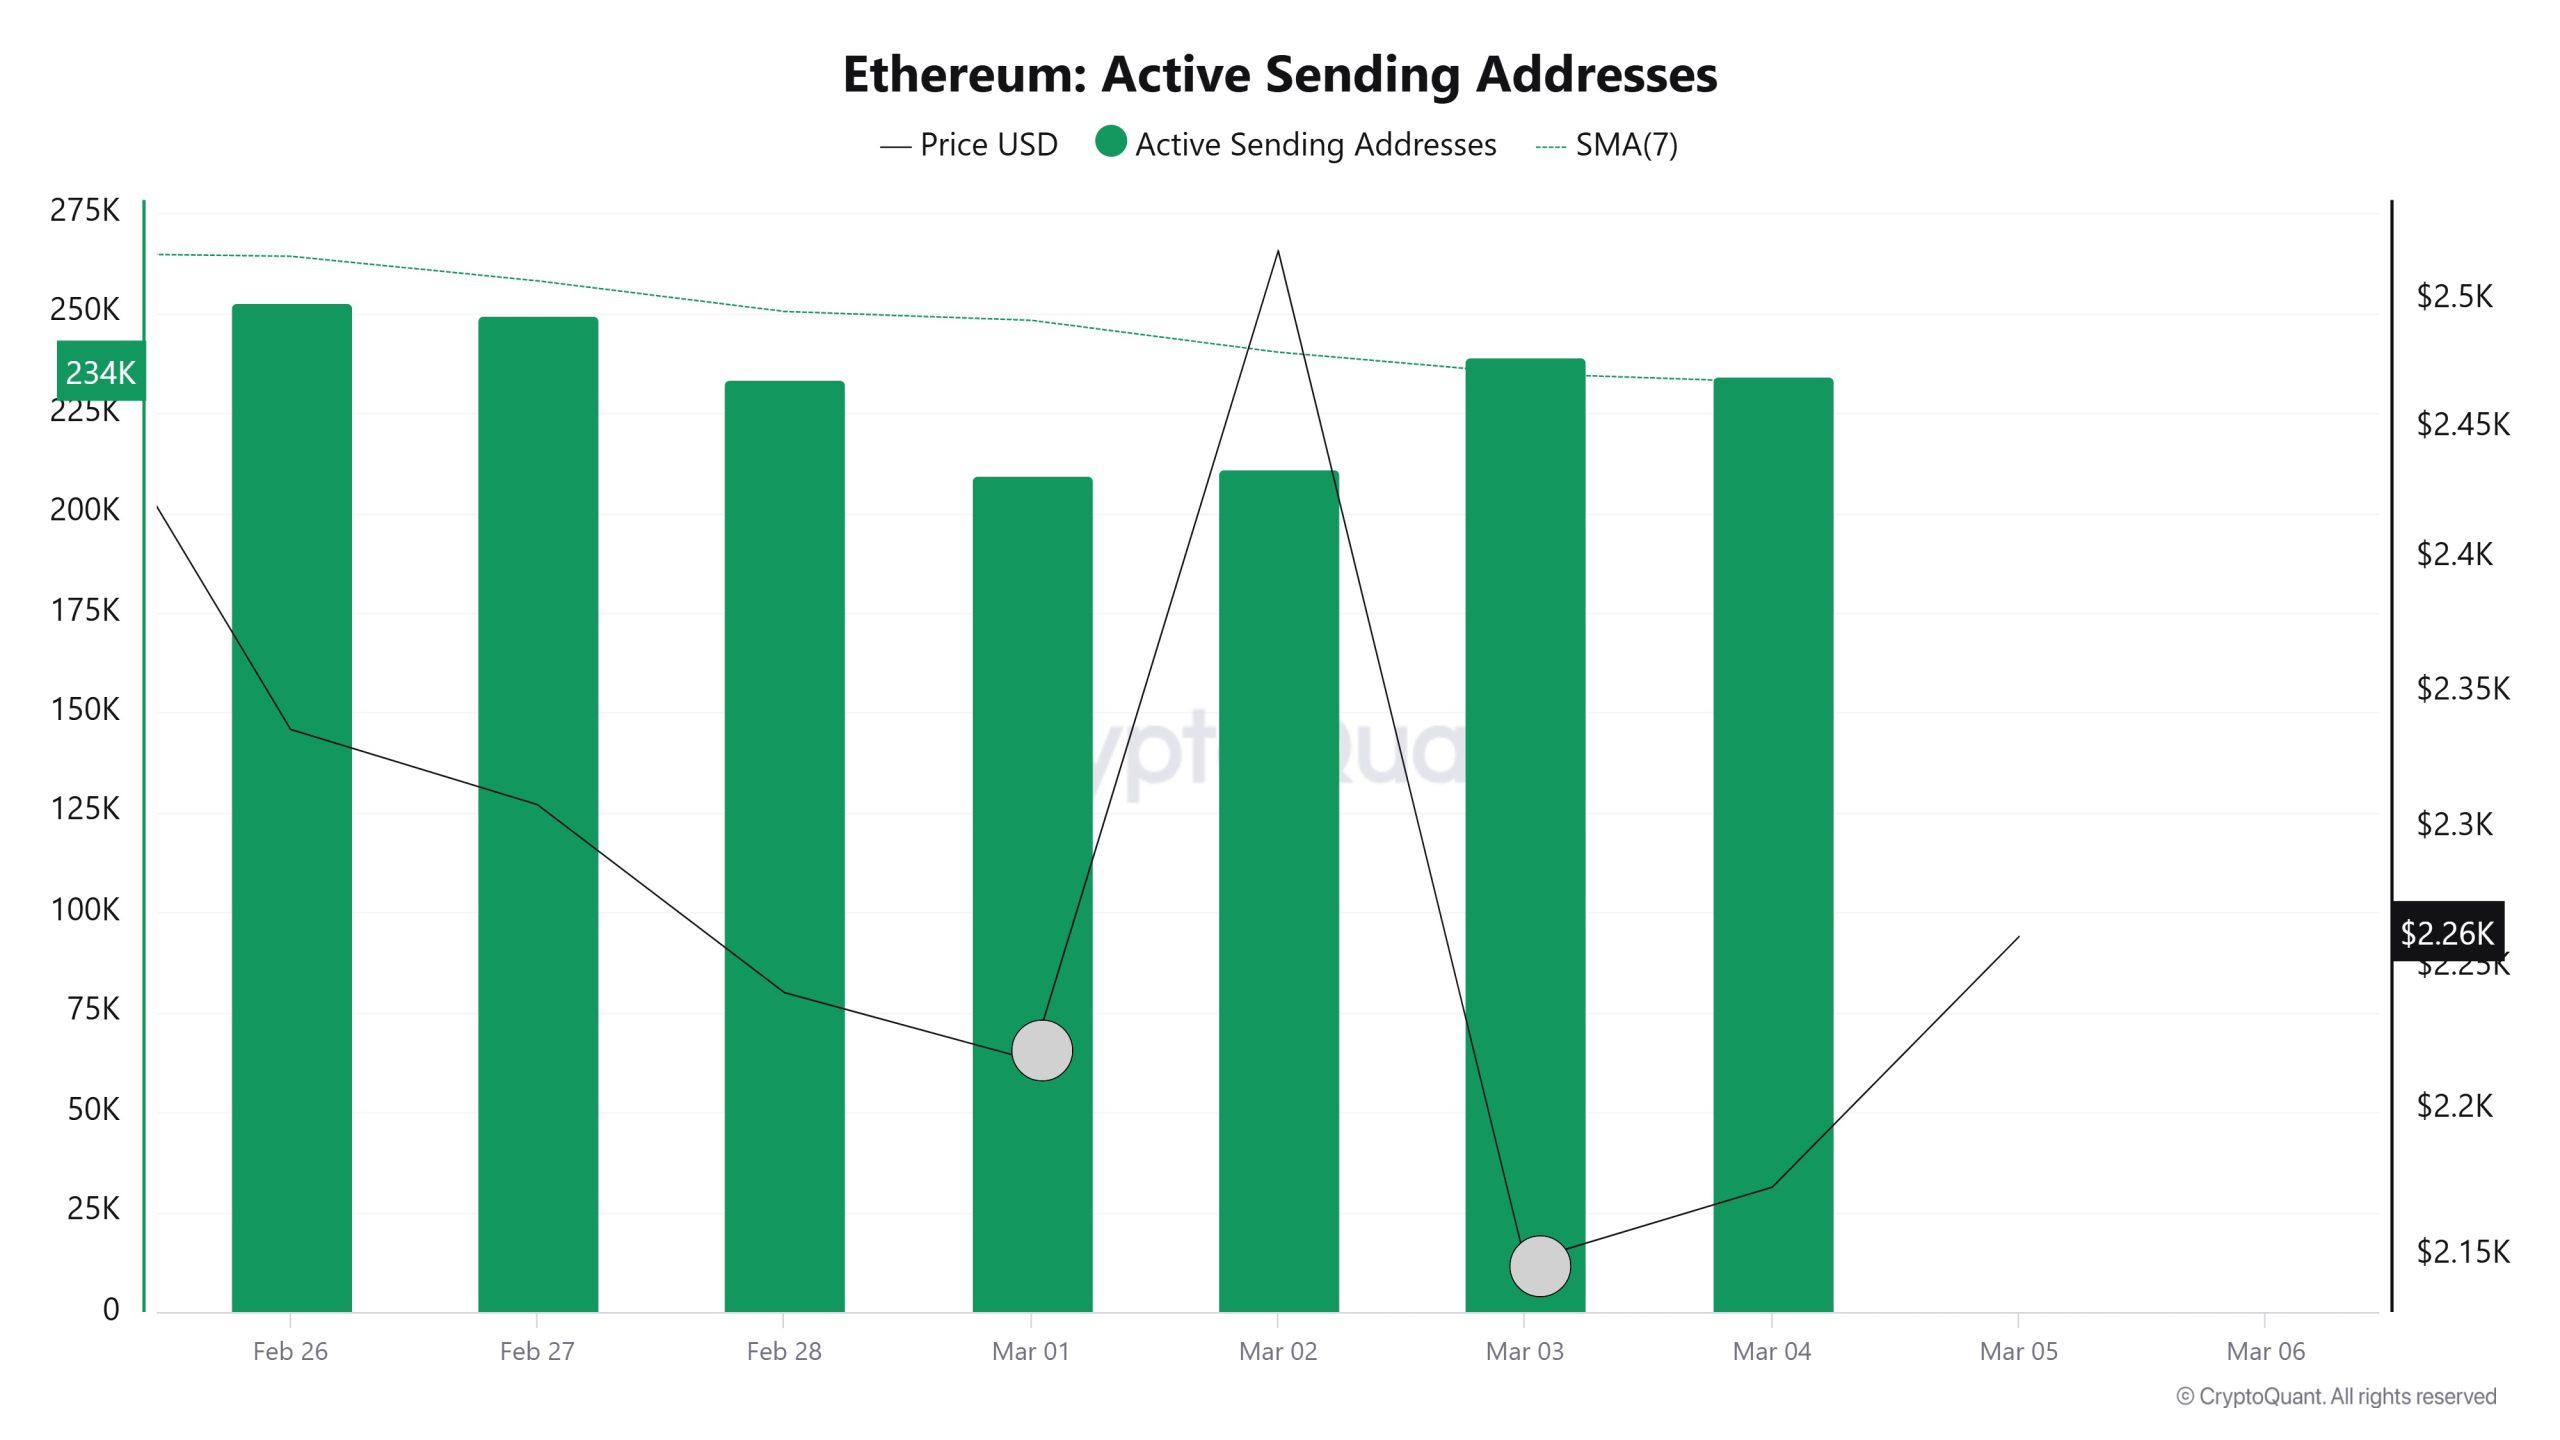
With the Black Line (price line) in active shipping addresses, there was a significant drop in active shipping addresses on Marzo 2. On the day when the price hit its lowest point, active shipping addresses fell to 211,500 , indicating that buyers sold their positions as Ethereum stayed at 2,519 for a while. As a result, it is seen that price drops cause an acceleration in sending addresses.
Active Receiving Addresses
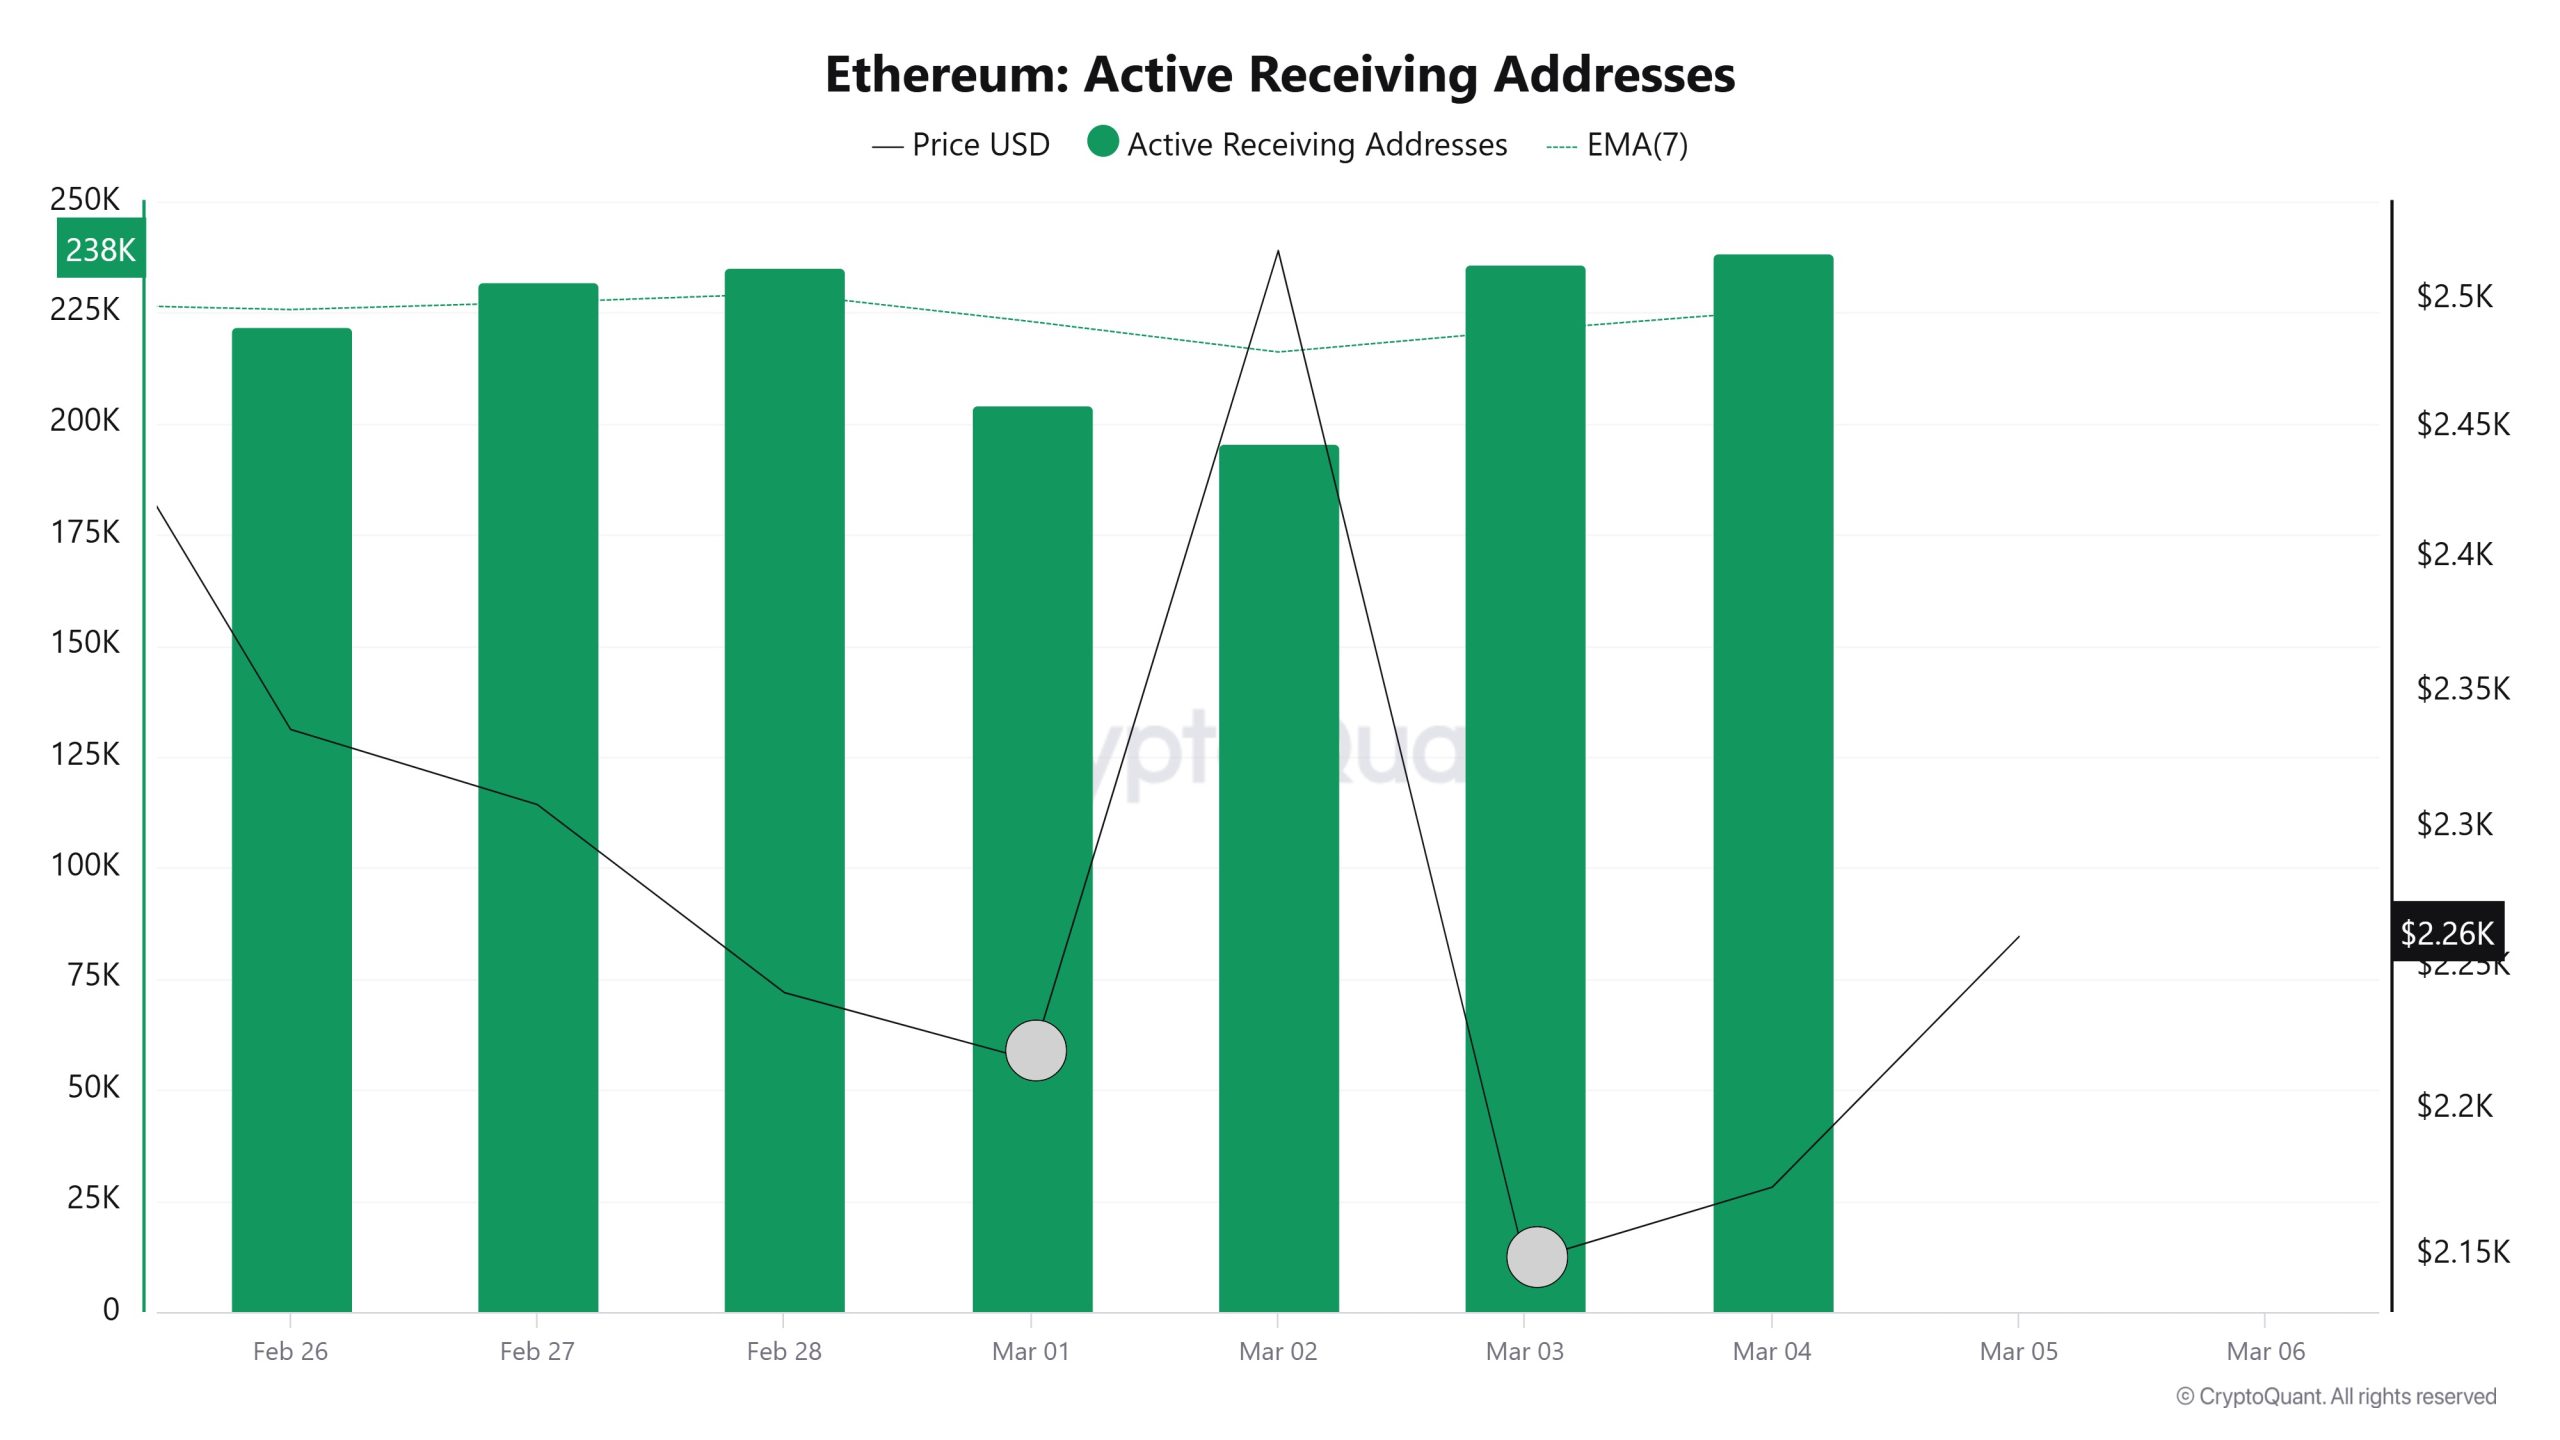
On the active buyer addresses, it appears that on Marzo 1 and Marzo 2, when the price was at 2,519, the number of buyers approached the lowest levels of 195,539 and the longest selling level, with investors reducing their Ethereum positions. This may be the last time buyers wait for the price before it falls.
Total Value Staked
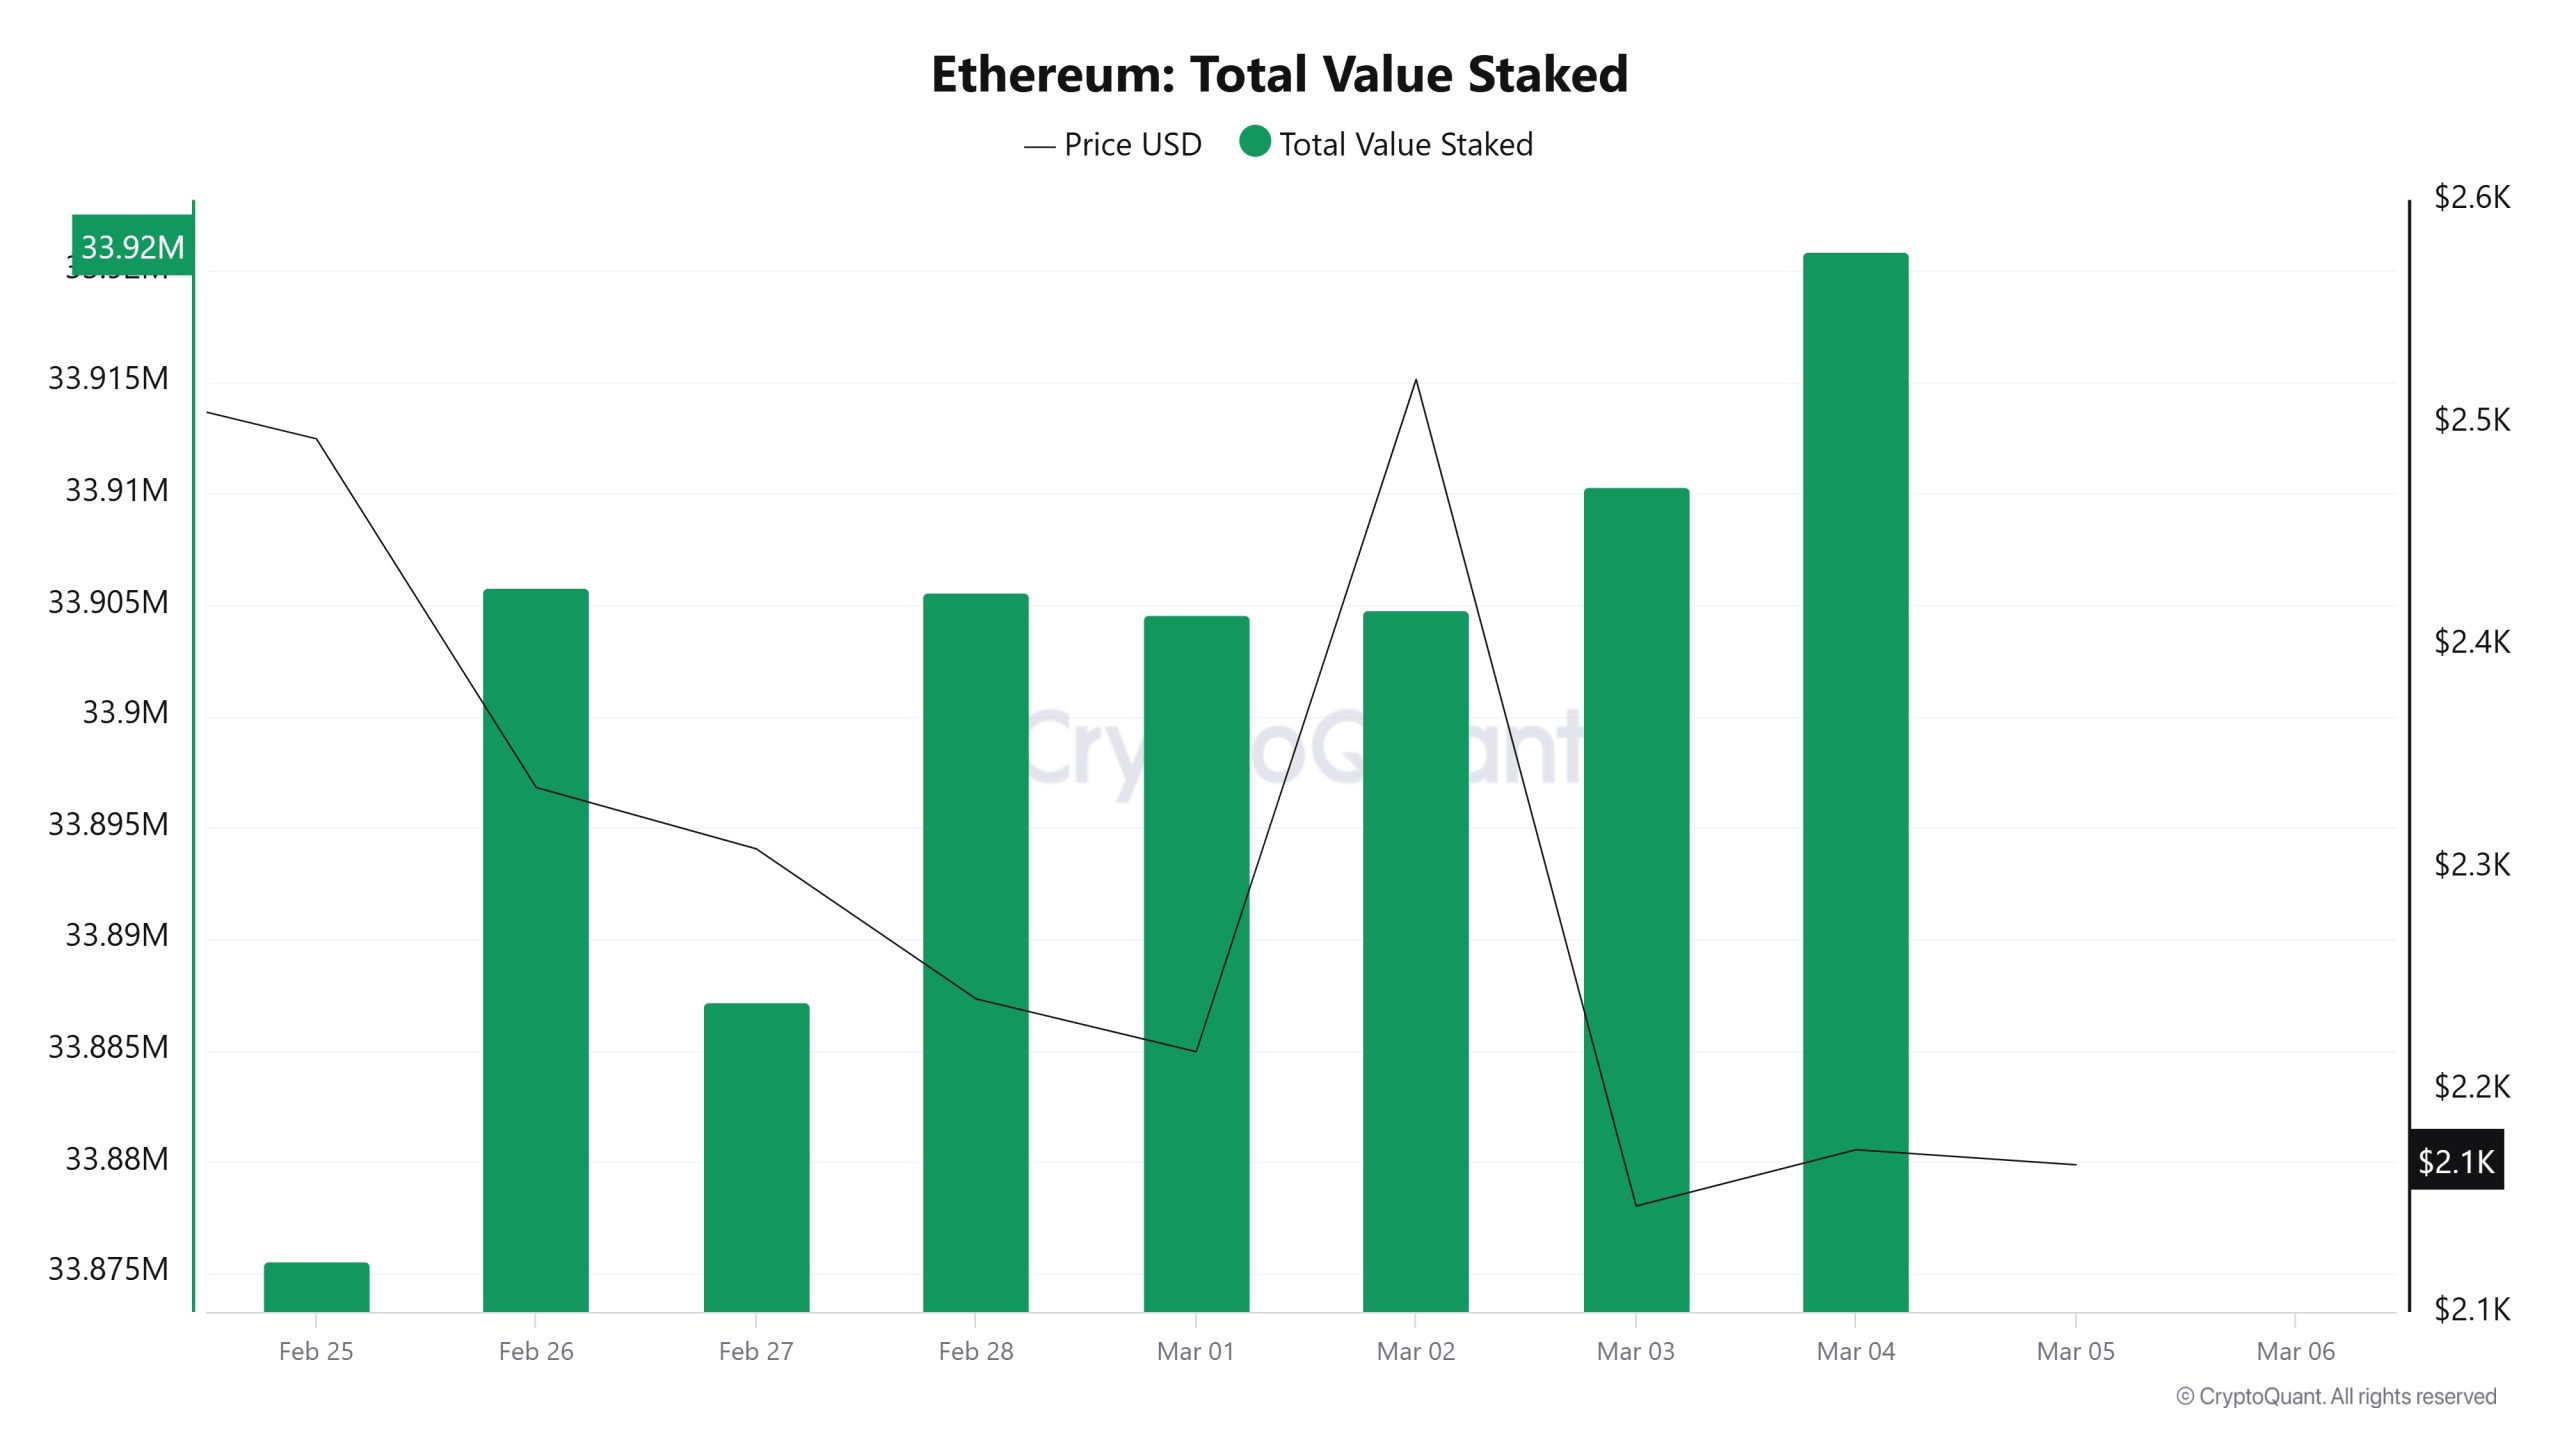
On Febbraio 26, ETH price was 2,335 while Total Value Staked Ratio was 33,905. As of Marzo 4, ETH price decreased to 2,172 while Total Value Staked Ratio increased to 33,920. Compared to last week, ETH price decreased by 6.98% while Total Value Staked Ratio increased by 0.04%.
Staking Inflows

On Febbraio 26, ETH price was 2,335 while Staking Inflow Ratio was 30,204. As of Marzo 4, the ETH price was down to 2,172, while the Staking Inflow Ratio increased to 162,276. Compared to last week, ETH price decreased by 6.98% and Staking Inflow Ratio increased by 437%.
Derivatives
Open Interest
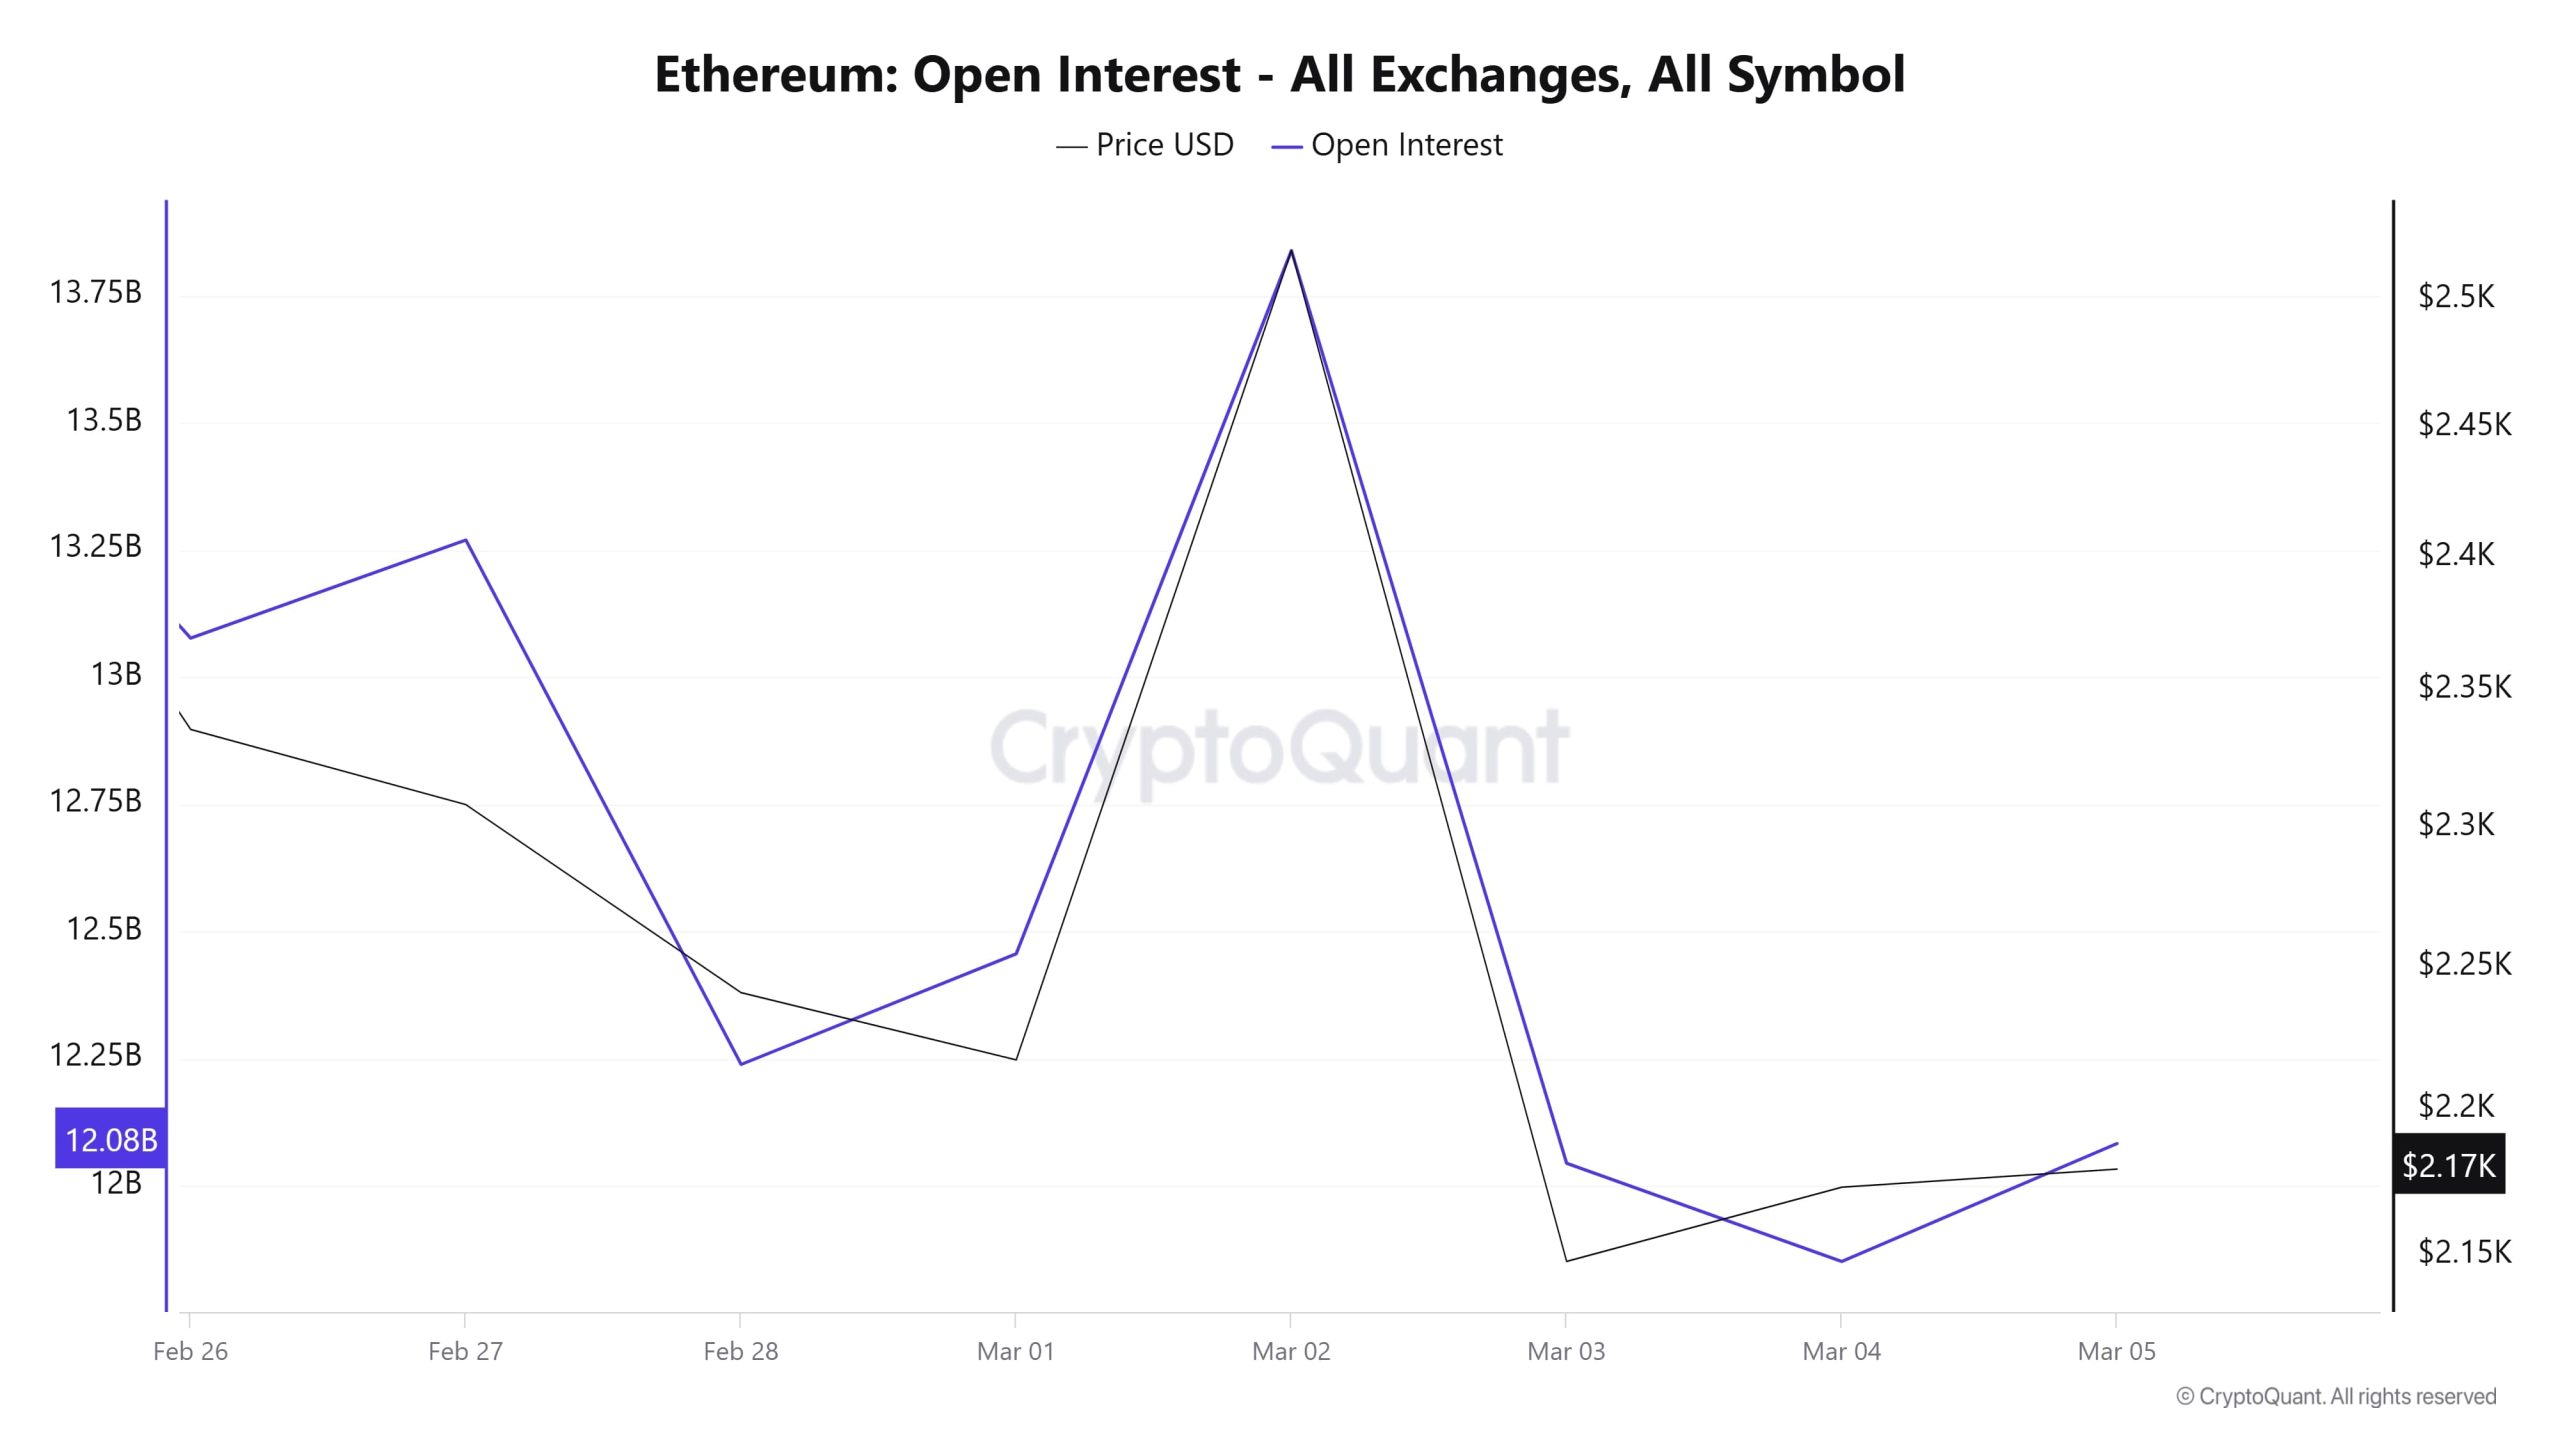
While Ethereum Open Interest was around $13 billion on Febbraio 26, the ETH price hovered around $2.2K, rose to $13.25 billion on Febbraio 27, then declined to $12.25 billion on Febbraio 28. The ETH price also declined during the same period. On Marzo 1, open interest and price started to recover, and on Marzo 2, open interest peaked at $13.75 billion, while ETH price rose similarly. On Marzo 3, both open interest and price fell sharply, with open interest dropping to $12 billion and the price to around $2.15K. On Marzo 4-5, open interest and price gradually recovered to reach $2.17K. The sharp decline in the open interest level indicates that long positions were closed.
Funding Rate
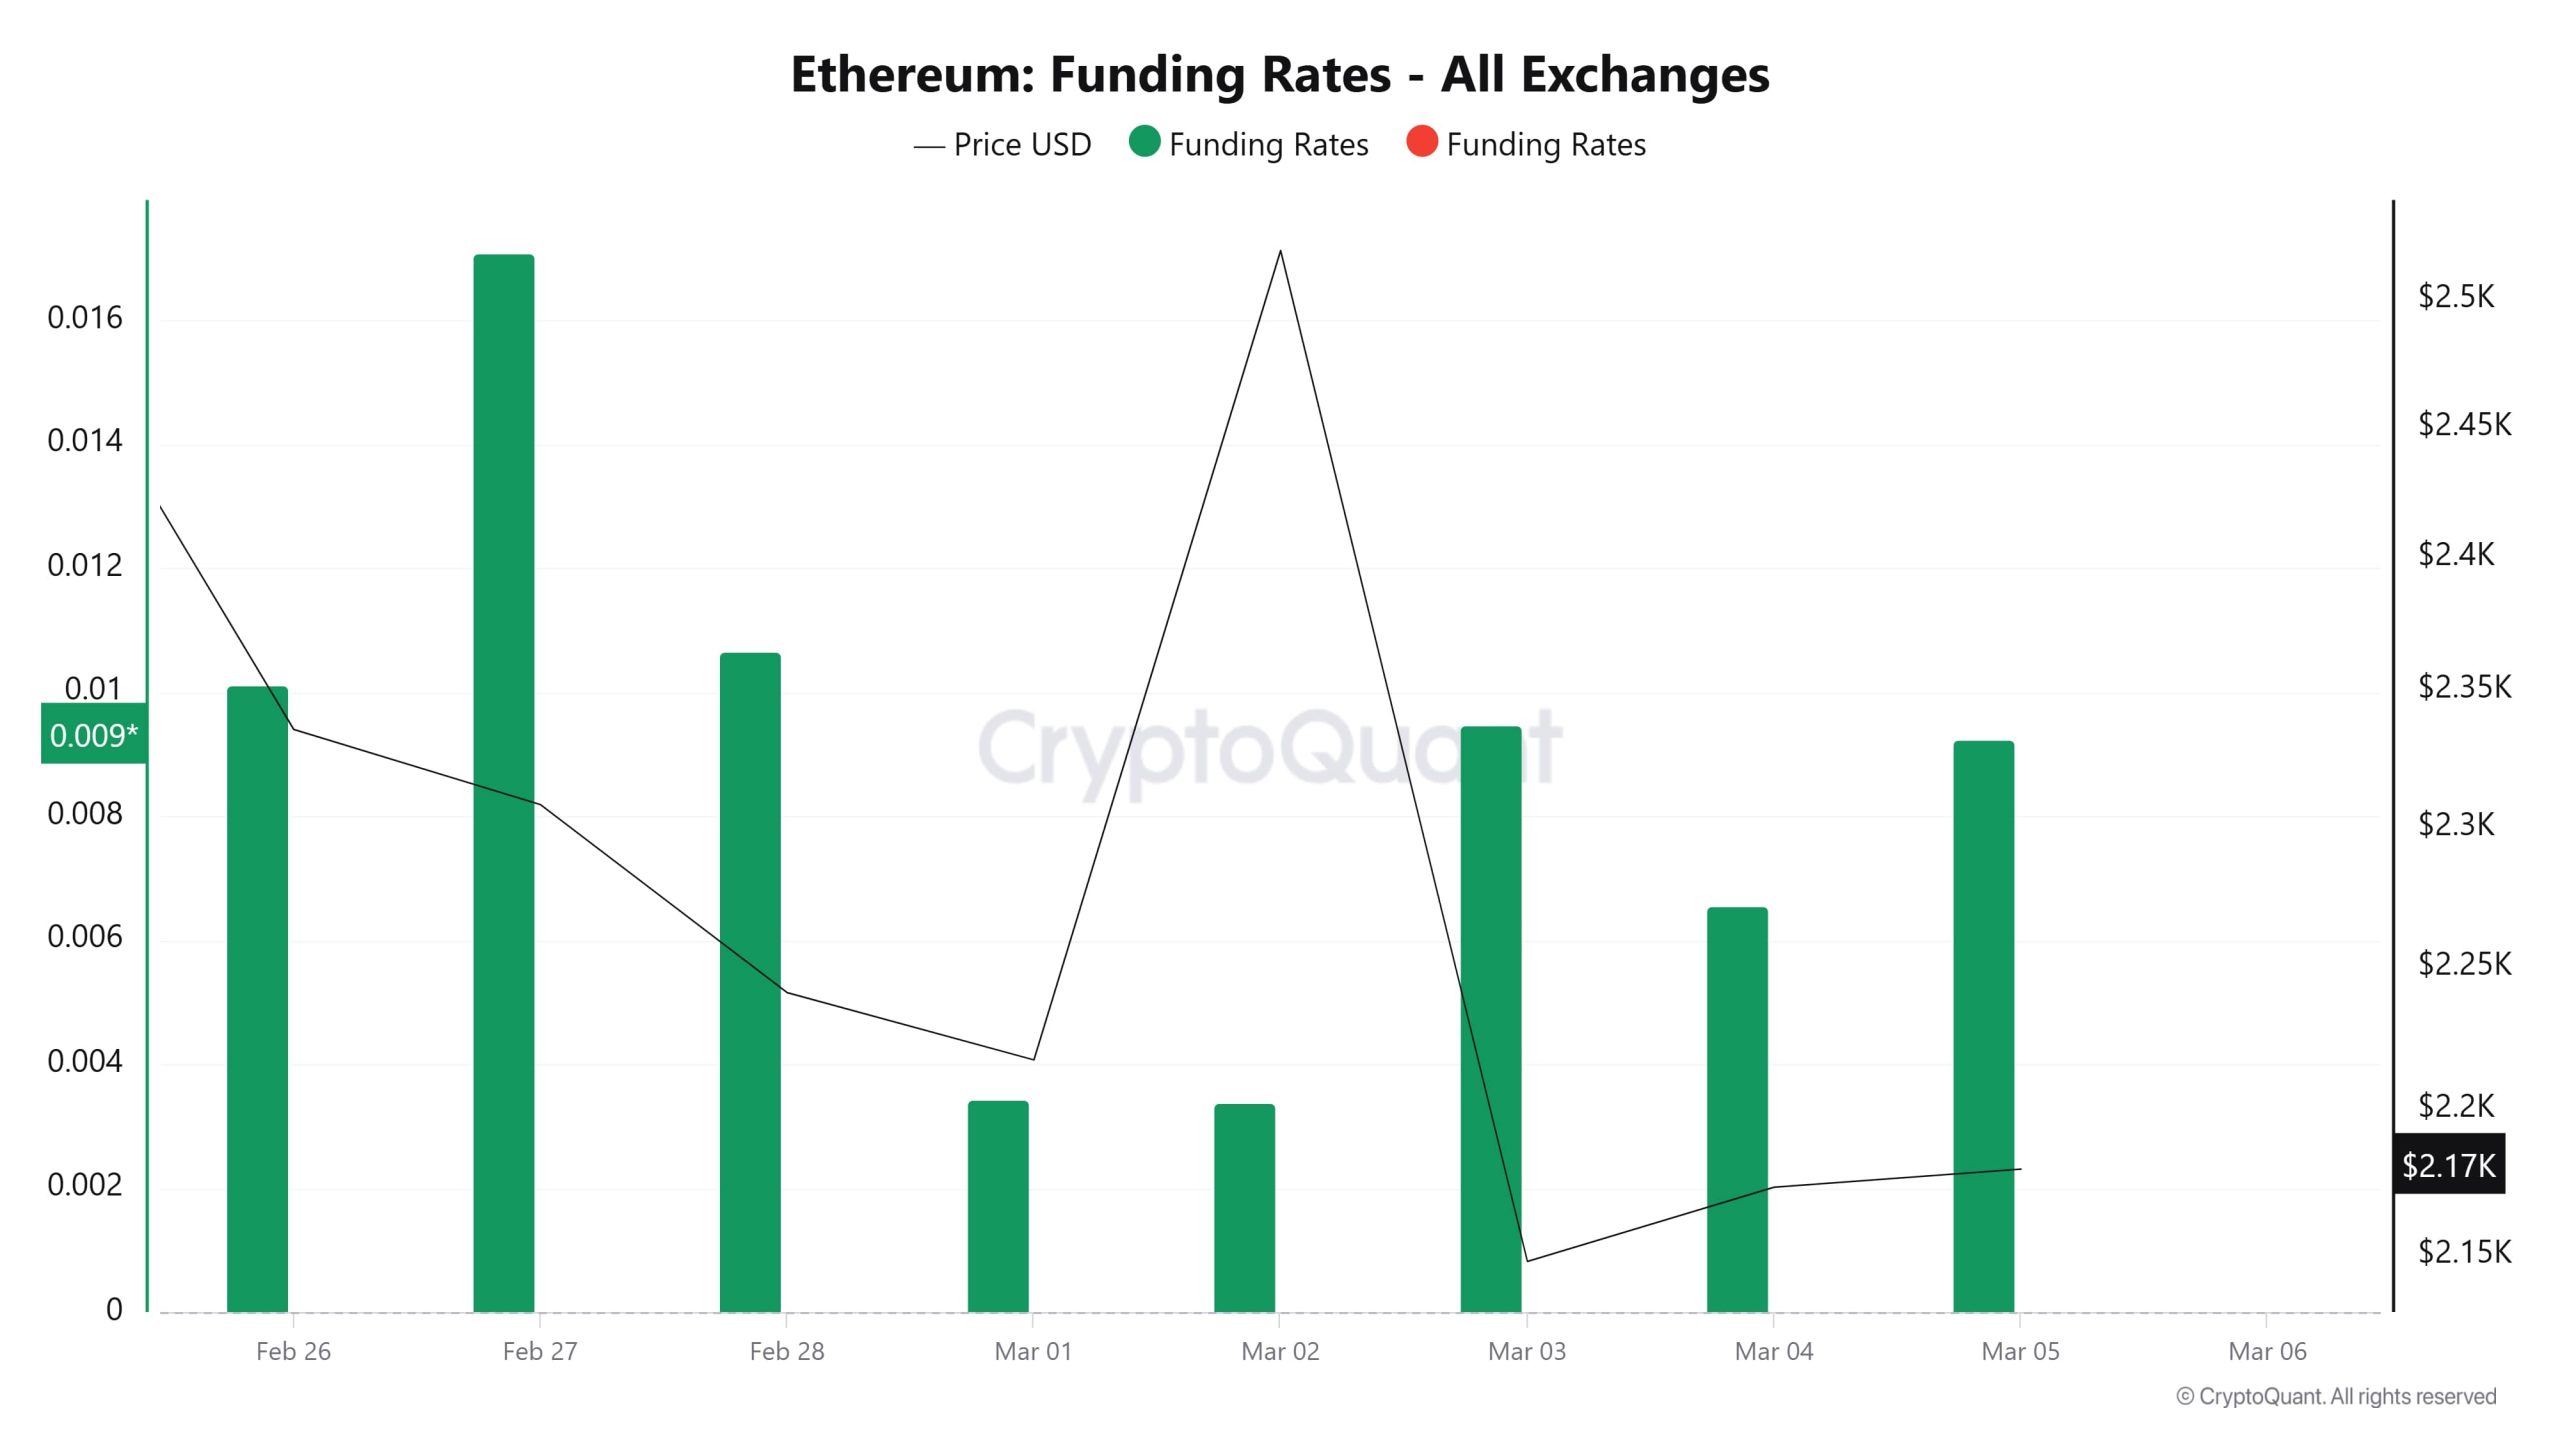
Ethereum’s funding rates continue to be generally positive. Funding rates for ETH, which fell as low as $2,000 with the developments last week, are currently hovering at 0.009. Between Febbraio 26 and Marzo 1, the funding rate, which fell with the declining price, continued to remain at a low level despite the price exceeding $ 2,500 after Trump’s reserve announcement on Marzo 2. The funding rate, which is currently rising in parallel with the price rise, shows that investors are increasing their long positions again.
Long & Short Liquidations
The Donald Trump effect in the markets caused very high volatility on ETH. With this volatility, $683 million worth of longs and $348 million worth of shorts were liquidated, which would be considered very high for ETH.
| Data | Long Amount (Million $) | Short Amount (Million $) |
|---|---|---|
| Febbraio 26 | 109.68 | 31.59 |
| Febbraio 27 | 67.09 | 22.52 |
| Febbraio 28 | 143.05 | 56.11 |
| Marzo 01 | 43.13 | 29.85 |
| Marzo 02 | 81.10 | 105.94 |
| Marzo 03 | 140.80 | 30.35 |
| Marzo 04 | 98.62 | 72.11 |
| Total | 683.47 | 348.47 |
Supply Distribution
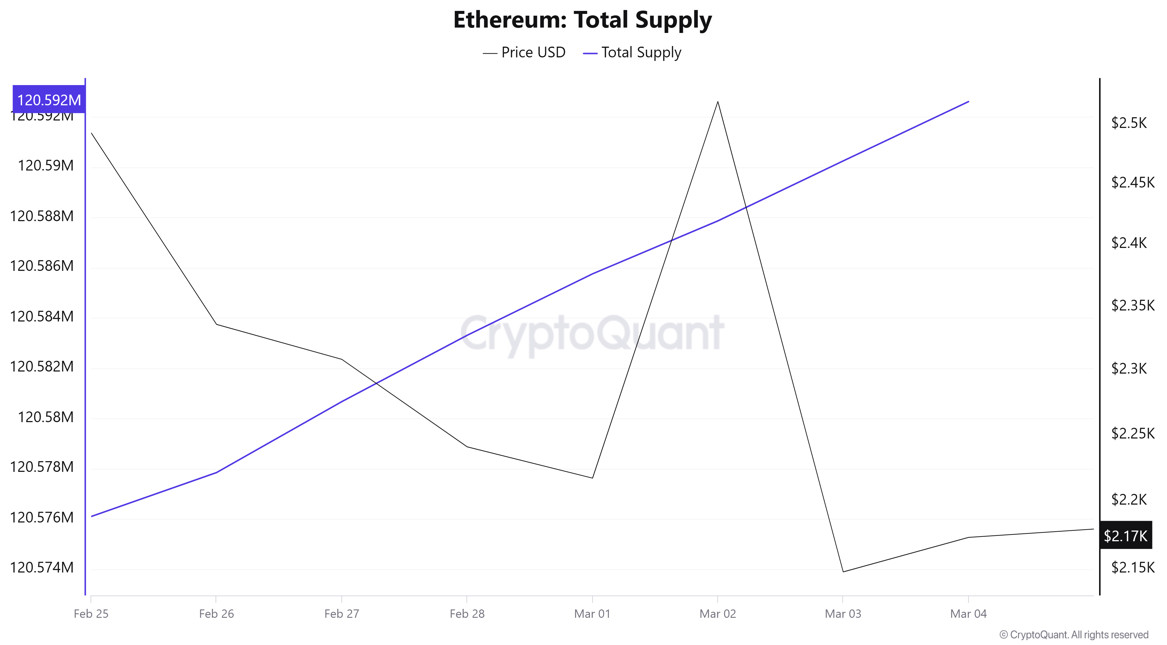
Total Supply: It reached 120,592,613 units, up about 0.0147% from last week.
New Supply: The amount of ETH produced this week was 17,728.
Velocity: Velocity, which was 7.56 last week, was 7.70 as of Marzo 3.
| Wallet Category | 24.02.2025 | 03.03.2025 | Variazione (%) |
|---|---|---|---|
| 100 – 1k ETH | 9.4311M | 9.4666M | +0.38% |
| 1k – 10k ETH | 12.6353M | 12.7423M | +0.85% |
| 10k – 100k ETH | 17.3297M | 16.5092M | -4.73% |
| 100k+ ETH | 4.7562M | 4.7259M | -0.64% |
When we examine the wallet distribution of the current supply of ethereum, the amount of ethereum in the 100 – 1K ETH category increased by 0.38%. Assets in the 1K – 10K ETH category increased by 0.85%, while there was a 4.73% decrease in the 10K – 100K ETH range. The decrease in the 100K+ ETH segment, which represents the largest wallets, was recorded as 0.64.
Exchange Reserve
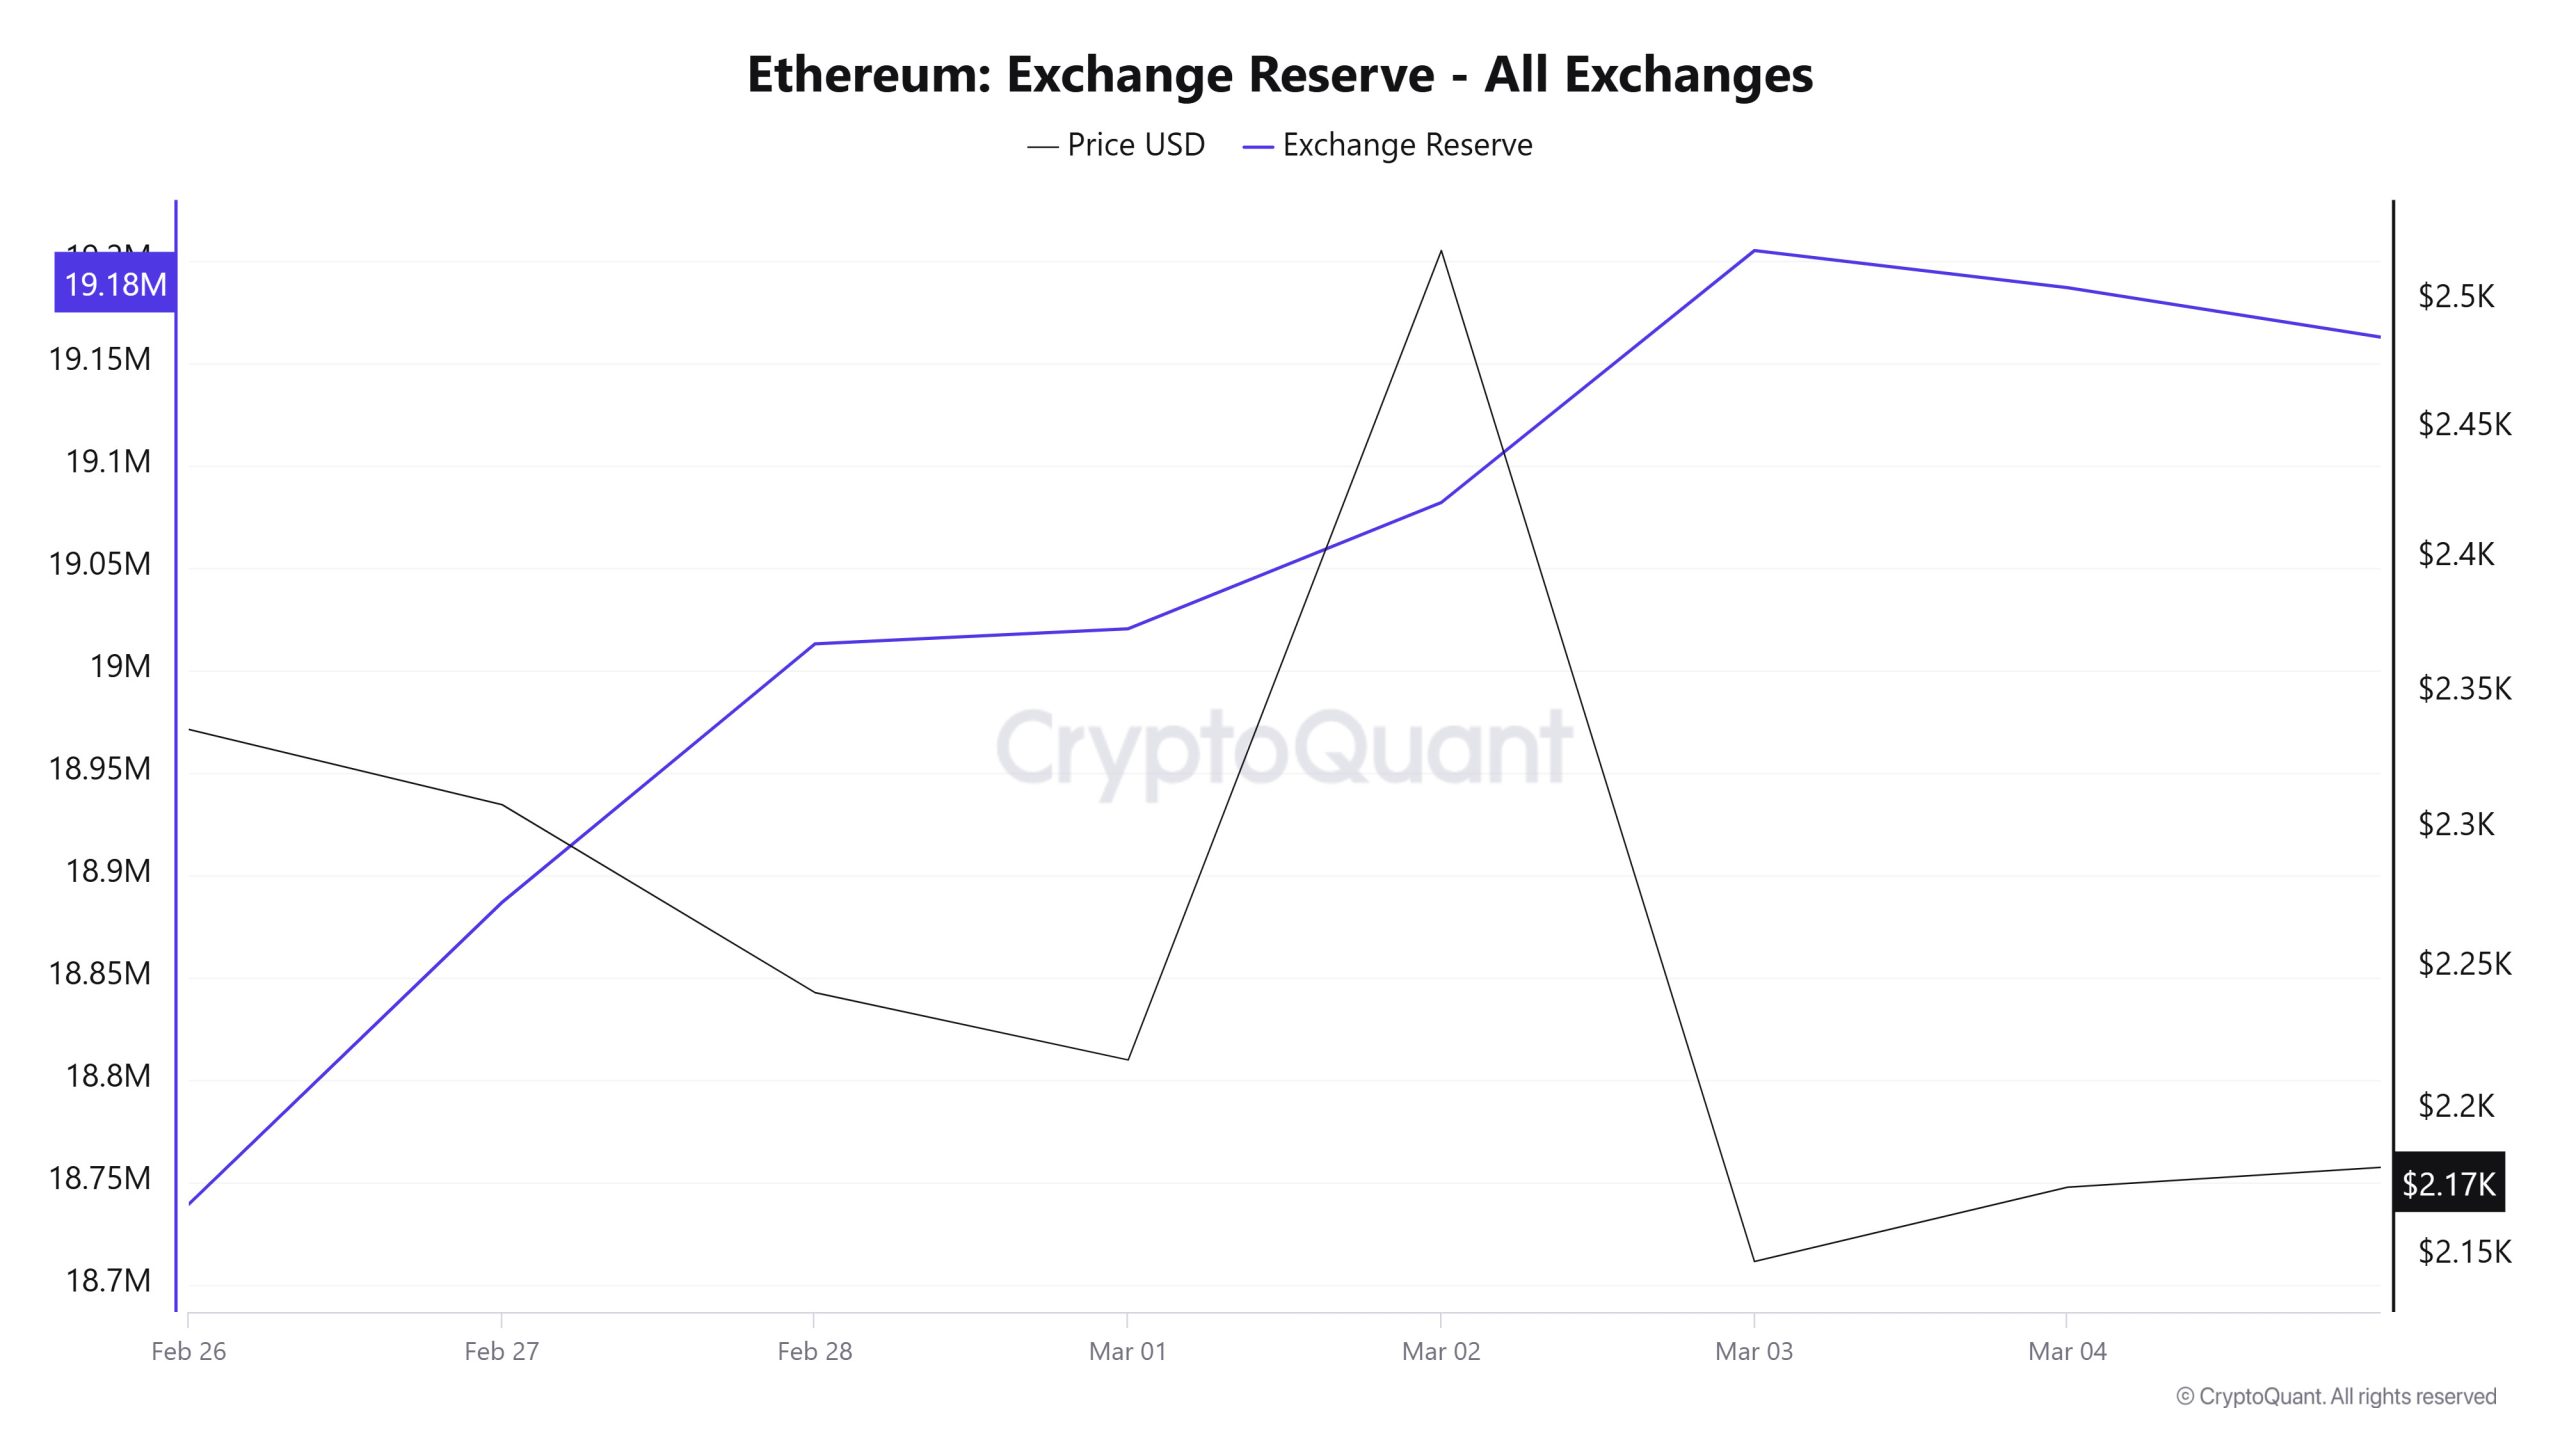
Between Febbraio 26 and Marzo 4, 2025, Ethereum reserves on exchanges increased from 18,739,262 ETH to 19,186,582 ETH. During this period, there was a total net inflow of 447,320 ETH and the exchanges’ Ethereum reserves increased by 2.39%. The Ethereum price fell by about 7% during this period. Ethereum, which closed at $2,336 on Febbraio 26, 2025, closed at $2,173 on Marzo 4, 2025.
Fees and Revenues
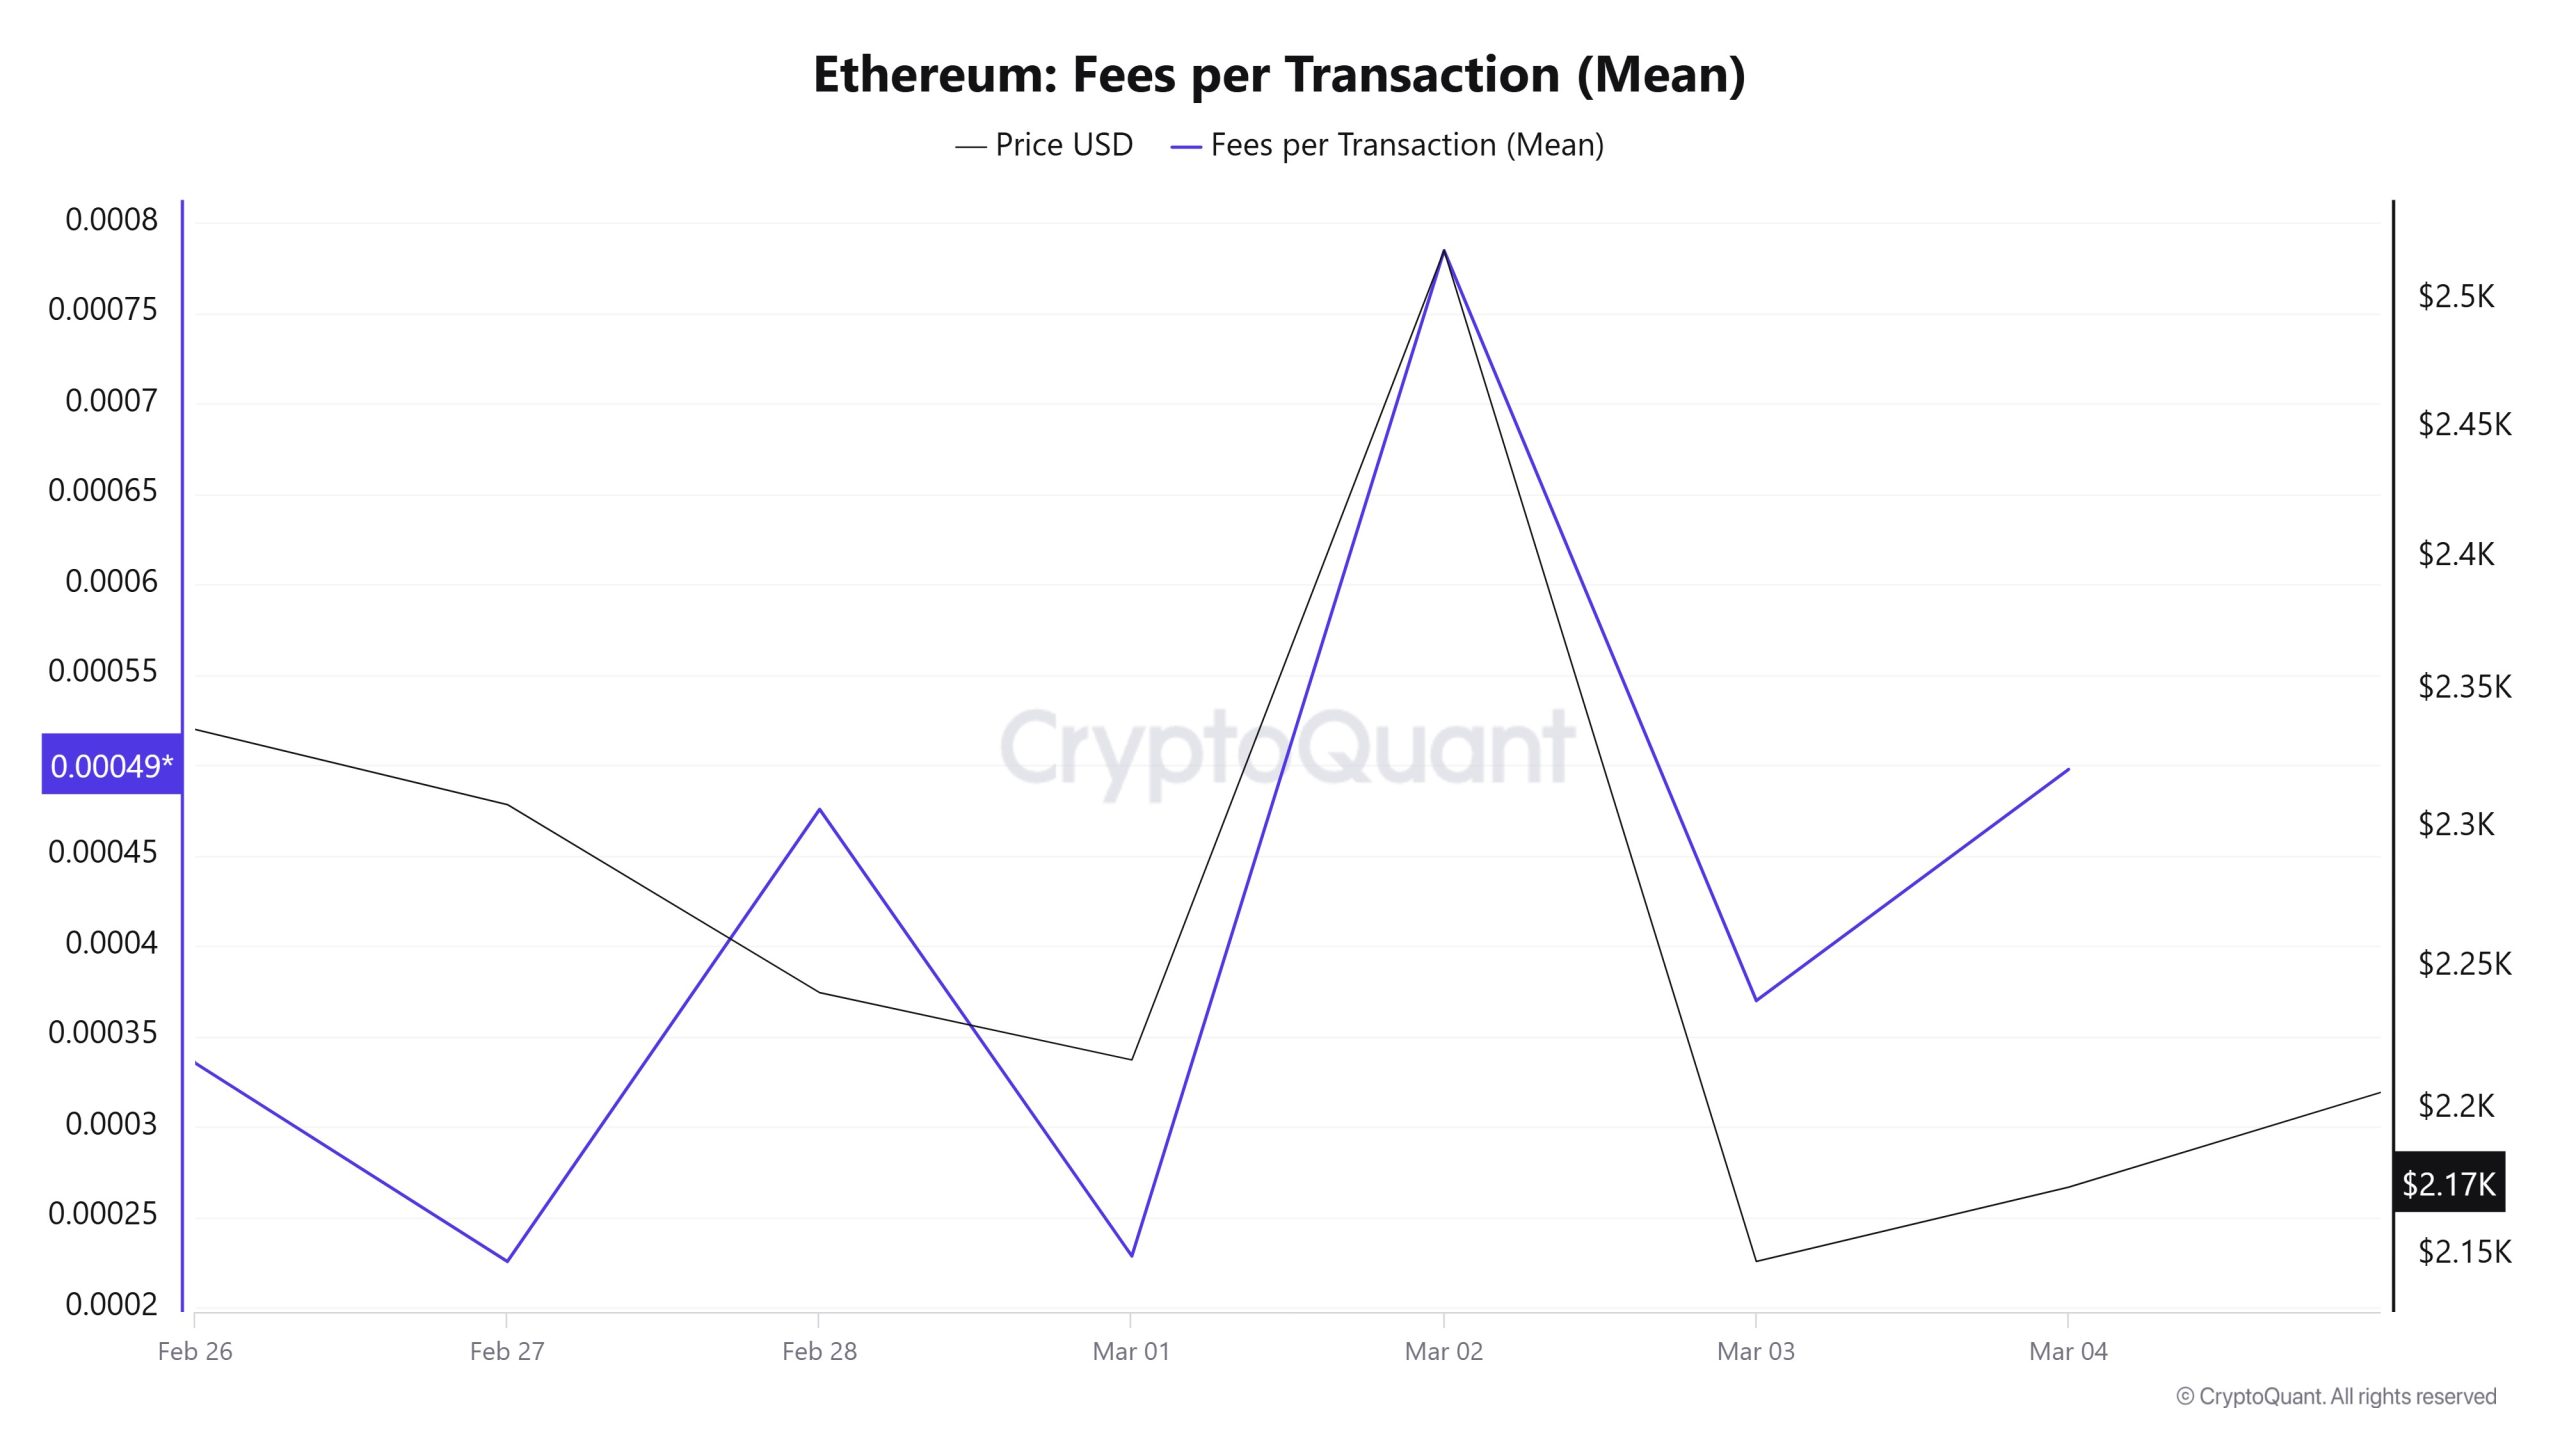
When the Ethereum Fees per Transaction (Mean) data between Febbraio 26 – Marzo 2, is analyzed, it is seen that this value was at the level of 0.000335348838952311 on Febbraio 26, the first day of the week. Until Marzo 1, the value, which followed a relatively calm movement with the horizontal movement seen in the Ethereum price until Marzo 1, increased with increasing volatility after Marzo 1. Thus, the value reached 0.00078469778883383 on Marzo 2 and was recorded as the highest value of the week.
Fees per Transaction (Mean) value, which decreased again in the following days, closed at 0.000497762961588647 on Marzo 4, the last day of the weekly period.
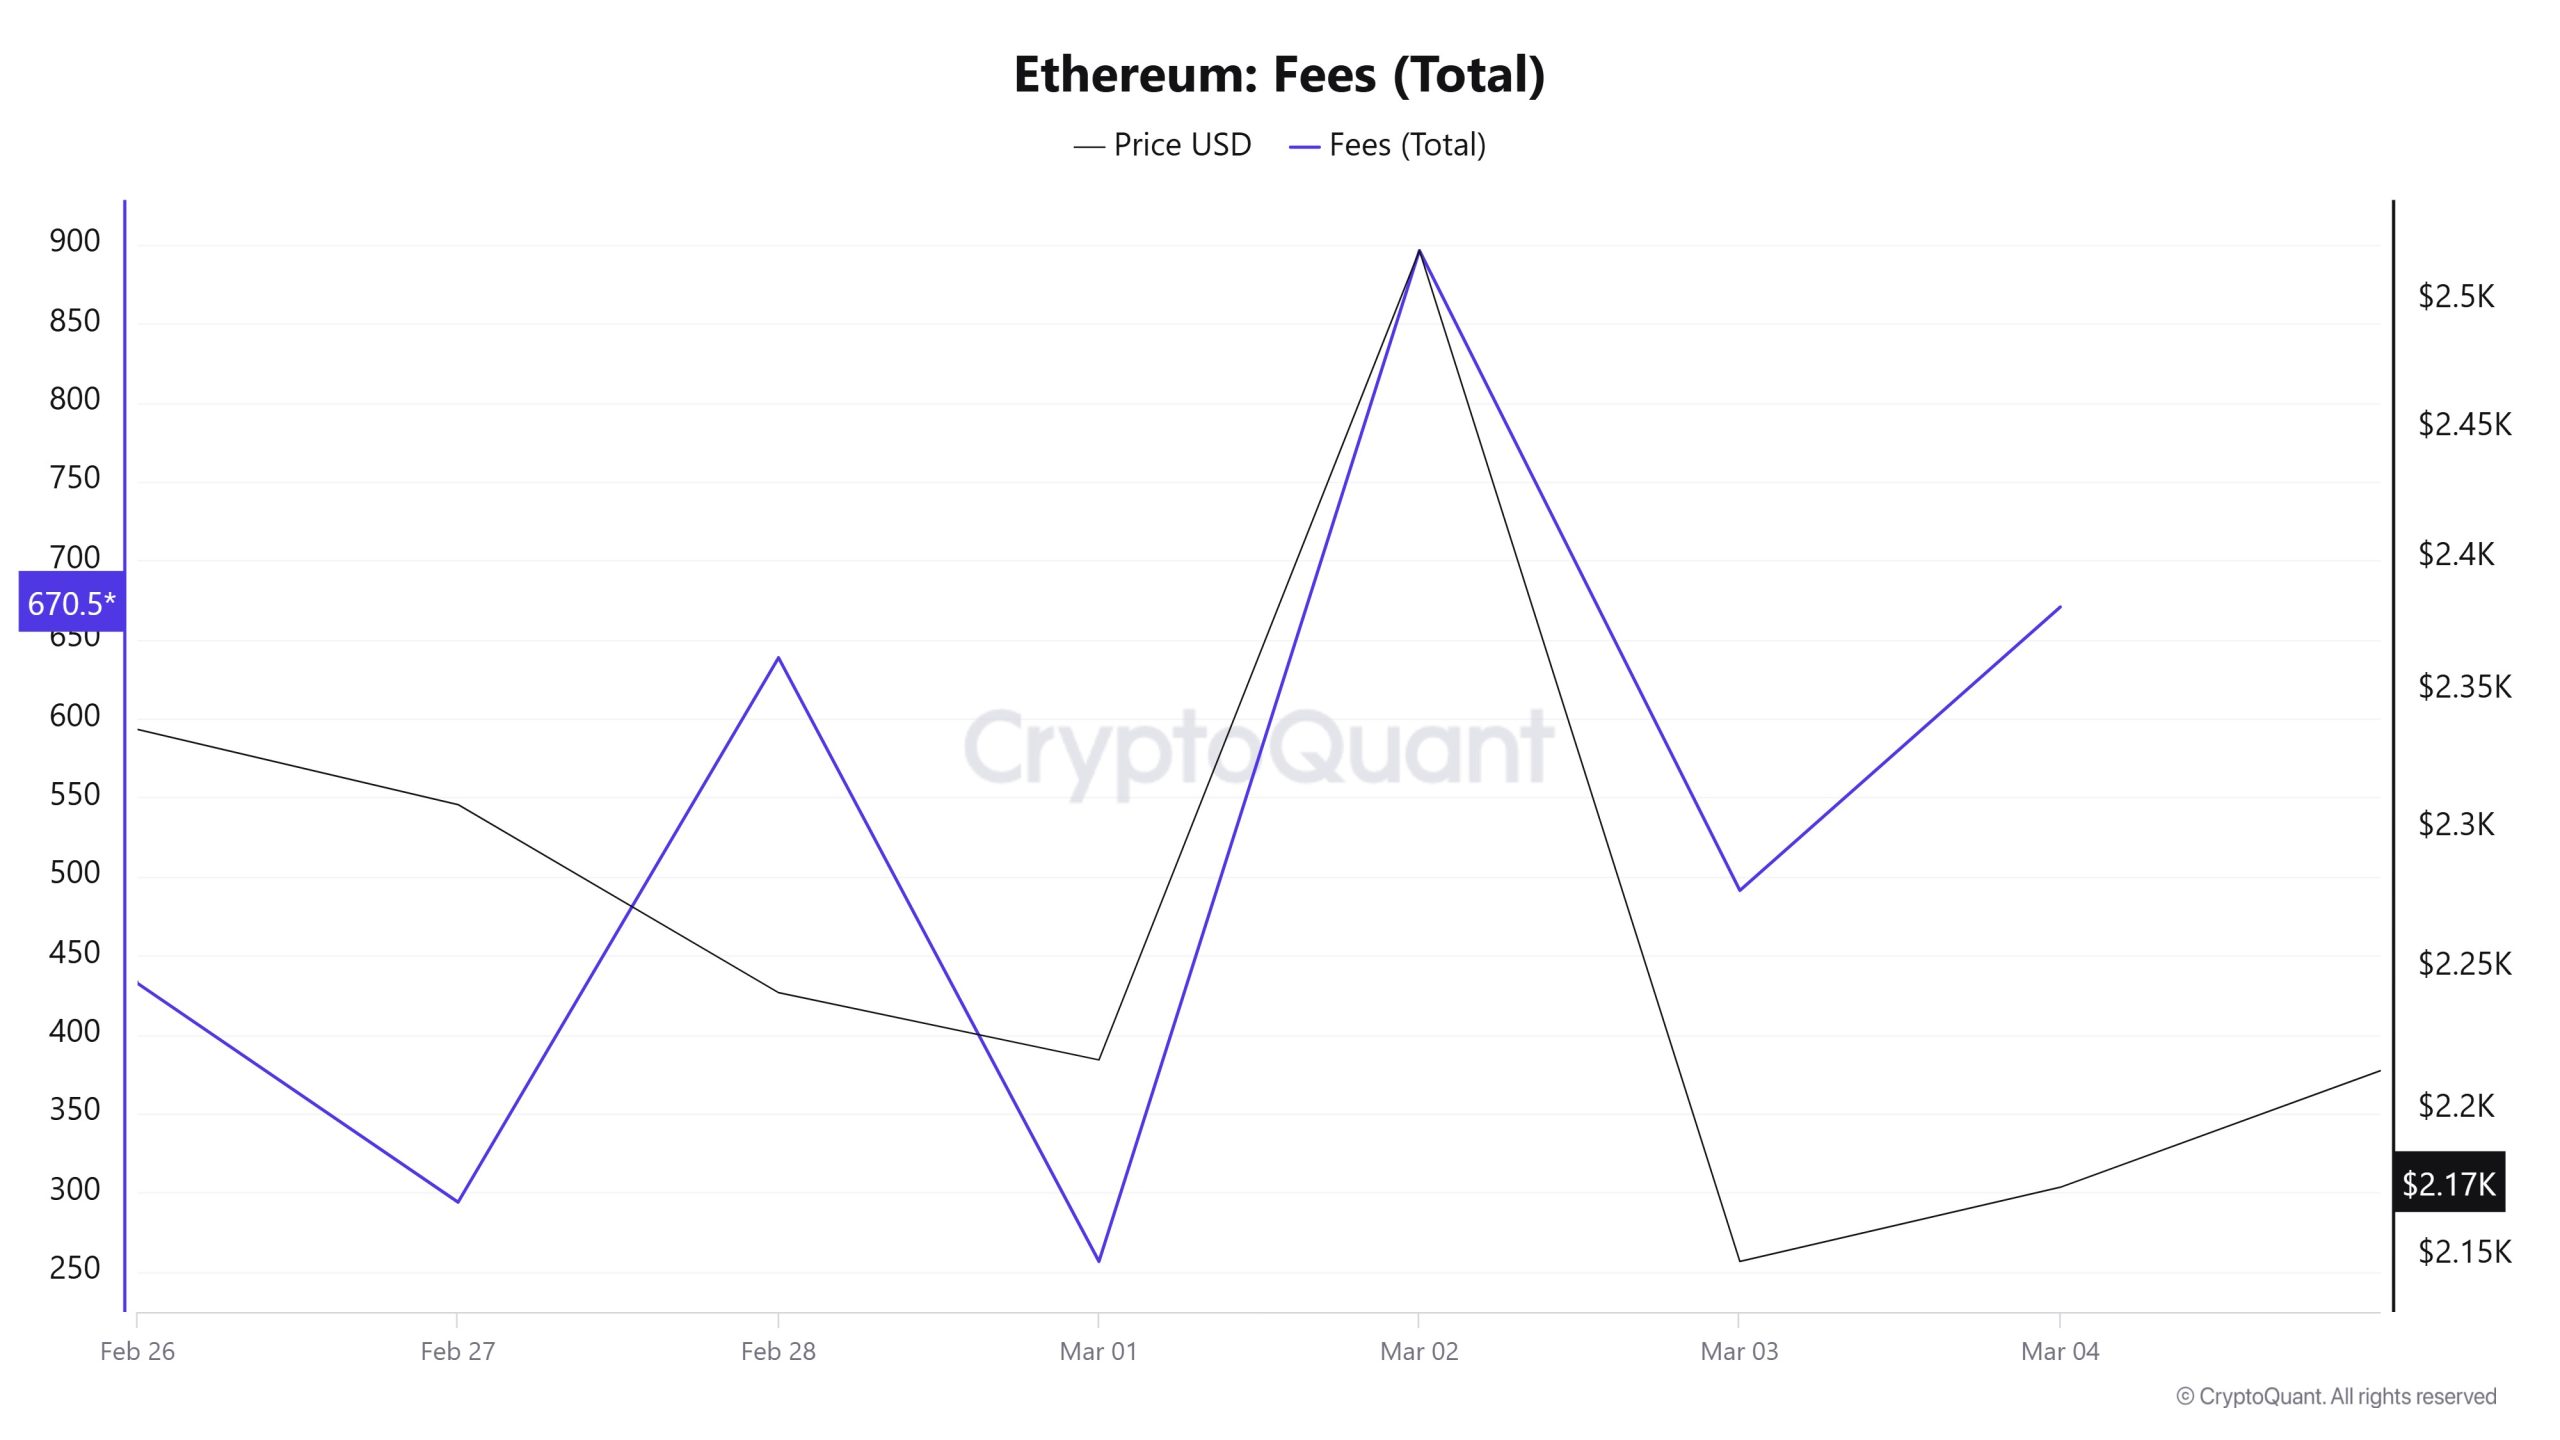
Similarly, when the Ethereum Fees (Total) data between Febbraio 26 and Marzo 2 is analyzed, it is seen that this value was 432.3250162005401 on Febbraio 26, the first day of the week. Until Marzo 1, the value, which followed a relatively calm movement with the horizontal movement seen in the Ethereum price until Marzo 1, increased with increasing volatility after Marzo 1. Thus, the value reached 896.1625403420976 on Marzo 2, recording the highest value of the week.
Fees (Total), which decreased again in the following days, closed at 670.5817819855707 on Marzo 4, the last day of the weekly period.
Block Mined
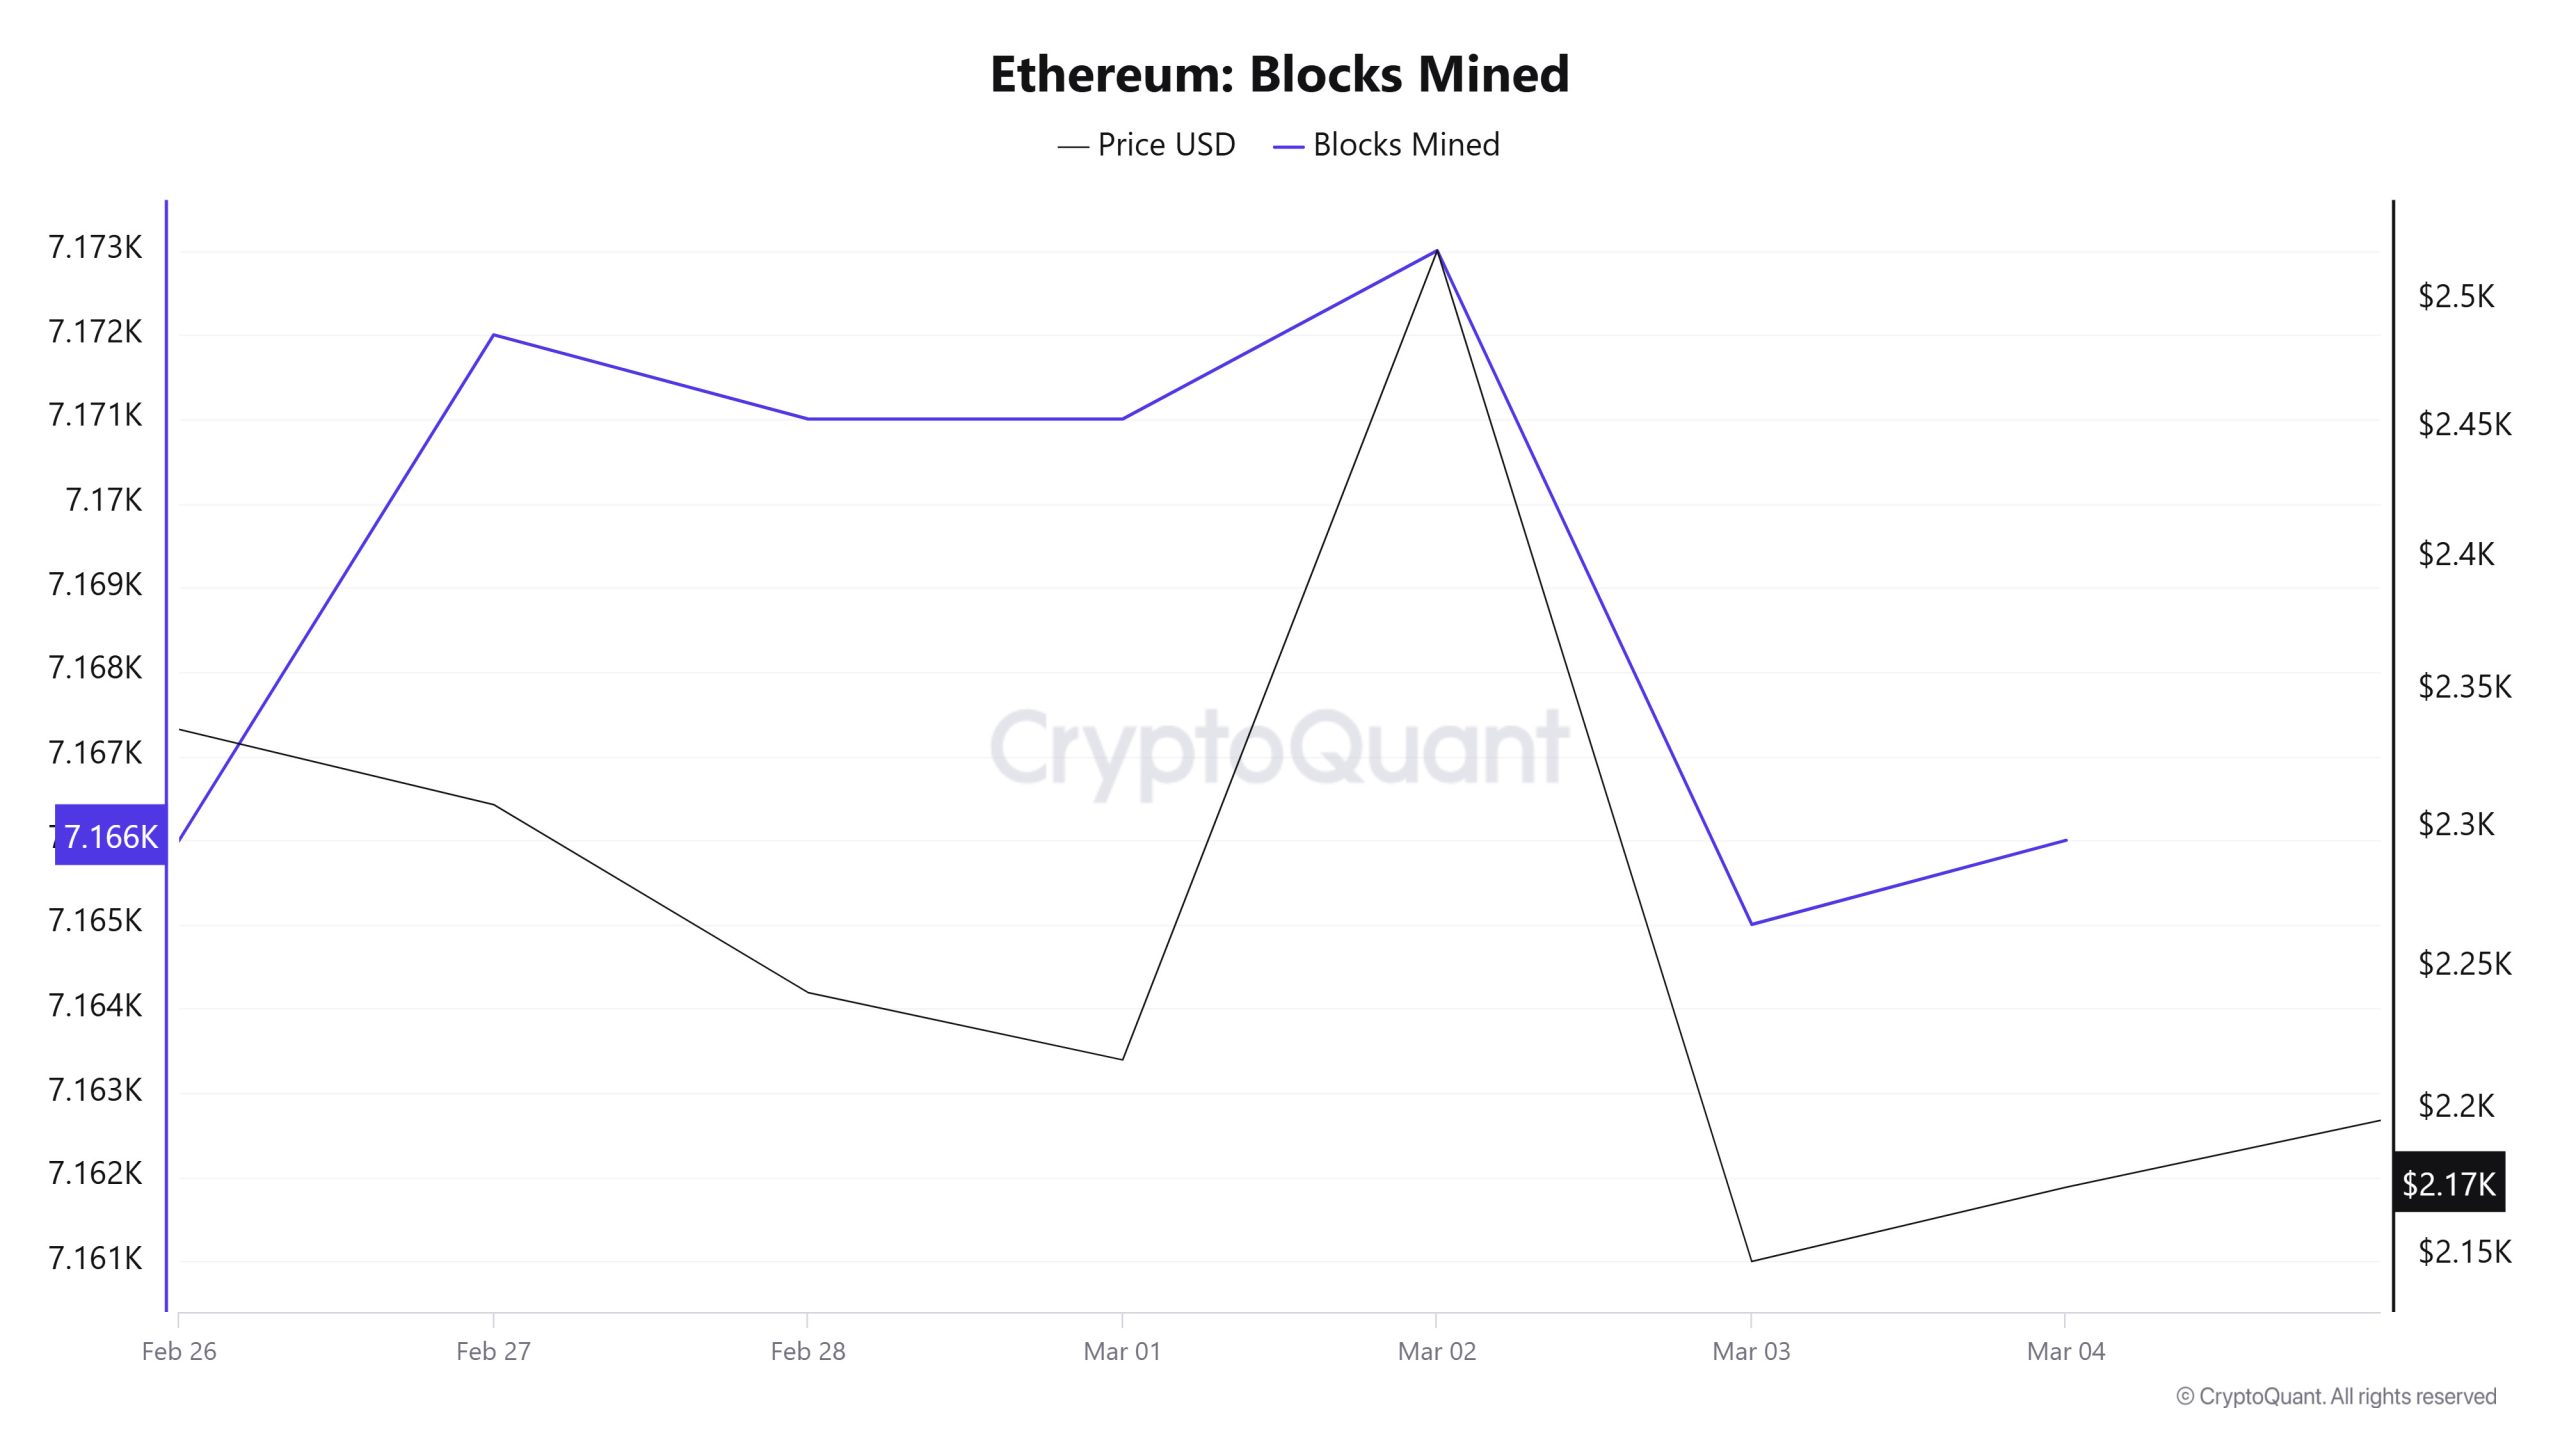
Between Febbraio 26 and Marzo 4, when we examine the Ethereum Blocks Mined table, the number of blocks produced increased throughout the week. While 7,166 blocks were produced on Febbraio 26, this number was 7,166 again on Marzo 4. There was a positive correlation between Blocks Mined and Ethereum price during the week.
Block Size
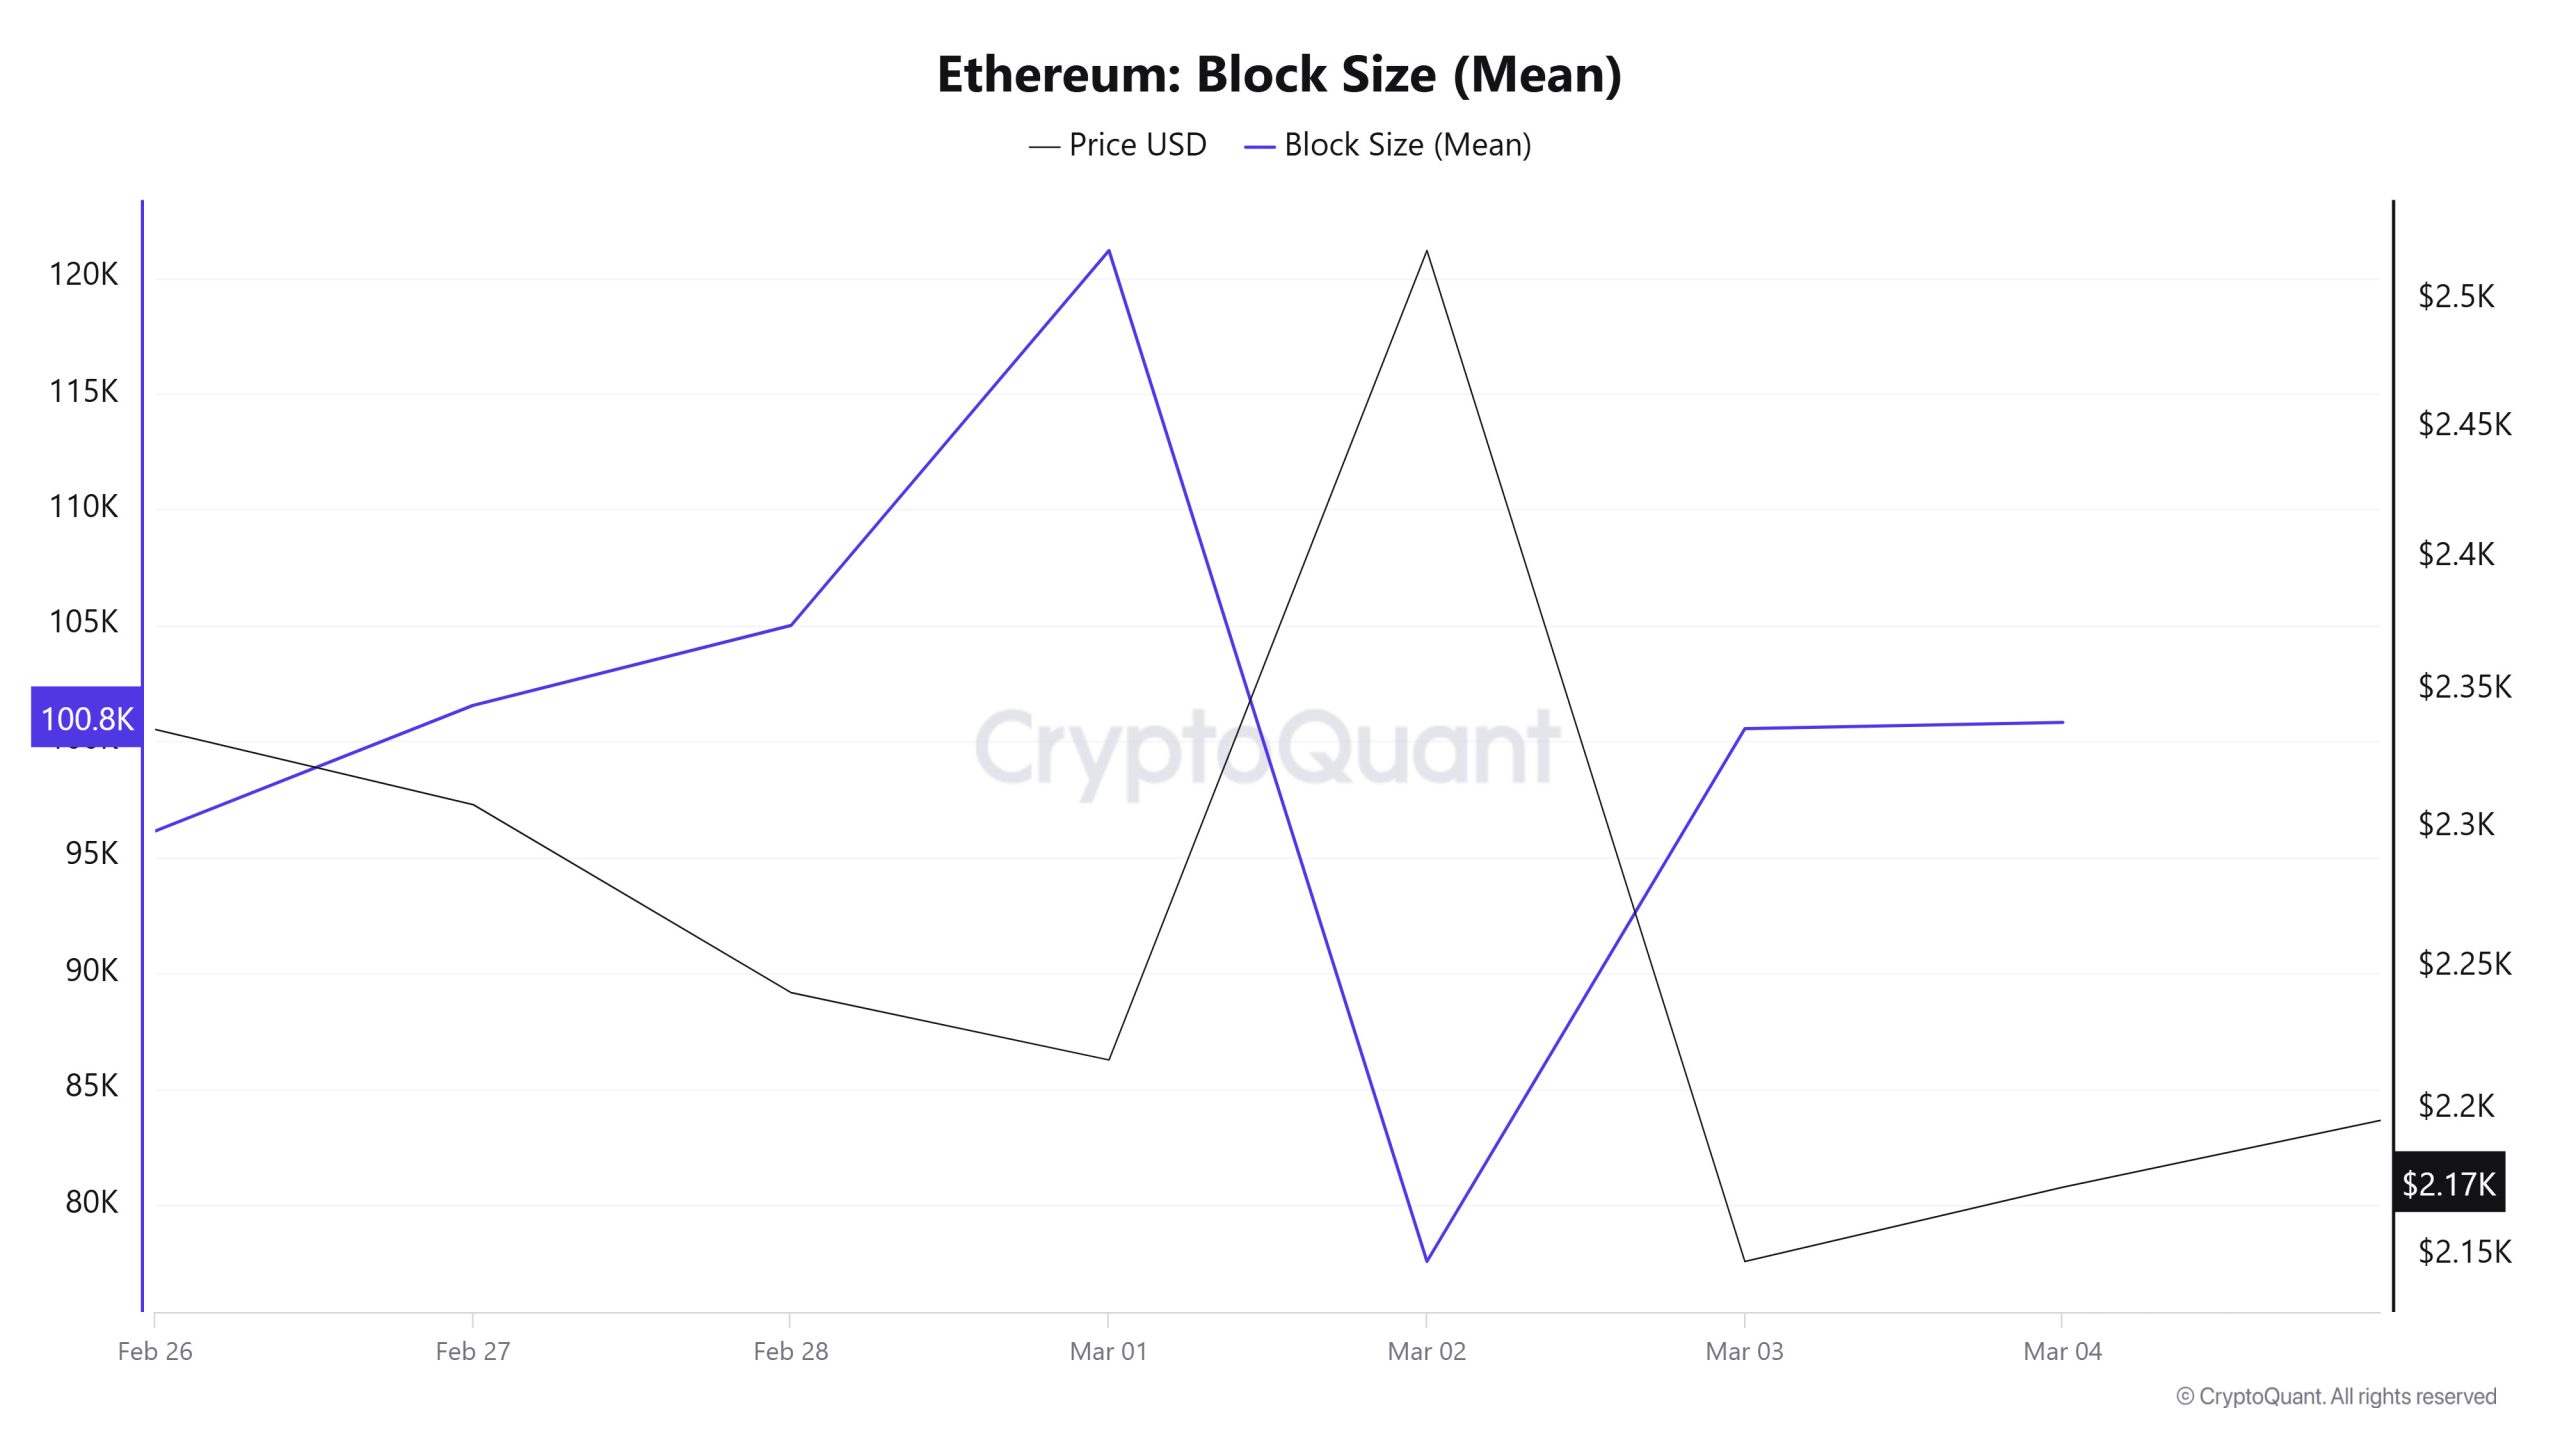
Between Febbraio 26 and Marzo 4, when we examine the Ethereum Block Size table, after the decrease in block size towards the middle of the week, it increased towards the end of the week. From 96,131 bytes on Febbraio 26, the block size reached 100,817 bytes on Marzo 4. There was a negative correlation between Block Size and Ethereum price during the week.
Block Interval
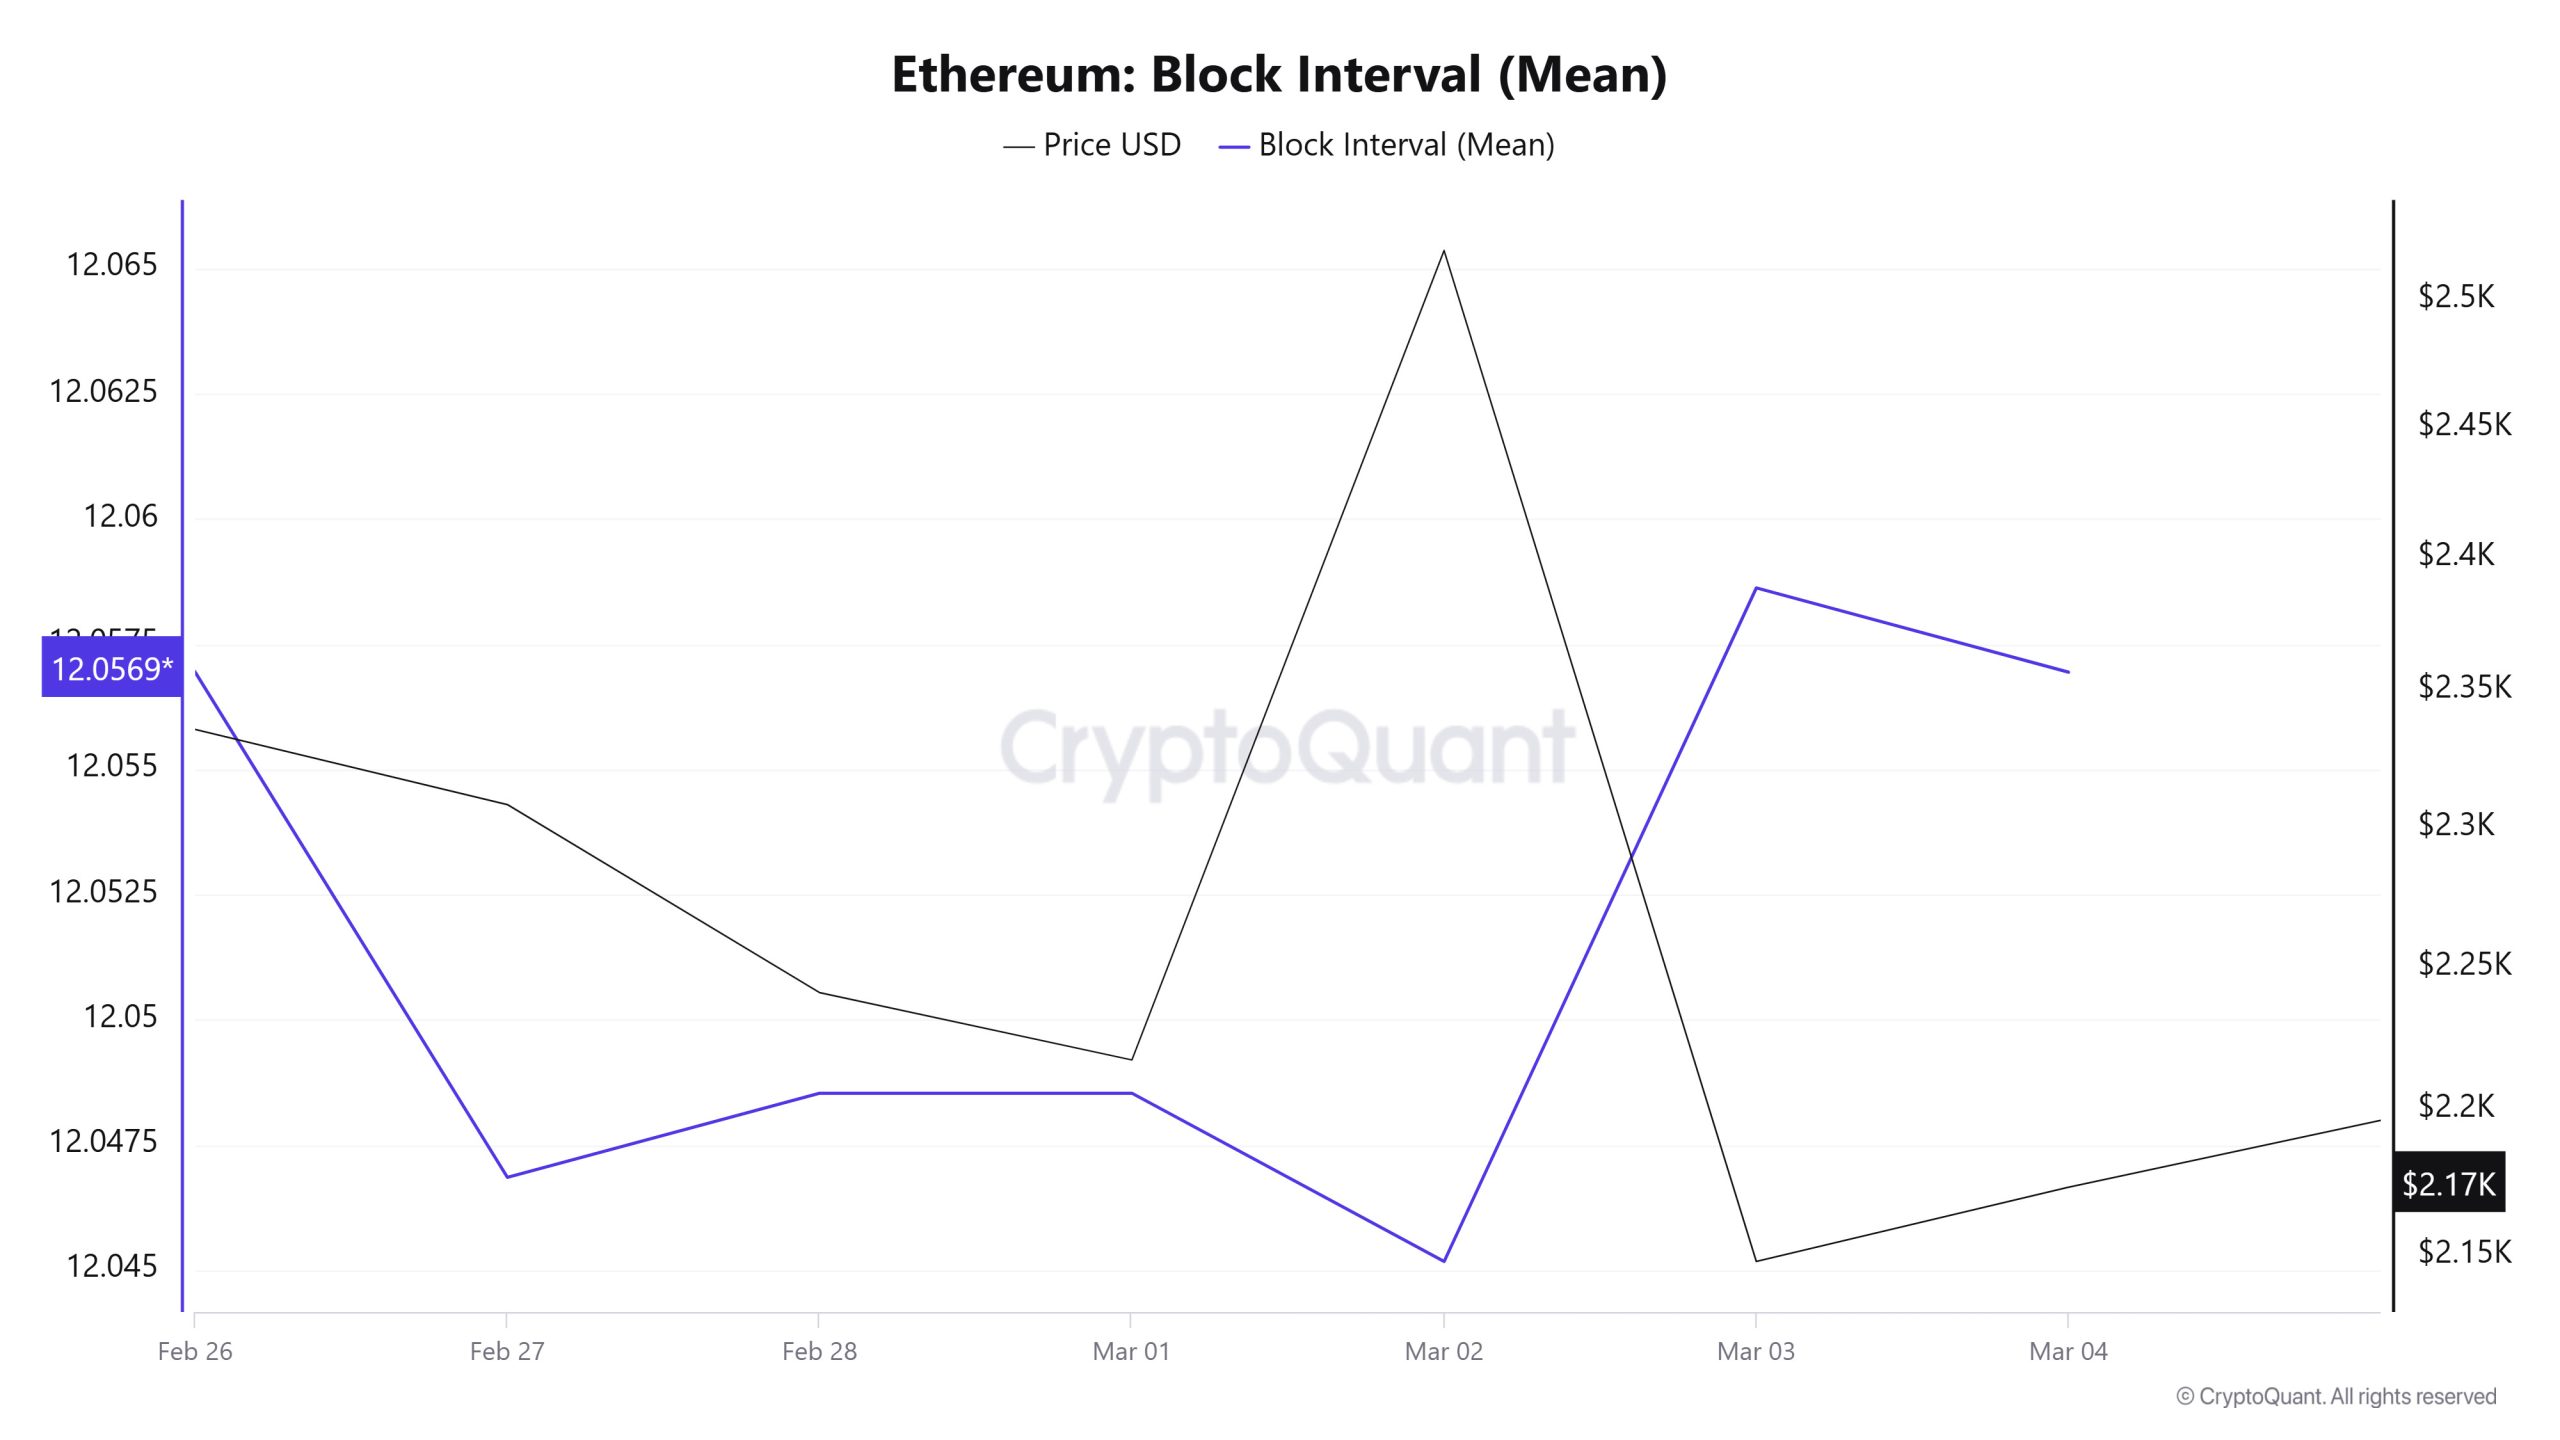
Between Febbraio 26 and Marzo 4, when we examine the Ethereum Block Interval table, there was a decrease in the time between blocks throughout the week. On Febbraio 26, the time between blocks was 12.05 seconds, which remained the same at 12.05 seconds on Marzo 4. There was a negative correlation between Block Interval and Ethereum price during the week.
Transaction
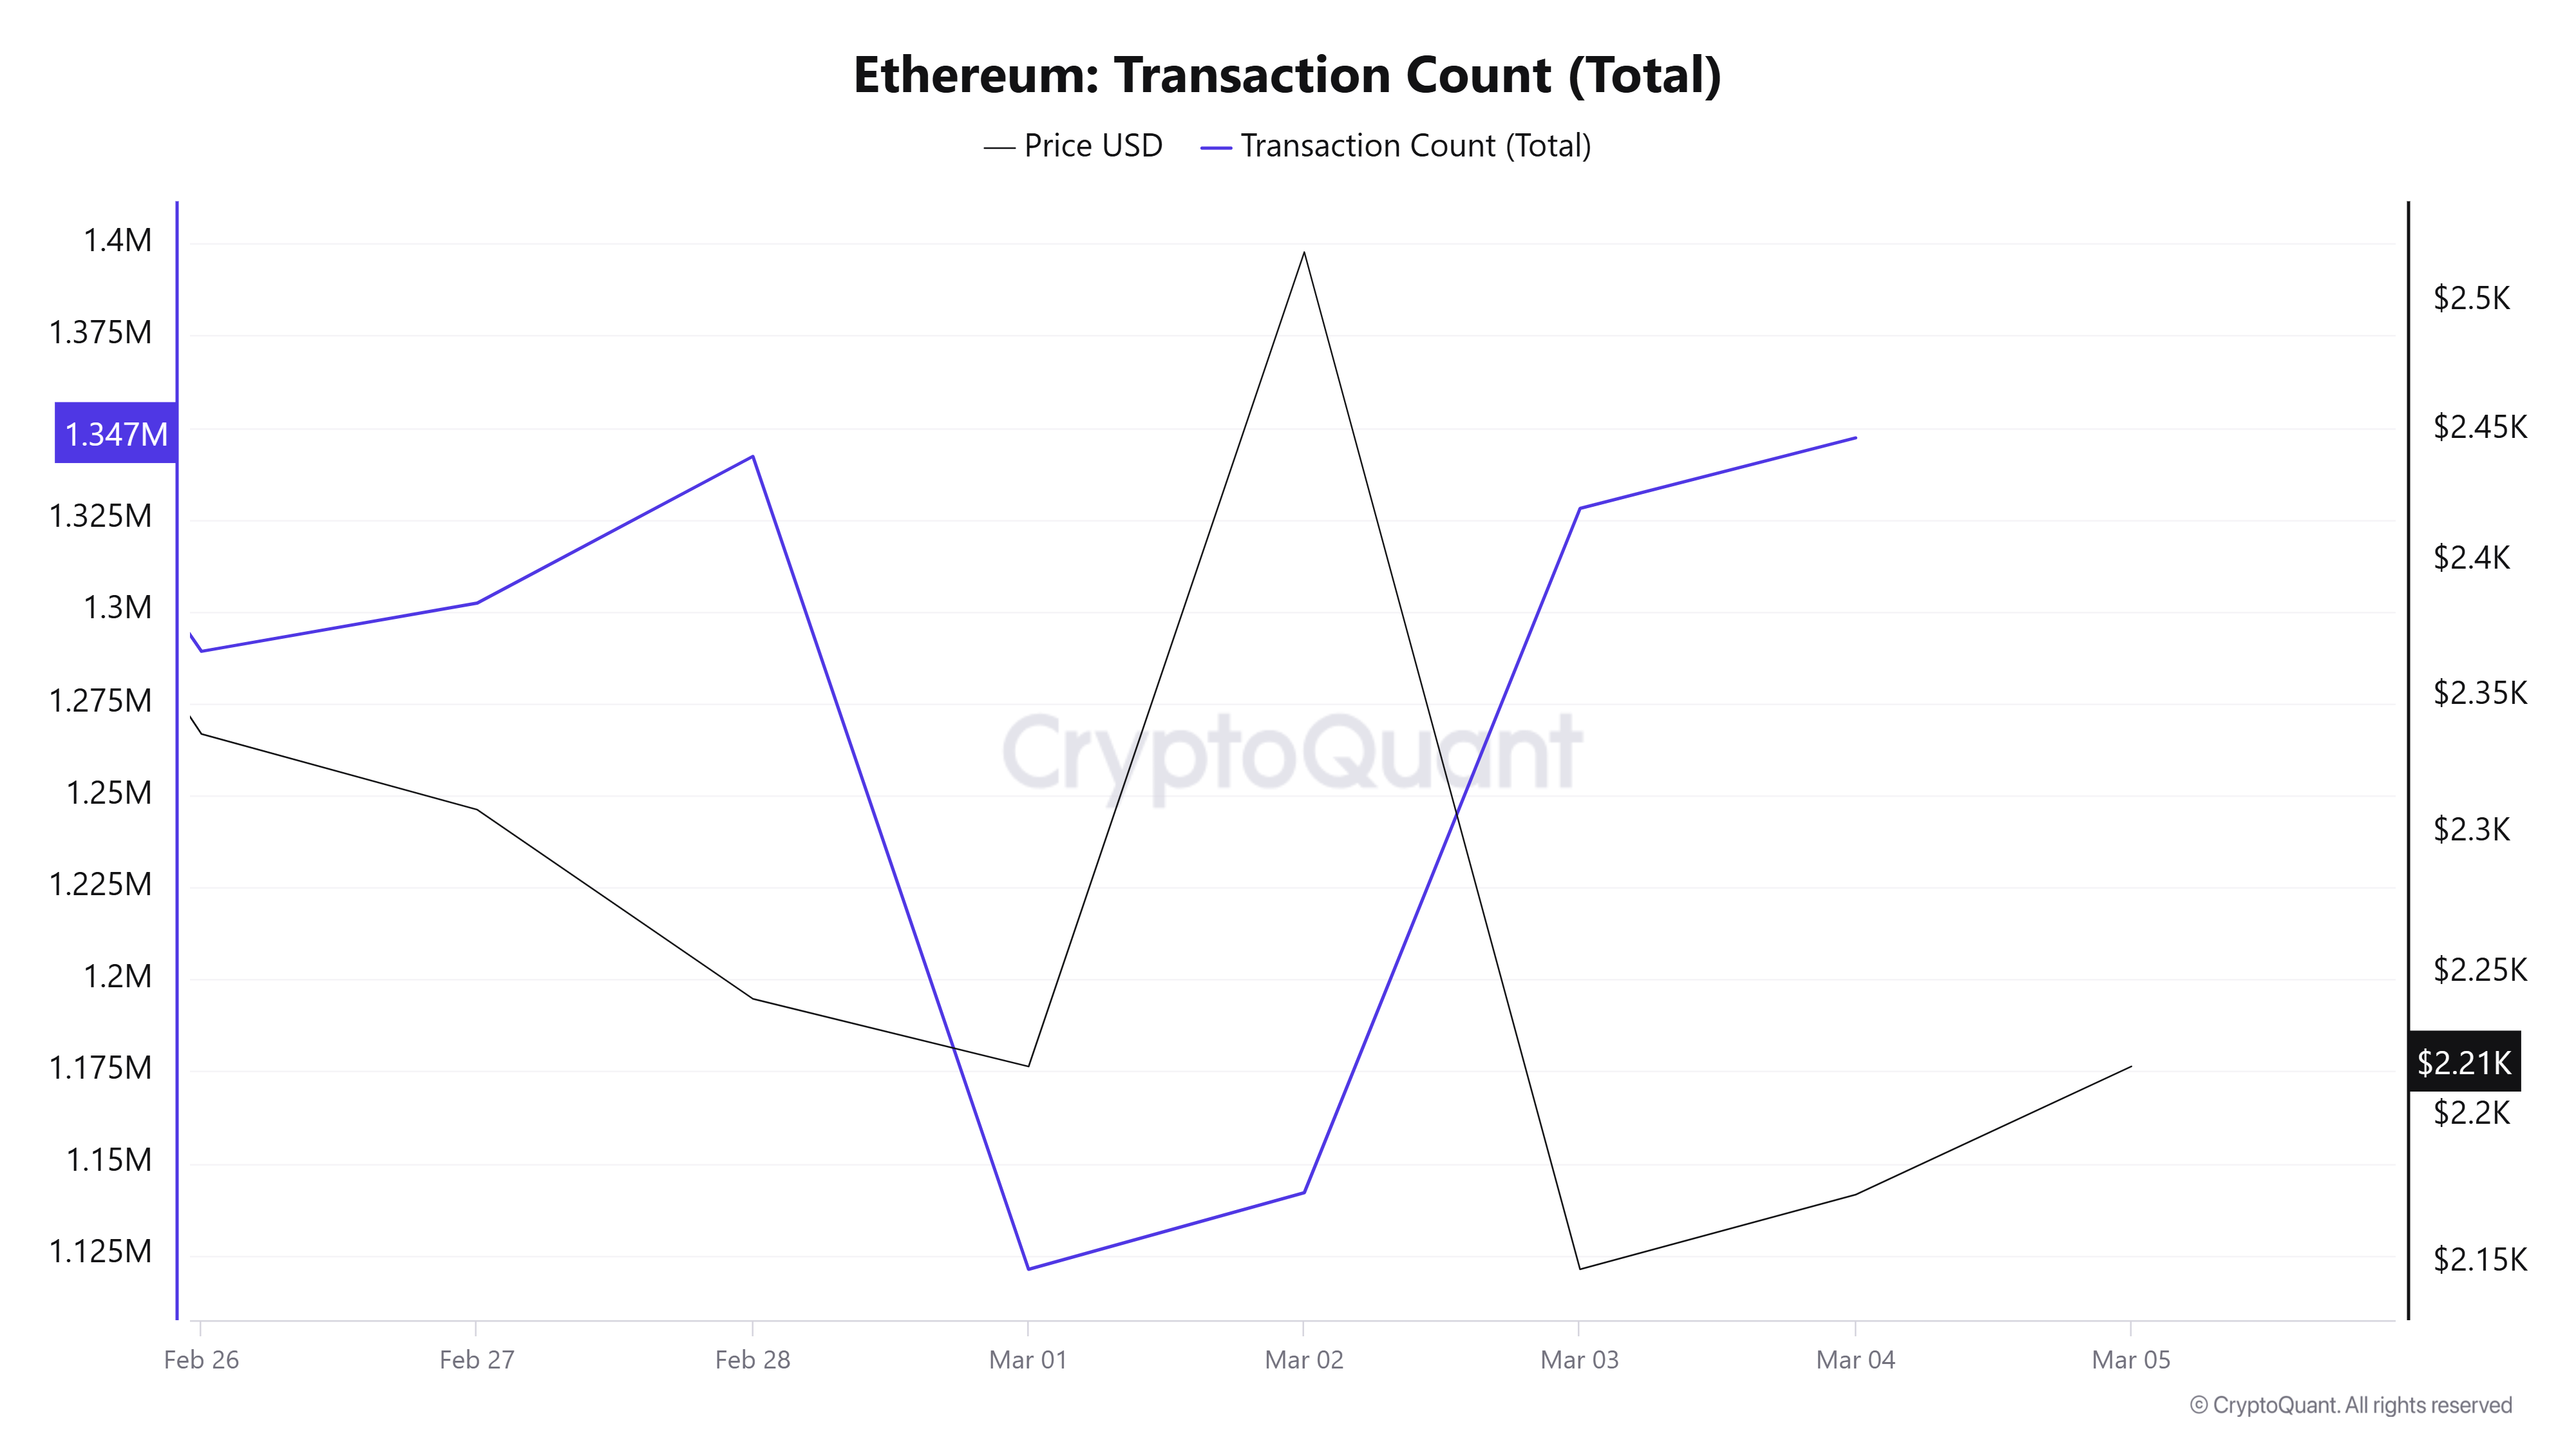
Last week, 8,944,880 transactions were processed, while this week’s number decreased by about 0.81% to 8,872,104. The highest number of transactions was 1,347,191 on Marzo 4, while Marzo 1 saw the lowest number of transactions on the network for the week with 1,121,214 transactions. While there was not much change in the number of transactions compared to last week, the decline in the price suggests that this week’s transactions were on the sell side. Nevertheless, if it is necessary to comment only on the “number of transactions”, although there is a slight decline, there does not seem to be an unusual situation on the network.
While the number of Ethereum transferred last week was 17,551,792, 18,911,427 Ethereum was transferred this week, an increase of 7.75%. On Marzo 1, 1,575,385 Ethereum was transferred, the lowest number of transfers of the week, while the day before, 3,470,559 Ethereum was transferred, the highest number of transfers of the week.
In contrast to the decrease in the number of transactions, the increase in the amount of Ethereum transferred and the outflows from Spot Ethereum ETFs suggest that institutional selling pressure may be reflected in on-chain data. Despite a slight decrease in the number of transactions compared to last week, the total amount of Ethereum transferred increased, indicating that the average transfer size increased. This suggests that volatile movements are effective in the market and the impact of institutional investors’ selling waves on the market continued this week.
Estimated Leverage Ratio
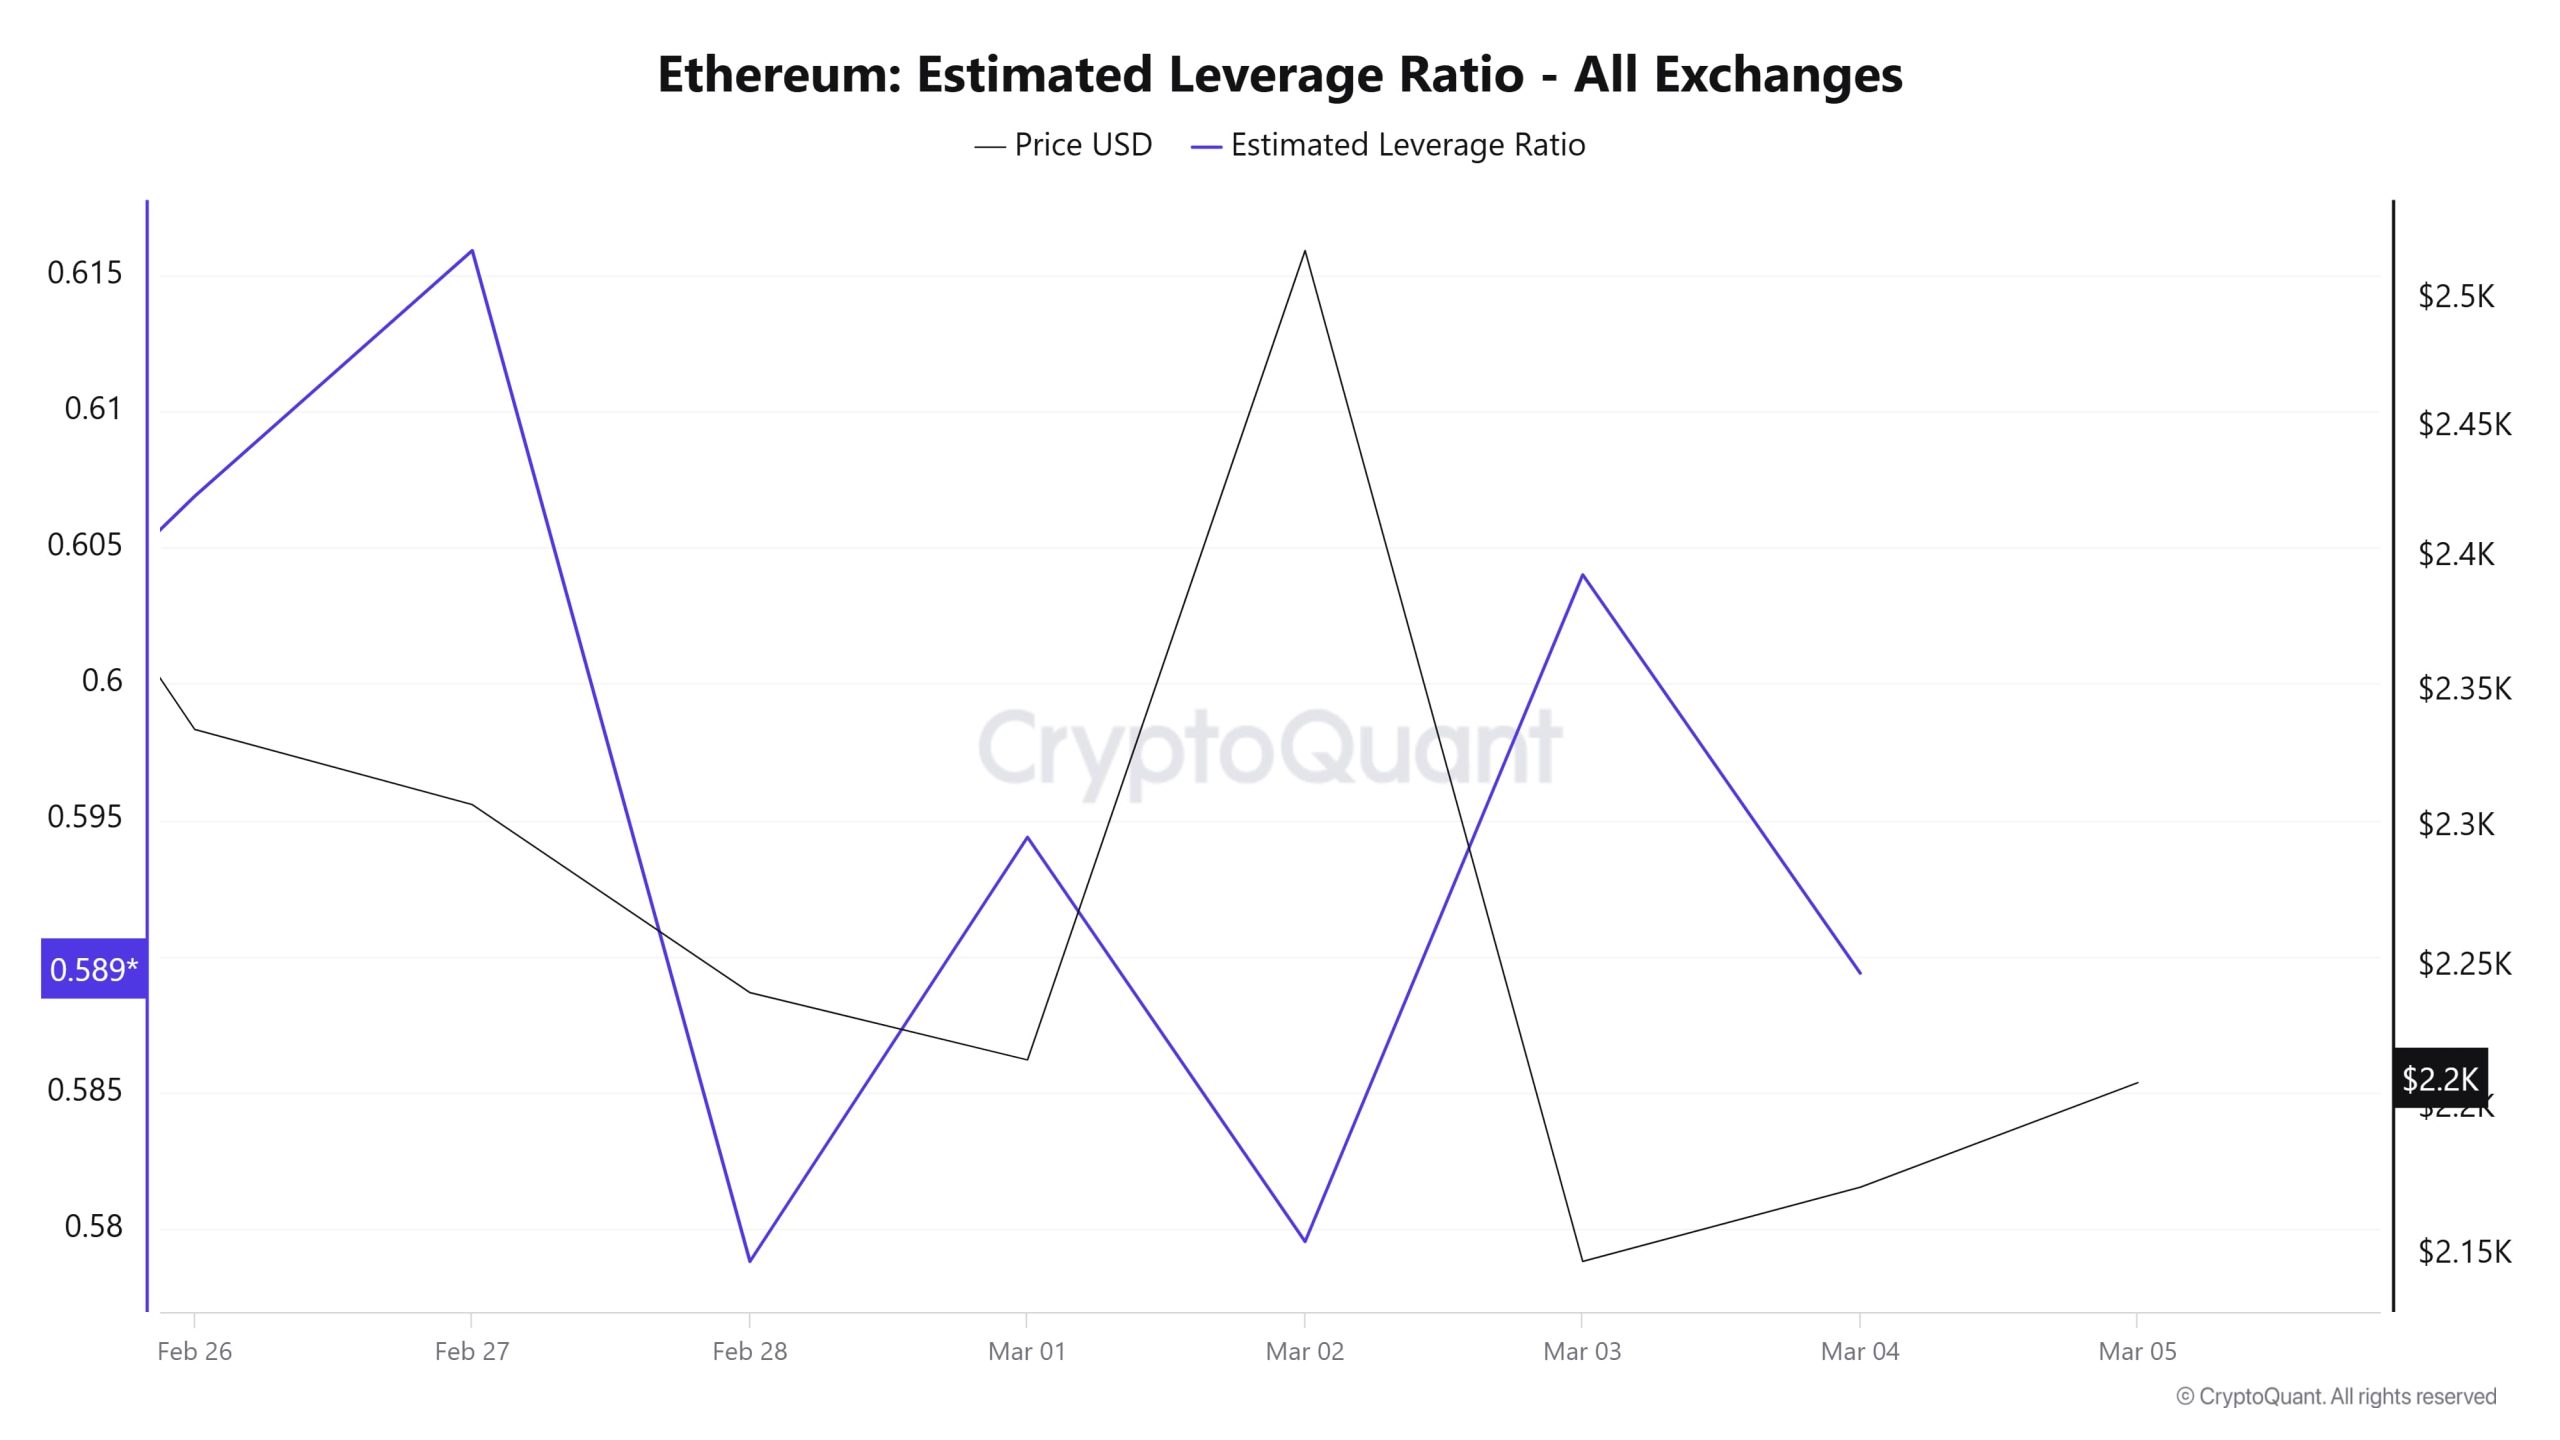
Rising at the beginning of the 7-day period, the metric displayed a horizontal outlook towards the end. ELR (Estimated Leverage Ratio), which had a value of 0.606 at the beginning of the process, is currently at 0.589. Its highest level was 0.615 at the beginning of the process. A higher ELR means that participants are willing to assume more risk and usually indicates bullish conditions or expectations. It should be noted that these rises can also be caused by a decrease in reserves. When we look at Ethereum reserves, while there were 18.73 million reserves at the beginning of the process, this figure exceeded 19 million towards the end of the process due to Trump’s statements. Today, the number of reserves of approximately 19.15 million is noteworthy. At the same time, Ethereum’s Open Interest has dropped from $ 21.88 billion to $ 18.75 billion in the last few days. Despite this data, the rise in the chart is promising for Ethereum, but it coincides with a parallel drop in the price of the asset from $ 2,500 to $ 2,200. The increase in the ELR rate despite the increase in both the reserve ratio and the decrease in the open interest rate shows us the investor’s confidence in Ethereum. As a result, despite the increase in reserves, the increase in the ELR metric reveals that there is a bullish expectation. If the price exceeds the $2500 threshold, leveraged transactions may increase as participants regain their confidence.
AVVISO LEGALE
Le informazioni, i commenti e le raccomandazioni sugli investimenti contenuti nel presente documento non costituiscono servizi di consulenza sugli investimenti. I servizi di consulenza sugli investimenti sono forniti da istituti autorizzati su base personale, tenendo conto delle preferenze di rischio e di rendimento dei singoli. I commenti e le raccomandazioni contenuti nel presente documento sono di tipo generale. Tali raccomandazioni potrebbero non essere adatte alla vostra situazione finanziaria e alle vostre preferenze di rischio e rendimento. Pertanto, prendere una decisione di investimento basandosi esclusivamente sulle informazioni contenute nel presente documento potrebbe non portare a risultati in linea con le vostre aspettative.
NOTE: All data used in Bitcoin onchain analysis is based on Cryptoqaunt.

