
Market Analysis
Introduction
In the Bitcoin futures market, traditional price charts, as well as order book and volume-based data, provide a good indication of the future direction of the market. In this report, Bitcoin: Futures Taker CVD (Cumulative Volume Delta, 90-day) and Futures Volume Bubble Map, we examine how trading biases are shaping the direction of the market, especially for large players.
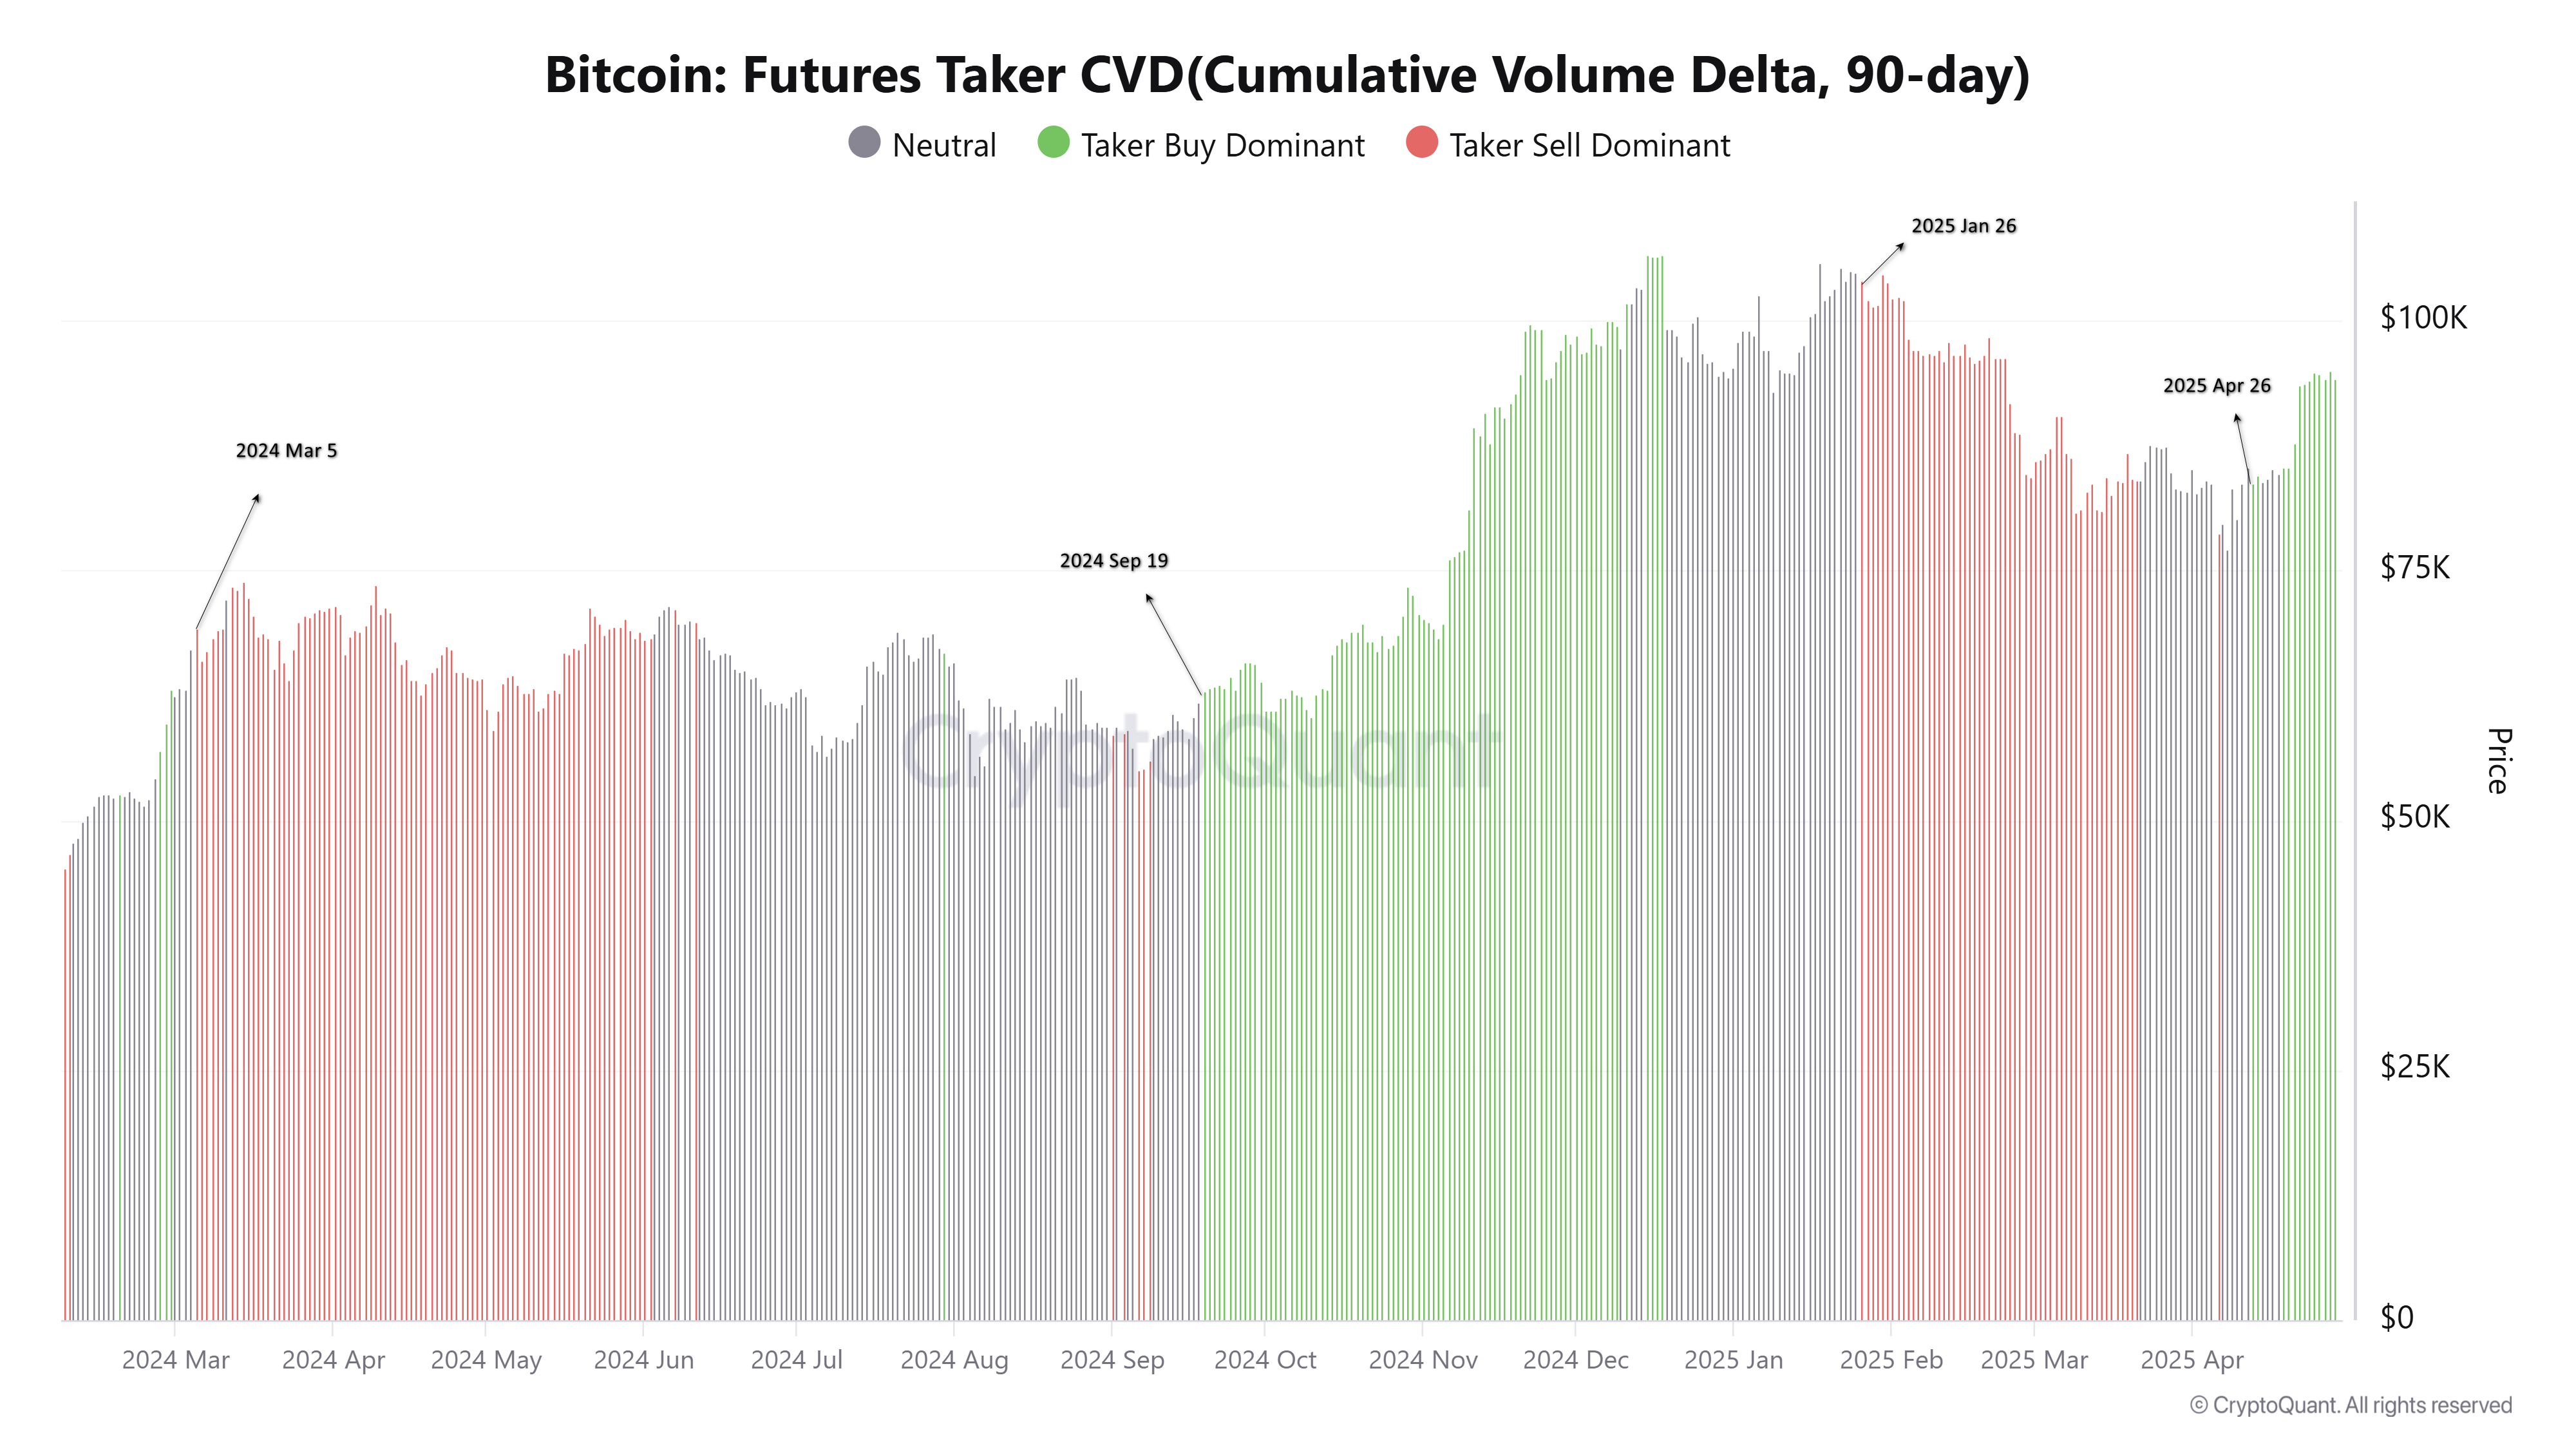
- Bitcoin: Futures Taker CVD (Cumulative Volume Delta, 90-day): The cumulative 90-day difference between market-order buy and sell trades in futures. A positive CVD indicates that aggressive buy orders at the market price are dominating and buyers are trying to push the price up. Conversely, a negative CVD indicates that aggressive sell trades dominate and put downward pressure on the price.
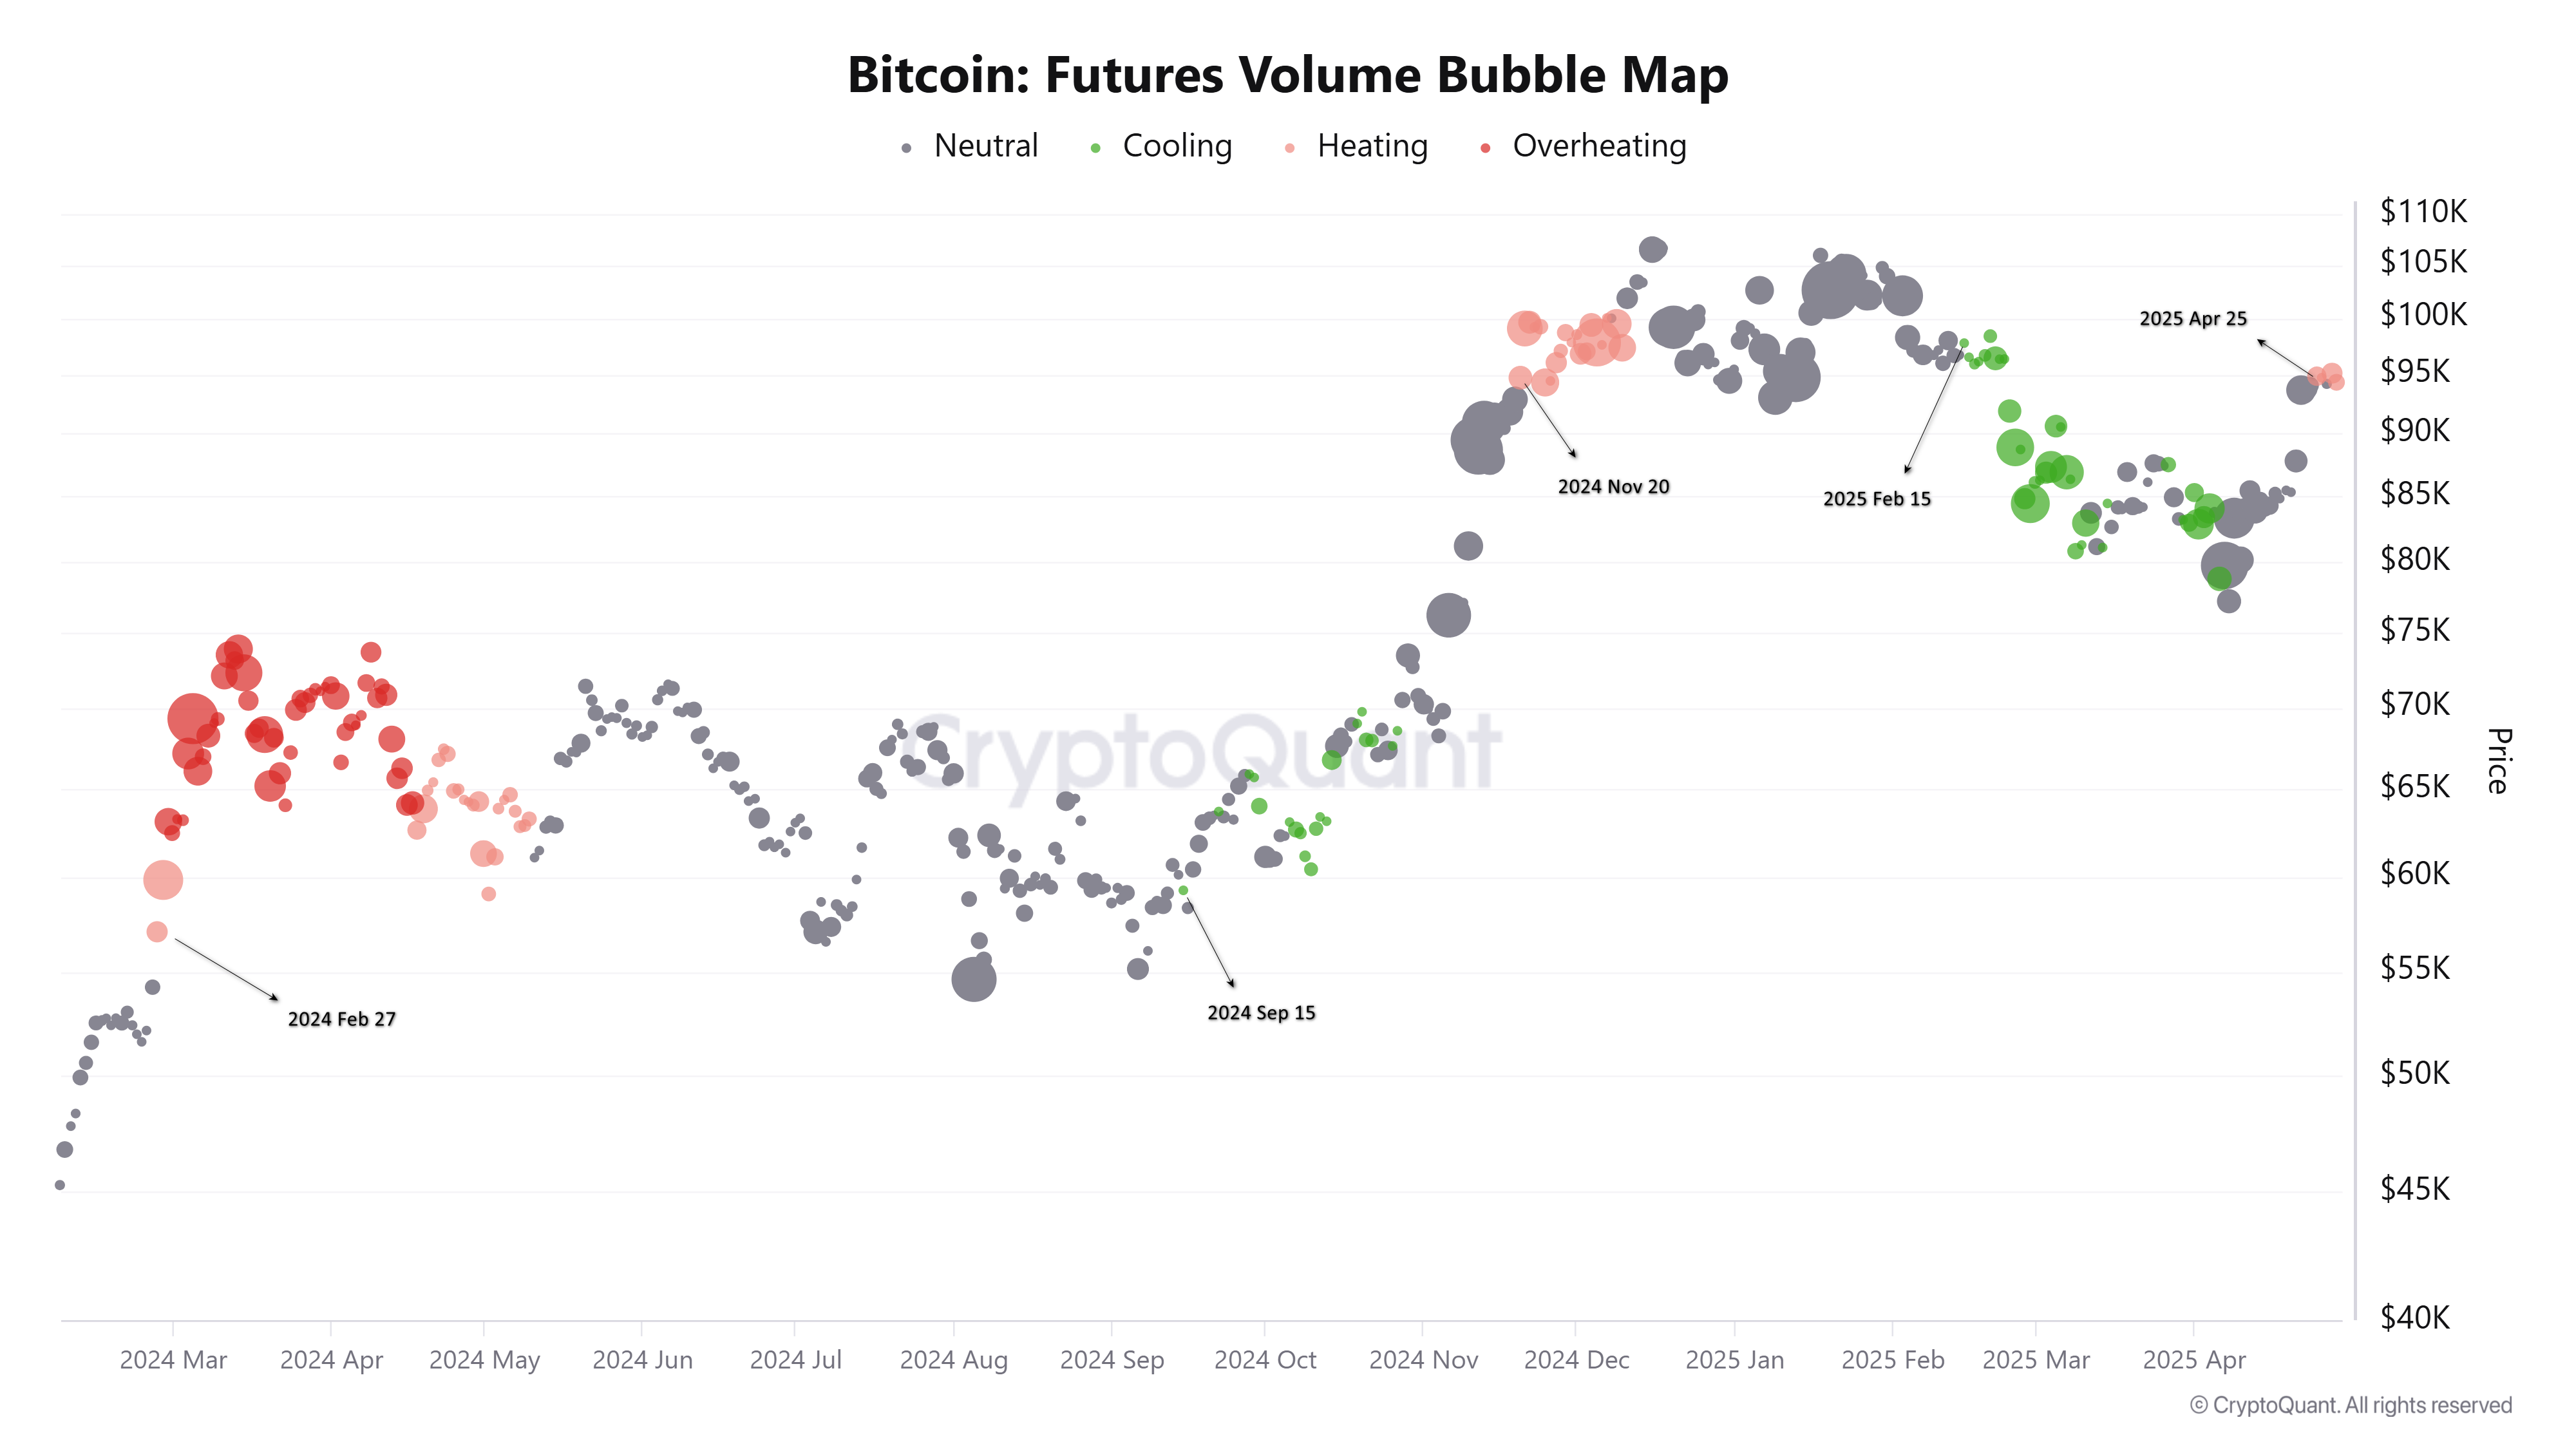
- Futures Volume Bubble Map: Visualizes futures volumes concentrated by price levels in the form of bubbles. These bubbles provide information about potential support/resistance levels, where major players are positioned and possible liquidation areas.
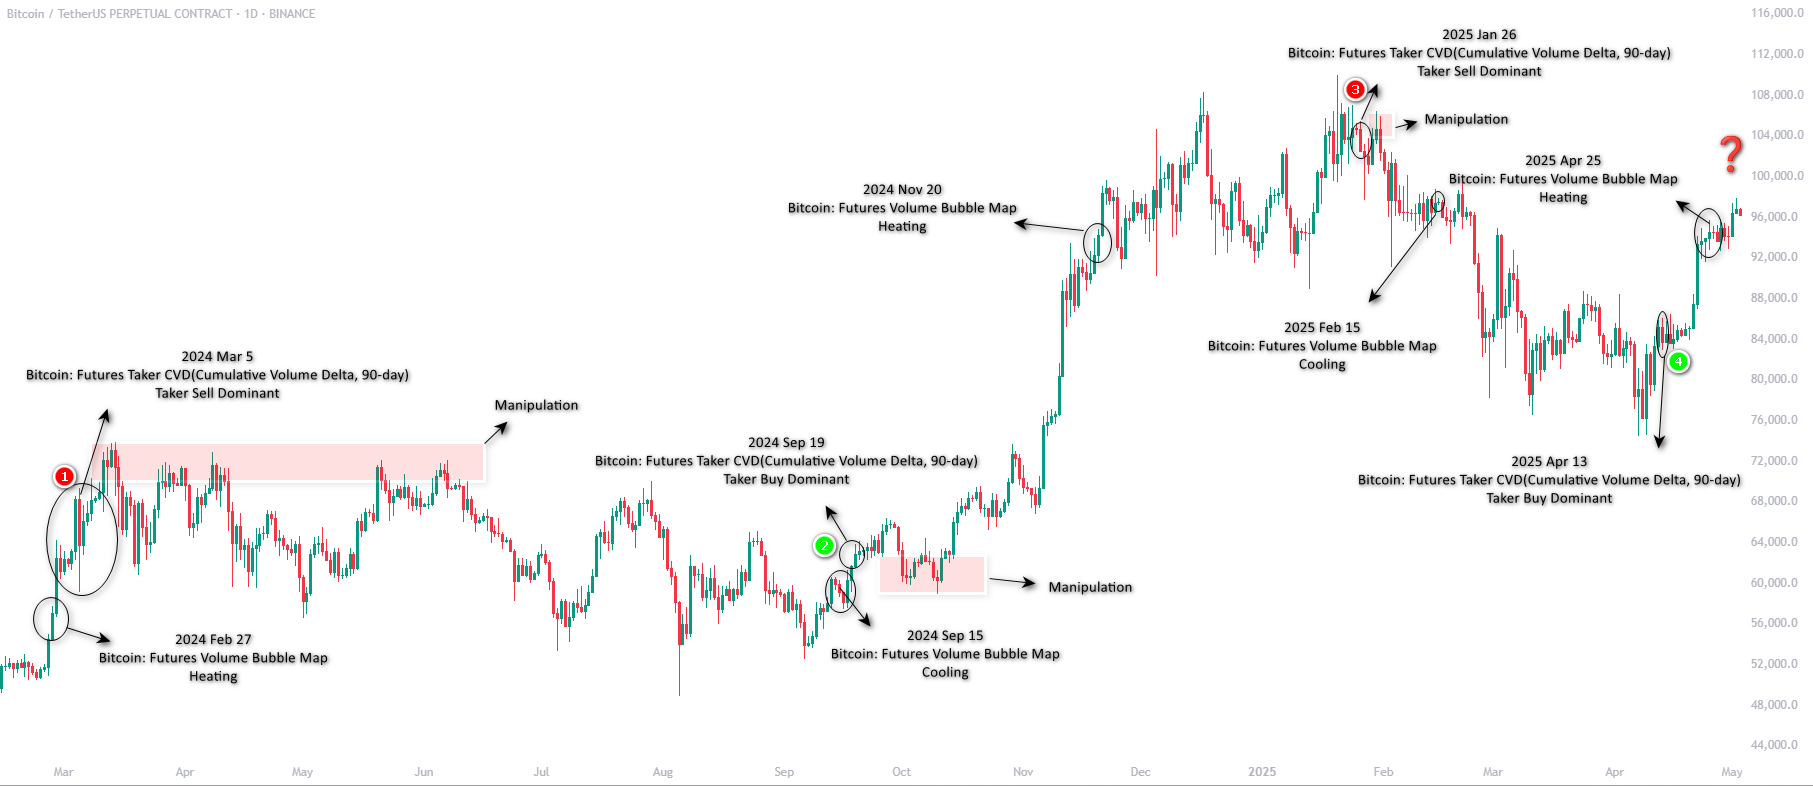
February 27, 2024 – March 5, 2024
In this period, it was observed that the Taker Sell pressure became evident shortly after the Heating signal was detected in the market. This structure indicates that after a period when the market transitioned to the overbought zone, sell trades dominated and the downtrend started.
September 15 – 19, 2024
While the market momentum weakened with the cooling signal, it was observed that buy trades gained weight within a few days. With the emergence of Taker Buy dominance, the trend direction turned upwards, and the uptrend started. This indicates that the buying interest following the cooling phase pushed prices up.
November 20, 2024 – January 26, 2025
In this example, the market showed limited price movement for about two months after the Heating signal. This sideways period indicates that prices were unable to maintain the upward momentum and new buyer inflows were insufficient. As of January 26, Taker Sell dominance became evident, confirming that aggressive sell trades gained weight and the downtrend started. This structure points to the technical breakdown that emerged as the upside liquidity was consumed over time and buying pressure weakened.
February 15 – April 13, 2025
During this period, the market moved away from overheating with the Cooling signal, limiting trading volume and momentum. About two months later, Taker Buy trades became dominant, indicating that buyer interest regained strength and the market returned to an uptrend. This structure indicates that the trend reversal was realized with the volume buying that followed the position accumulation at the bottom.
Current Situation and Conclusion
As of April 25, 2025, a Heating signal has formed in the market, indicating that aggressive buying has increased and the market has entered the warm-up phase. However, on the Futures side, no selling dominance has been observed yet and buyers still remain dominant. This suggests that despite the upward momentum, selling pressure has not yet kicked in and liquidity is being distributed in a healthy manner. In past examples, Taker Sell dominance after the Heating signal usually signaled trend reversals.
In this context, tools such as Futures Volume Bubble Map and Taker CVD play a critical role in gaining a deep understanding of market dynamics. By analysing the trading biases and positions of major players, early signals about future trend reversals can be obtained. For the time being, buyer pressure continues on the futures side, but when the selling pressure will kick in and how the market will take shape are among the important factors to be monitored in the coming days.
Disclaimer
This report was prepared for informational and research purposes only. It does not constitute investment advice, financial guidance, or a recommendation to buy or sell any asset. Cryptocurrency futures, derivatives, and digital assets carry significant risk and may result in the loss of capital. Market interpretations, CVD data, volume maps, and examples provided here reflect historical patterns and may not predict future outcomes. Investors should evaluate their financial situation, risk tolerance, and goals before making any investment decisions. Darkex Research is not responsible for any financial losses arising from decisions based on this analysis.