
Breakdowns
MRVR
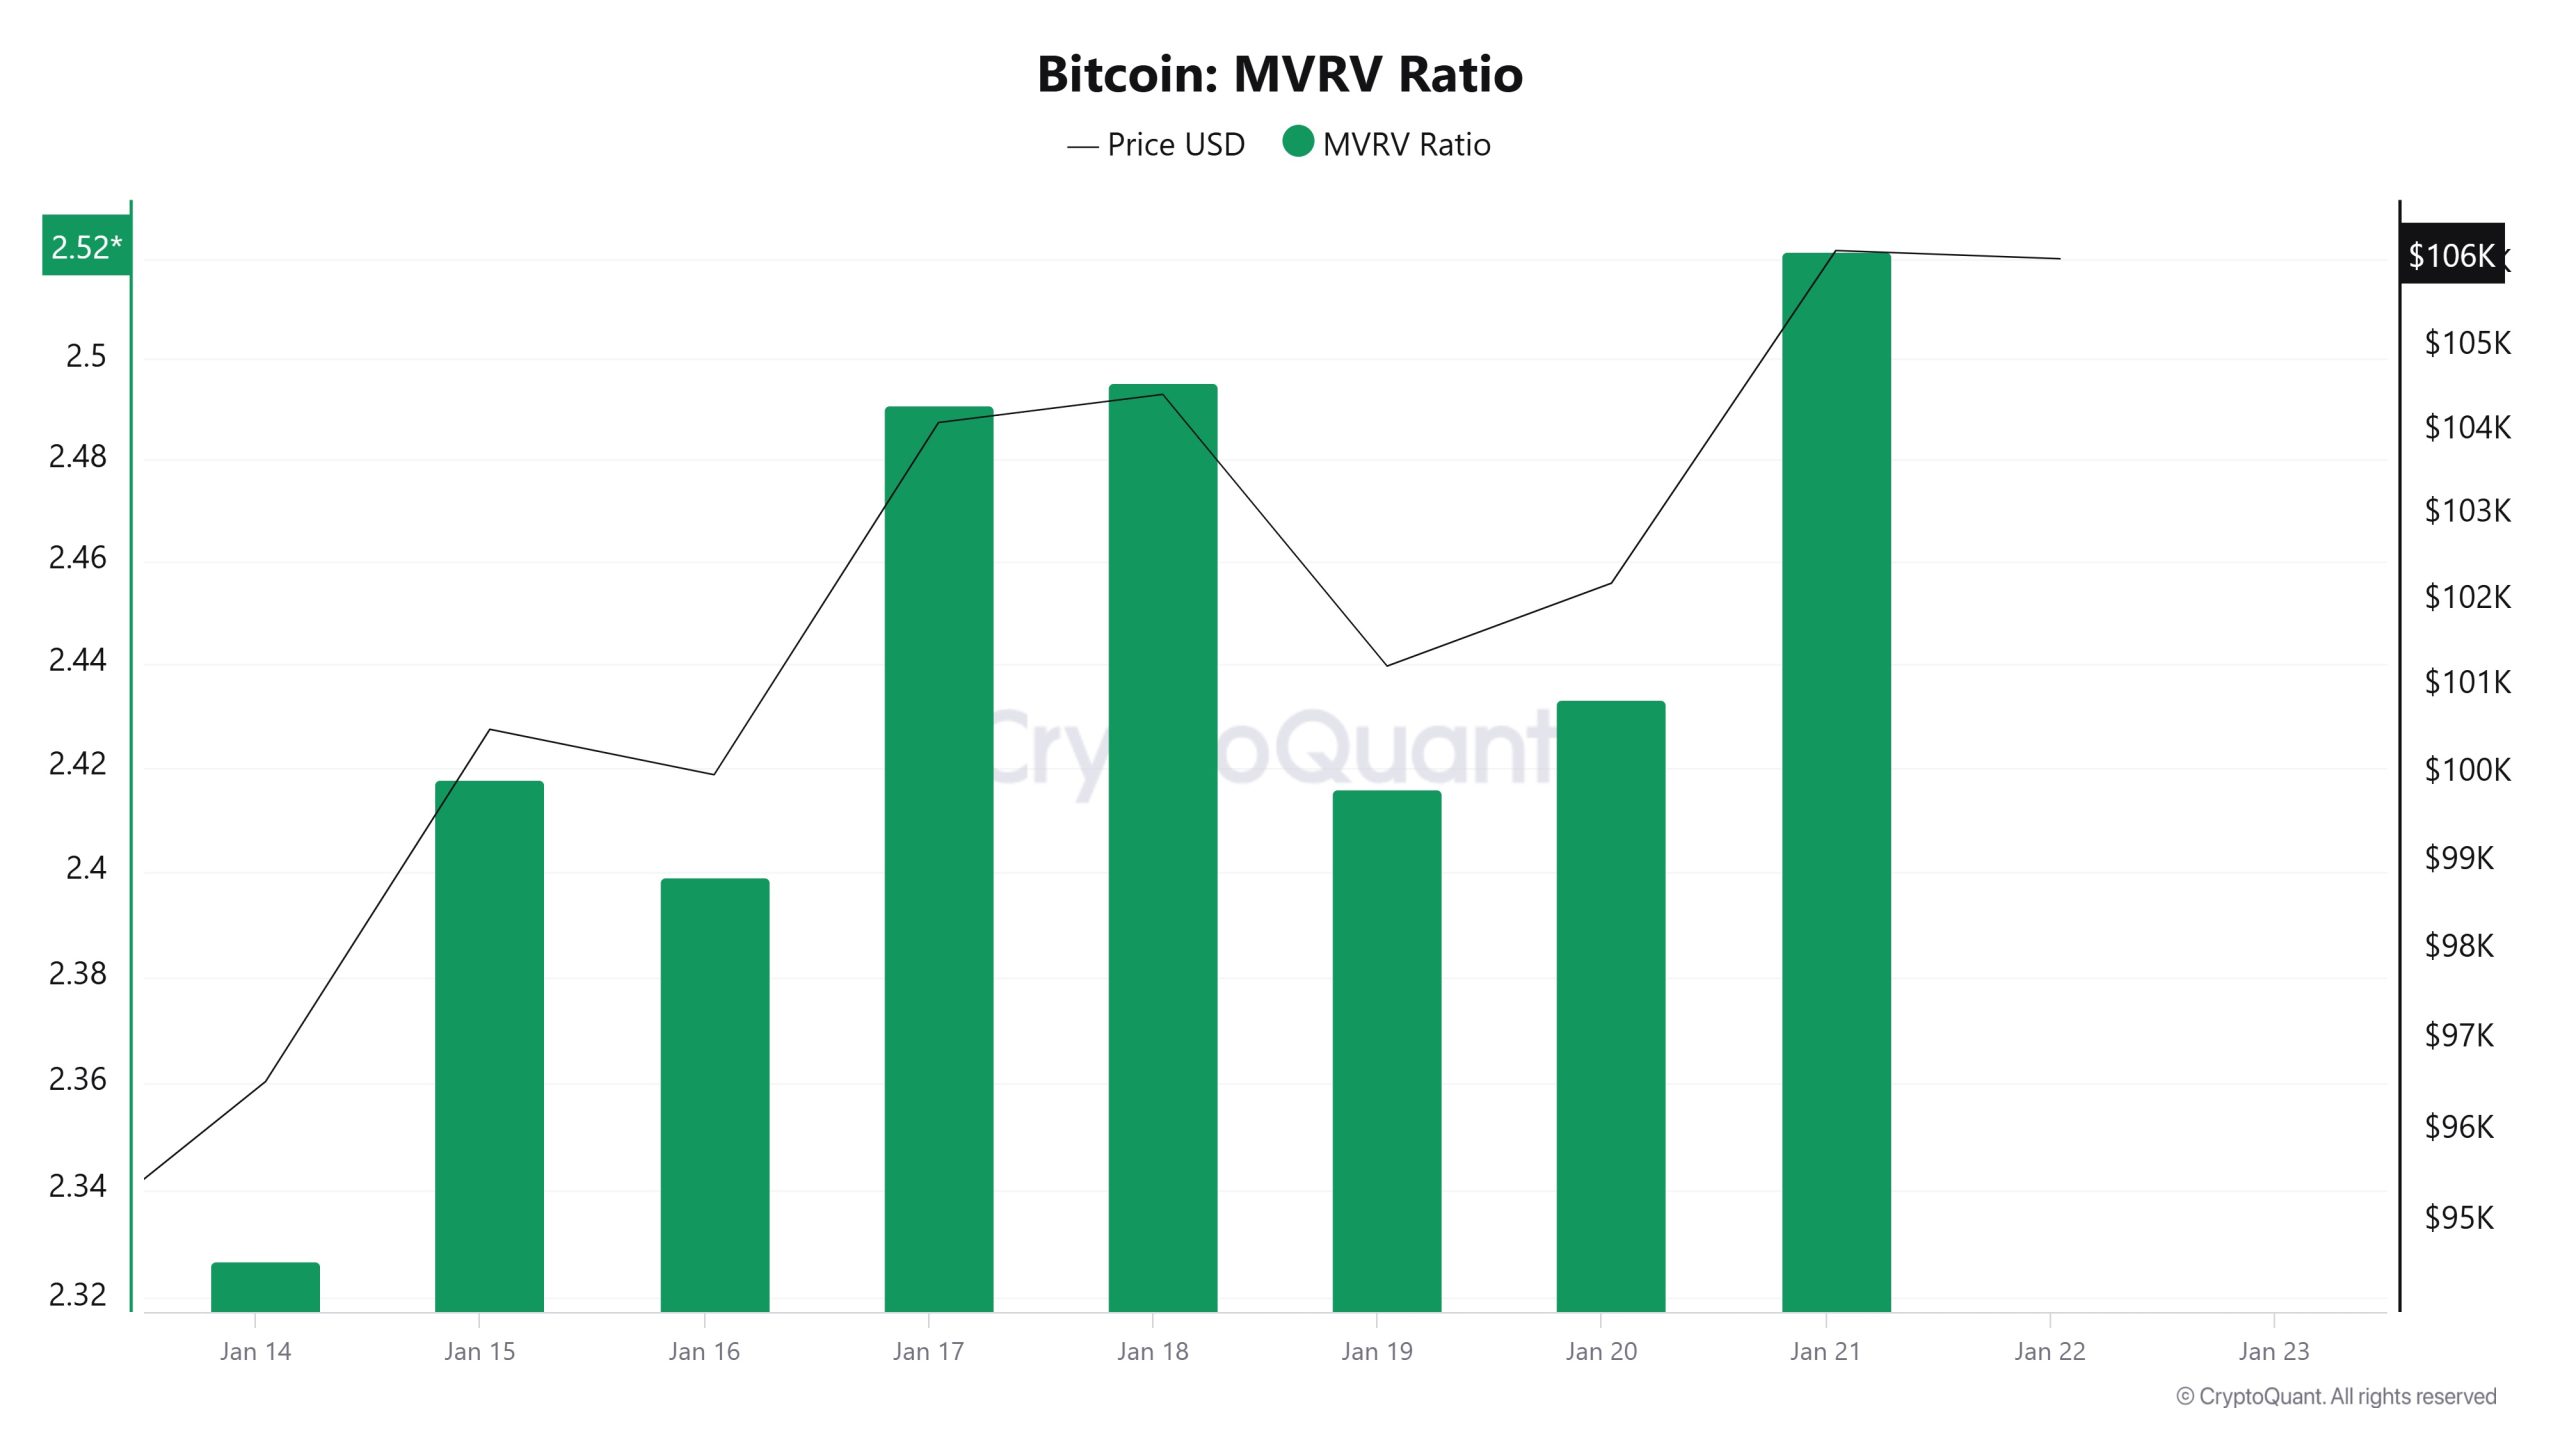
On Ocak 15, the Bitcoin price was 100,503 while the MVRV Ratio was 2.41. As of Ocak 21, the Bitcoin price was at 106,164, while the MVRV Ratio was 2.52. Compared to last week, Bitcoin price increased by 5.63% and MVRV Ratio increased by 4.56%.
Realized Price
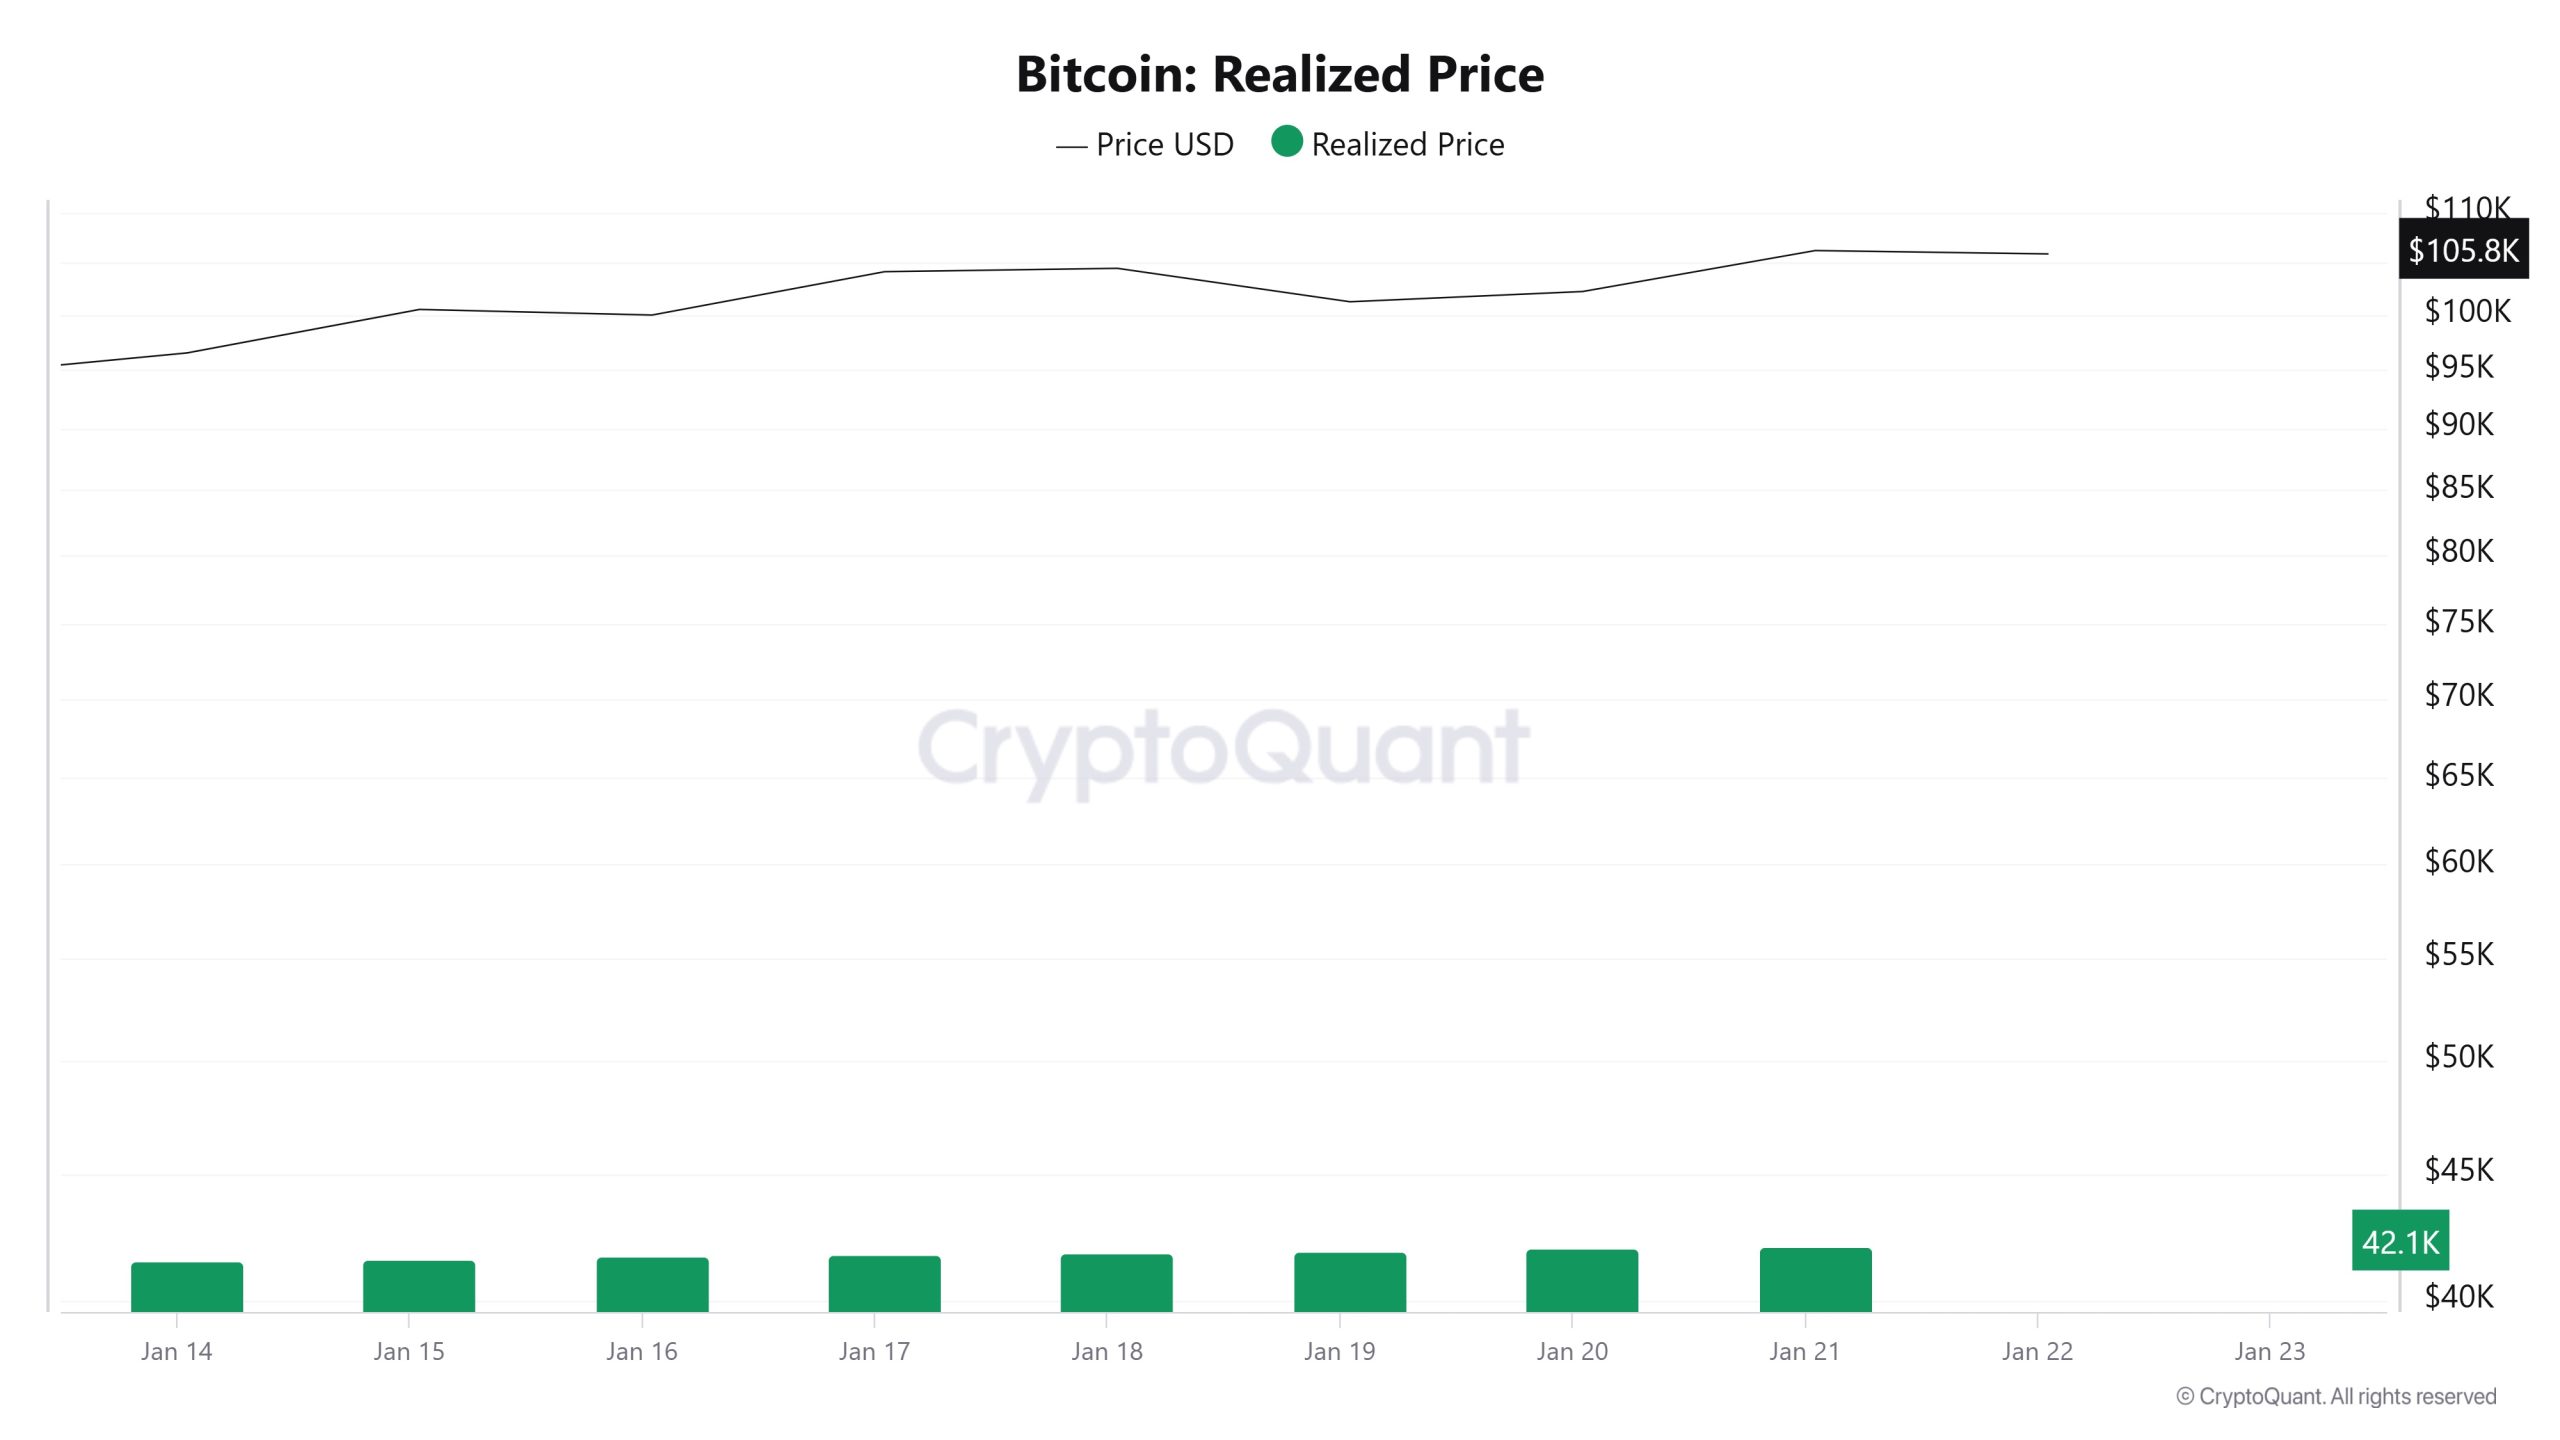
On Ocak 15, the Bitcoin price was 100,503 while the Realized Price was 41,571. As of Ocak 21, Bitcoin price rose to 106,164 while Realized Price increased to 42,101. Compared to last week, Bitcoin price increased by 5.63% and Realized Price increased by 1.27
Spent Output Profit Ratio (SOPR)
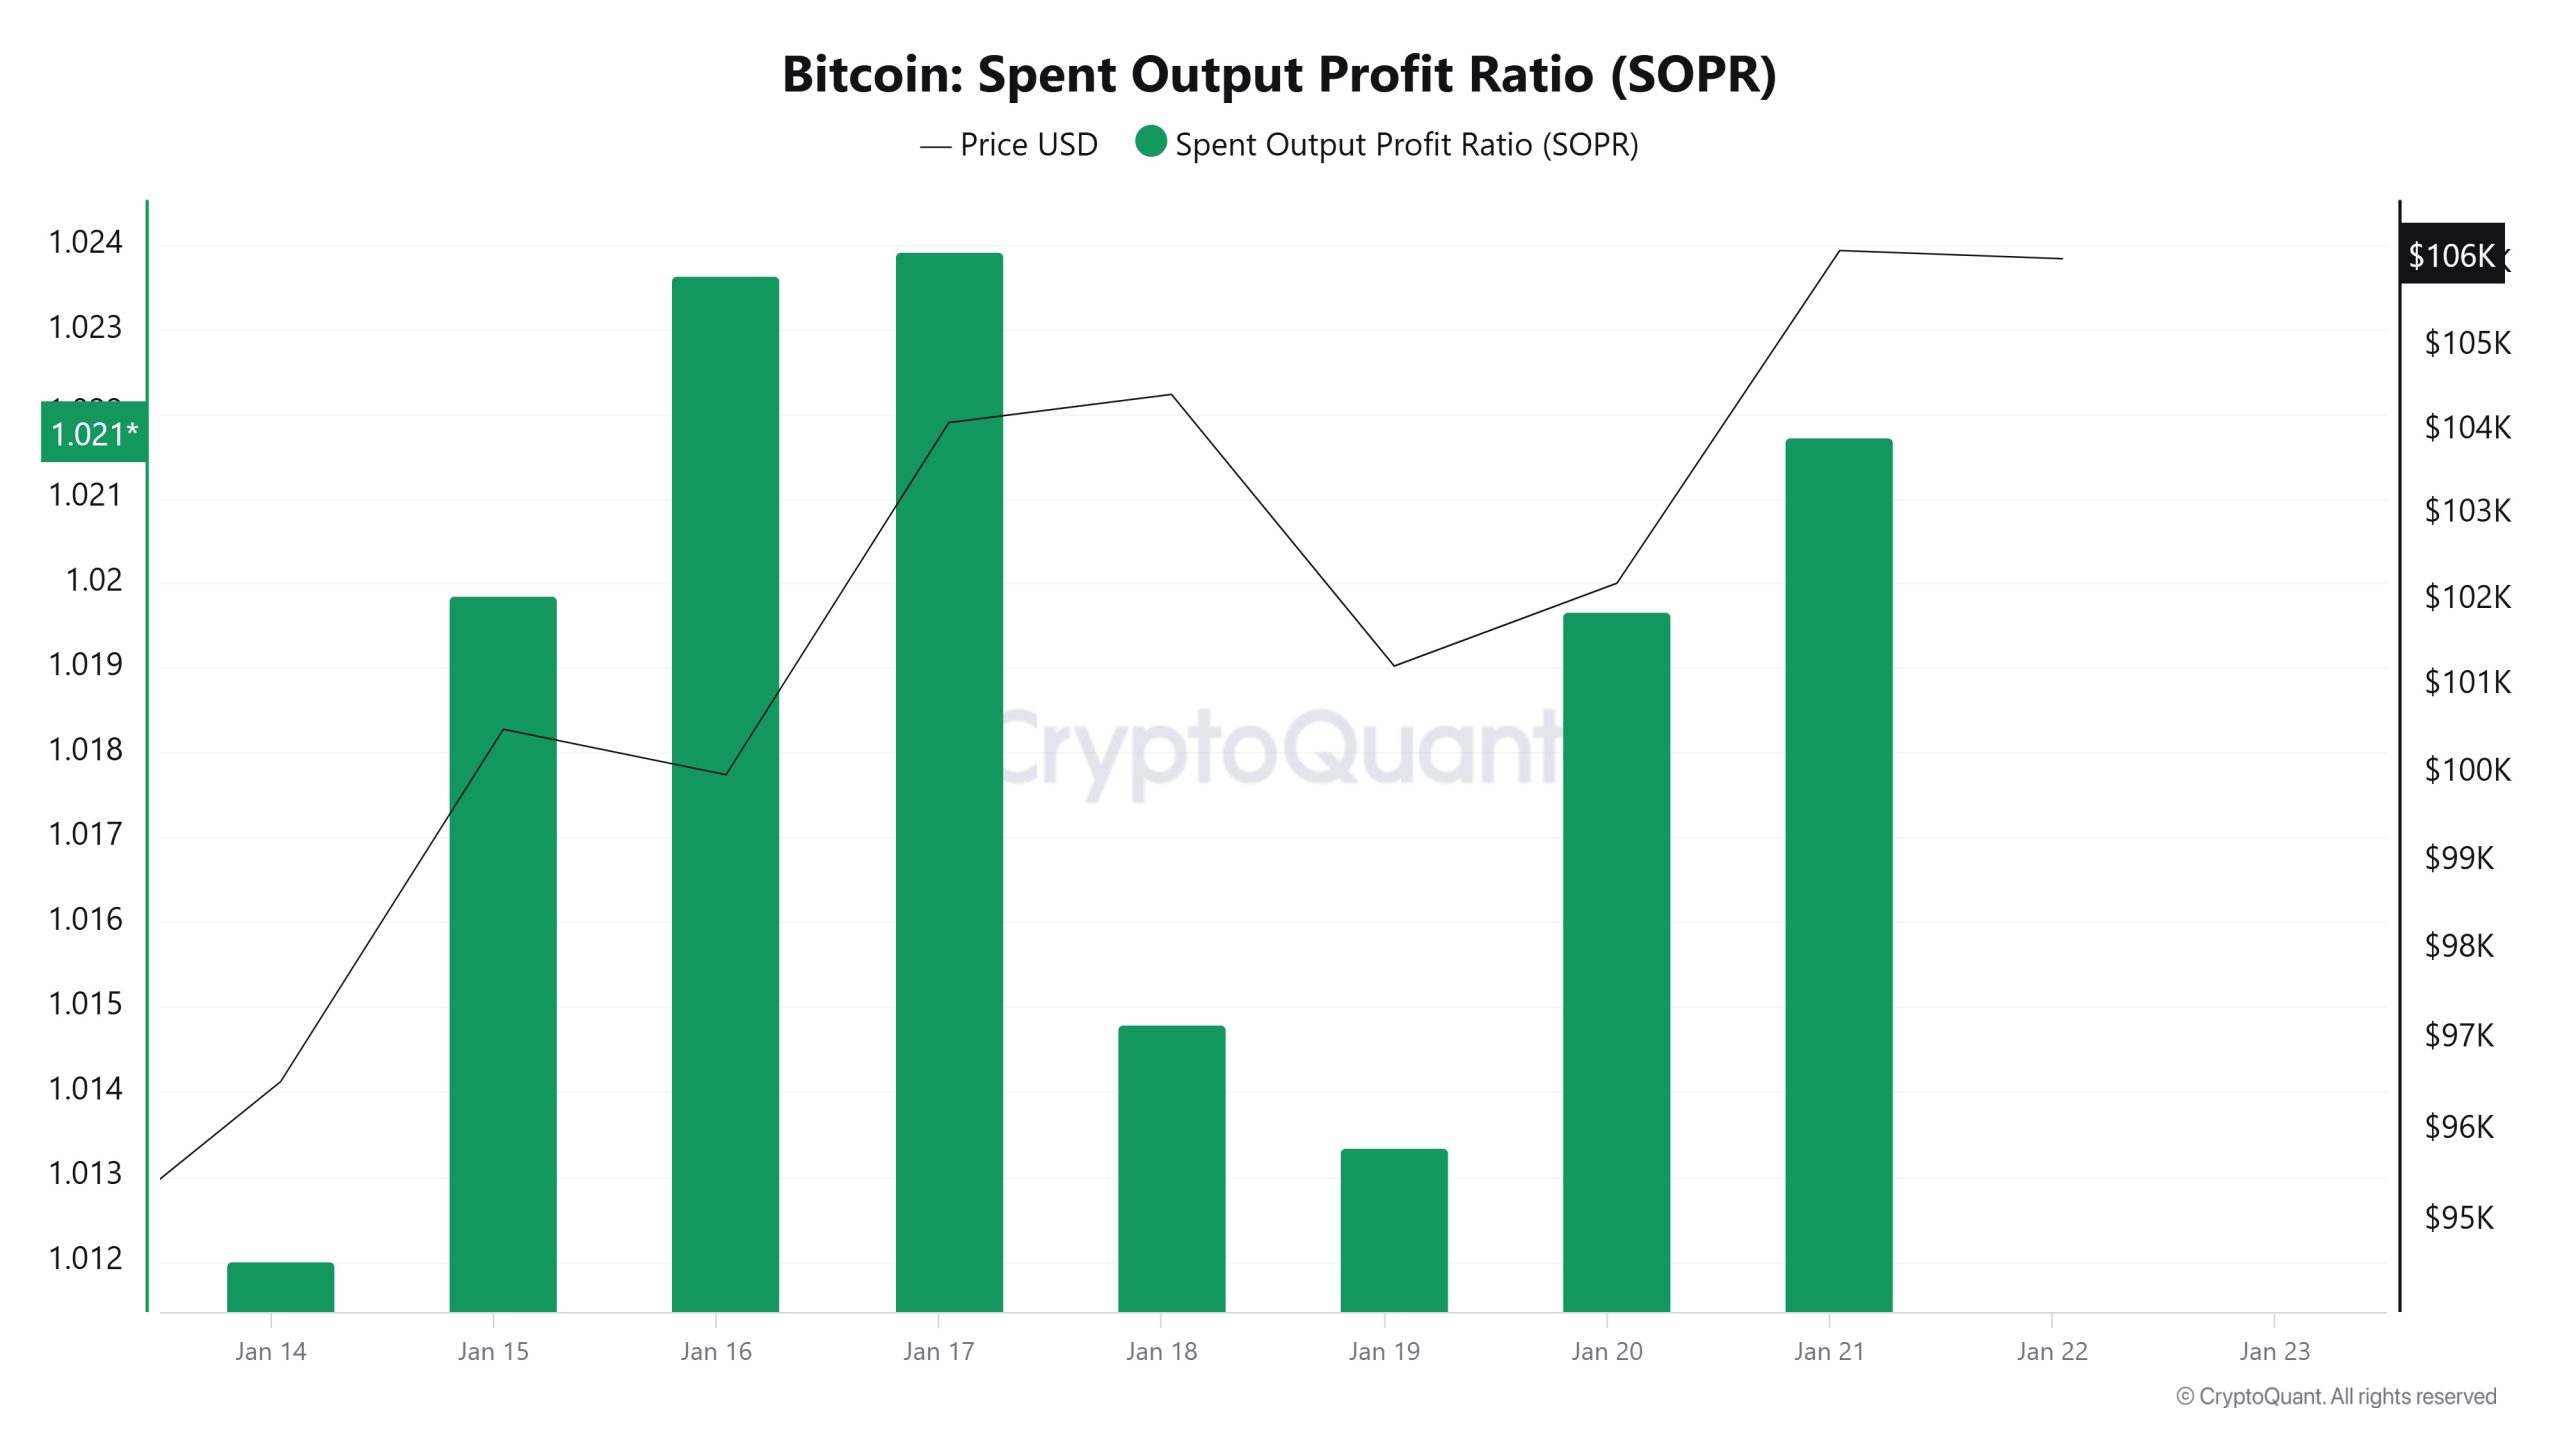
On Ocak 15, the Bitcoin price was at 100,503 while the SOPR metric was 1.01. As of Ocak 21, the Bitcoin price was at 106,164 while the SOPR metric was at 1.02. Compared to last week, the Bitcoin price has increased by 5.63% and the SOPR metric has increased by about 1%.
Türevler
Açık Faiz
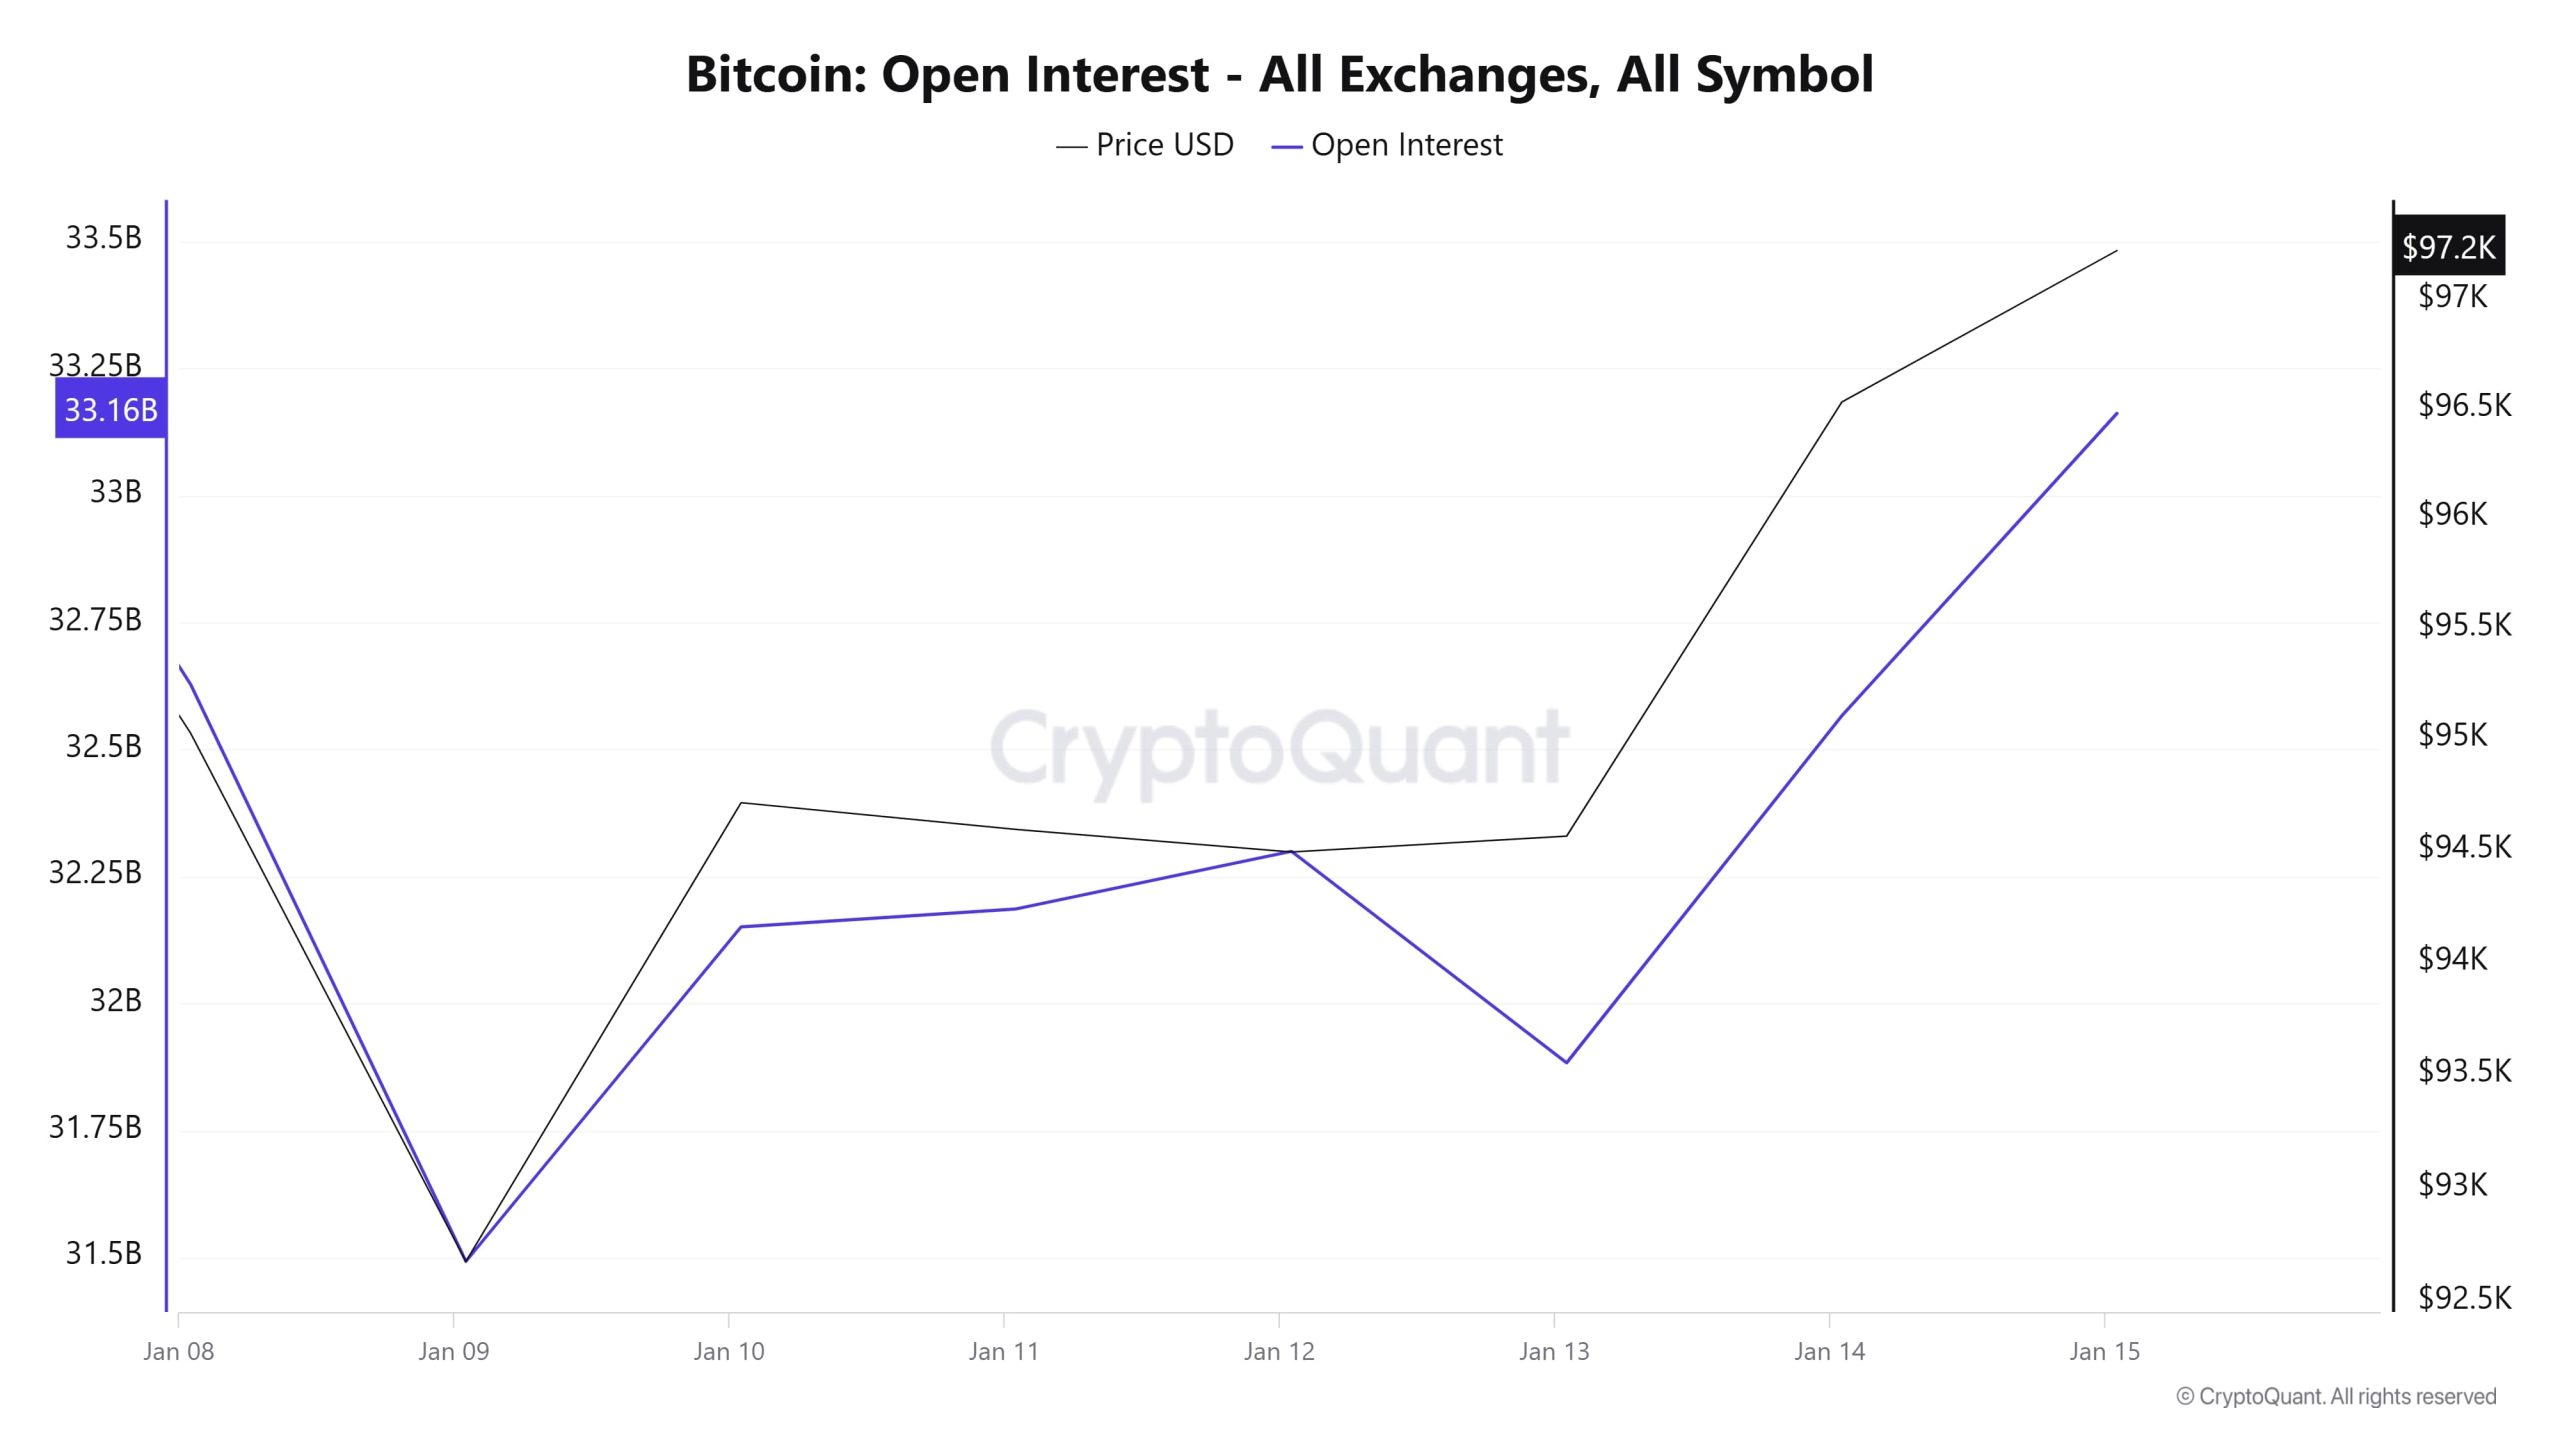
This week, Open Interest and price seem to be moving in line with the positive correlation. Open Interest has been on a steady uptrend, indicating increased investor interest in the futures market and more capital flowing into the market. The accompanying rise in the price indicates that the bullish sentiment is strong in the current market and that investors’ market expectations are shaped in a positive direction.
The sharp declines on Ocak 9th and Ocak 13th, which occurred simultaneously in both price and open interest, indicate that positions in the market were quickly closed. Such declines are usually seen during periods when investors engage in risk-reduction strategies due to short-term uncertainty. However, since Ocak 14th, there has been a strong increase in price and open interest again. This rise clearly shows that new positions have entered the market and the risk appetite of participants has increased again. Especially the parallel increase in price and open interest is an important indicator for the sustainability of the bullish momentum.
However, the rapid rise in open interest also suggests that the market has become over-leveraged, a risk that could lead to large liquidations if price movements reverse. While rising open interest usually indicates the strengthening of a trend, if the price flattens or declines, it could be a sign of market tightness or the start of profit realizations. Such a scenario could lead to large volatility, especially when leverage is high.
Fonlama Oranı
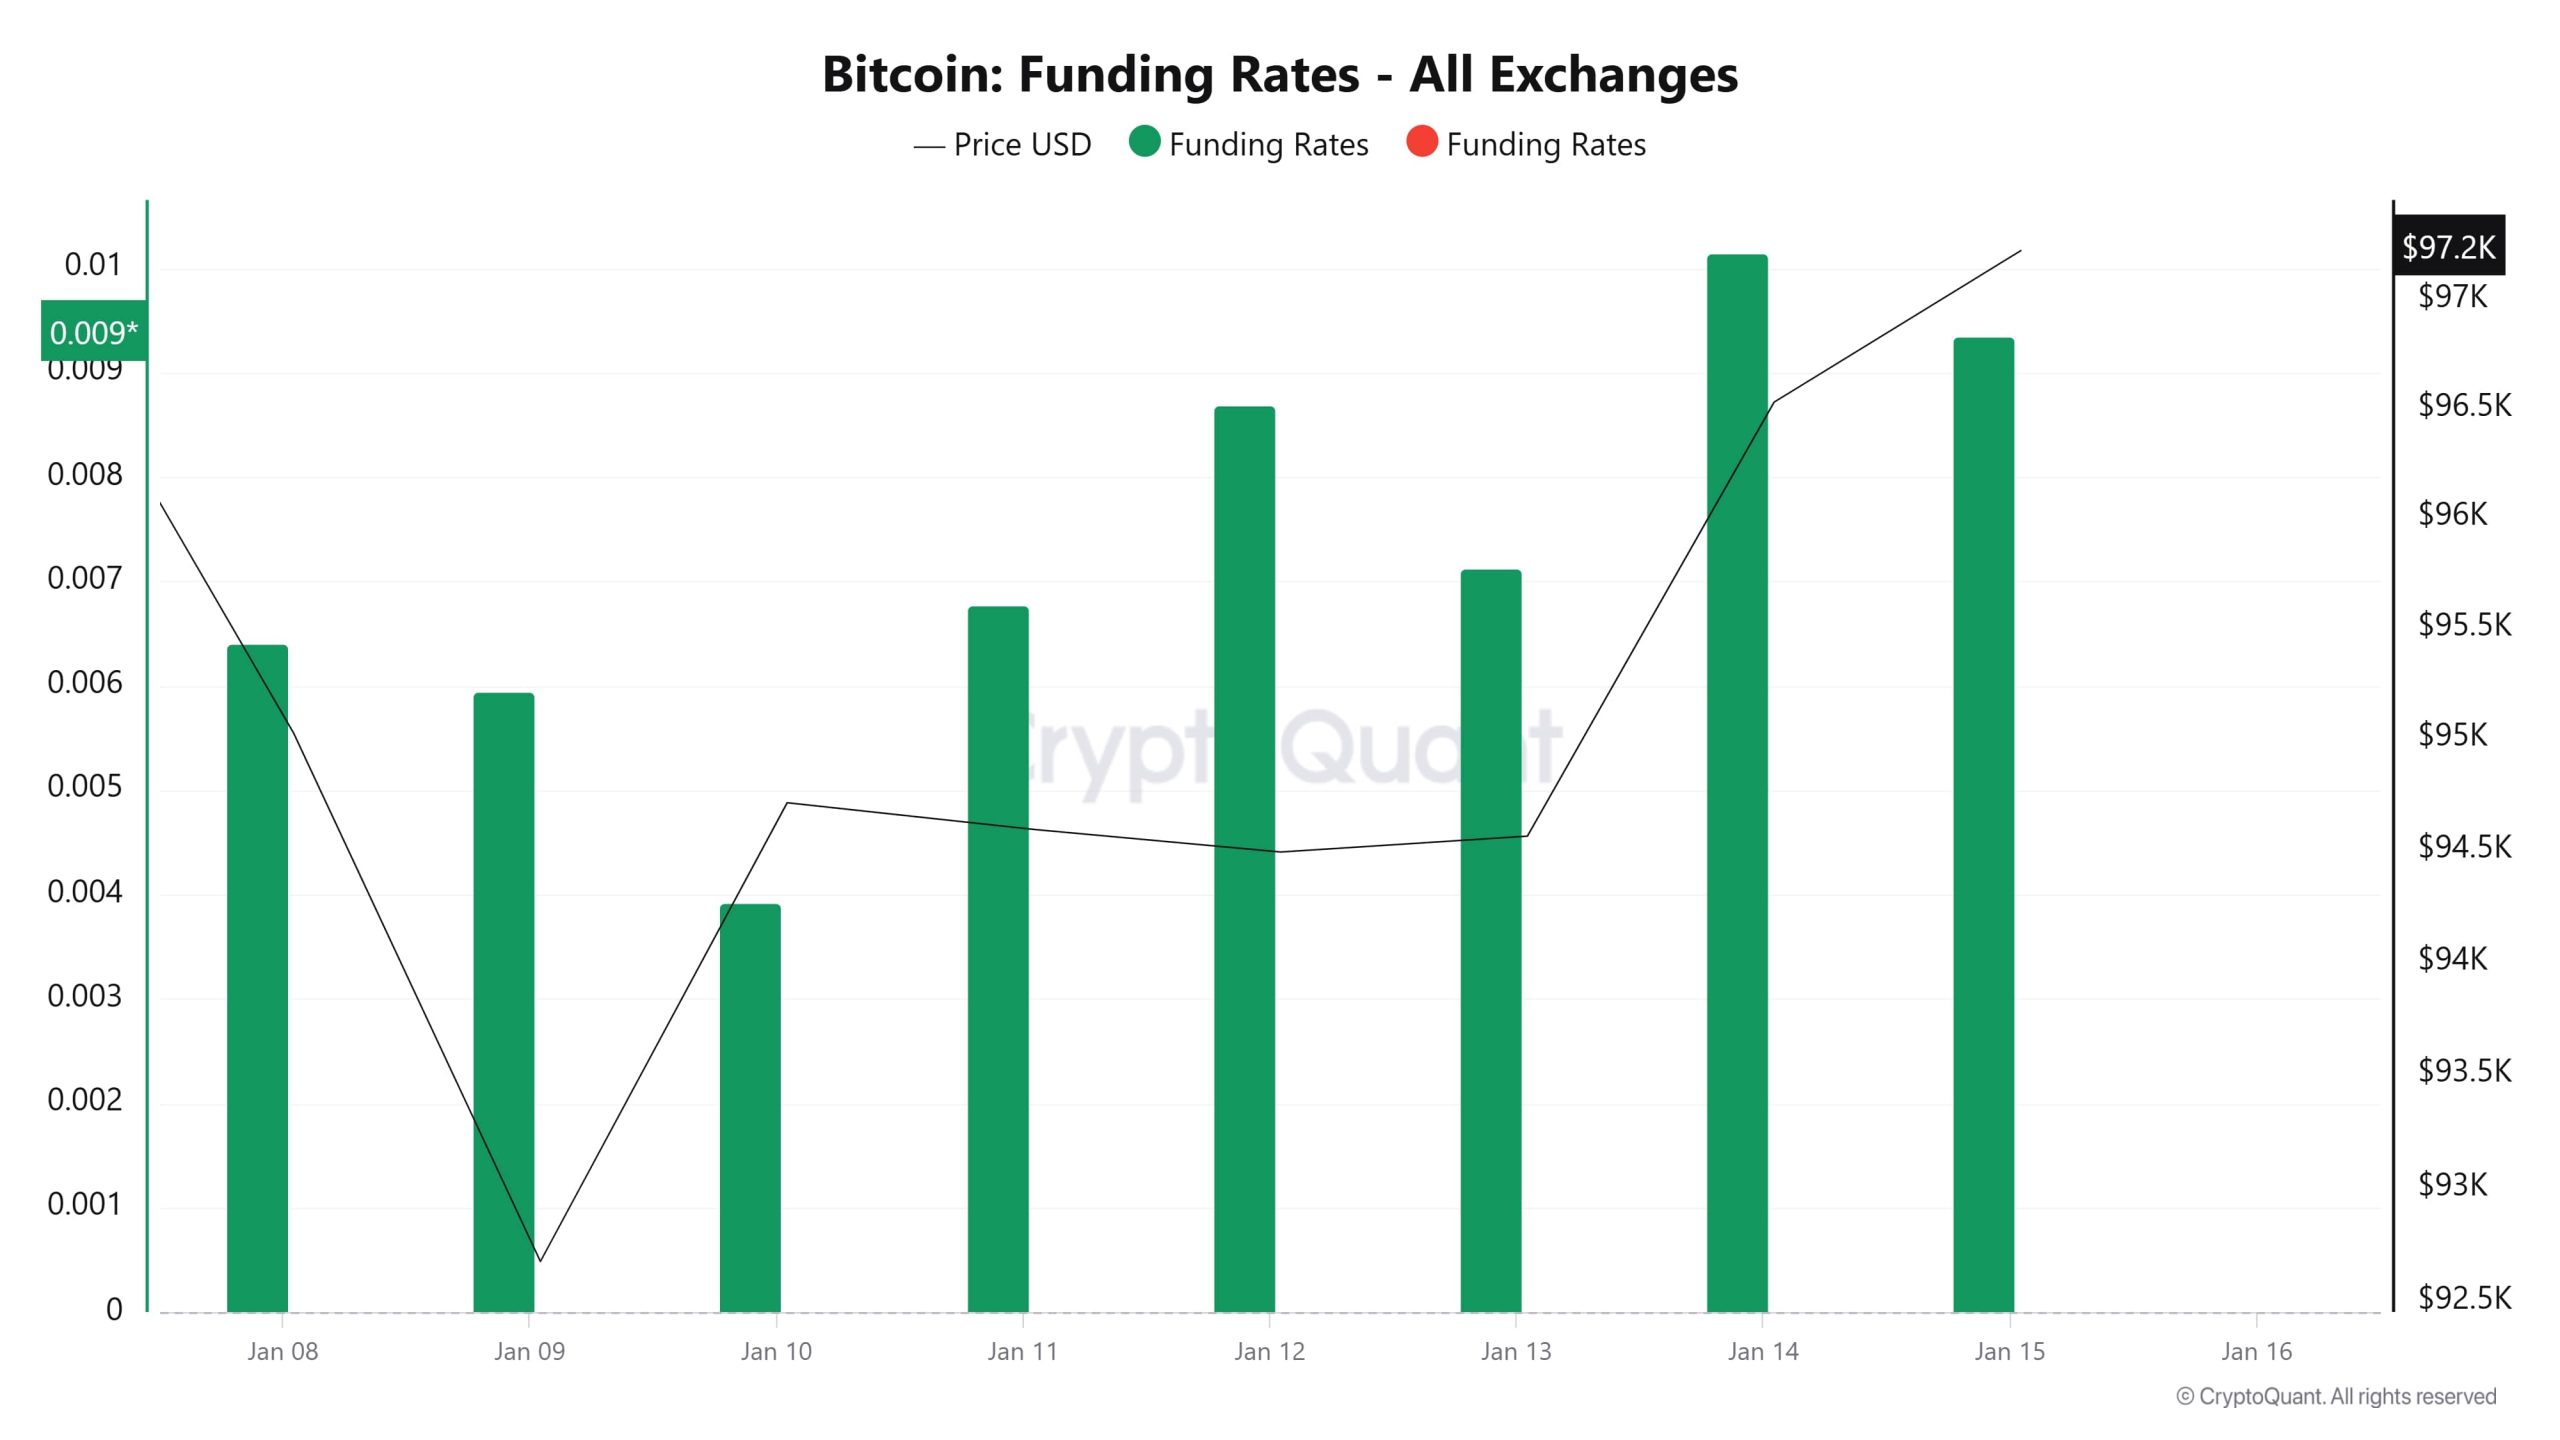
Bitcoin funding rates continue to be positive, and the price is on an uptrend. Positive funding rates indicate that the market is largely made up of long positions and investors have strong bullish expectations. The decline around Ocak 9 suggests that there was a pullback in both the funding rates and the price, suggesting that investors closed positions or short positions gained weight. However, the rise in the funding rate after Ocak 14th suggests that bullish expectations are again strengthening in the market. However, if the funding rate remains at high levels for a prolonged period of time, the market could become over-leveraged and risk a possible correction
Uzun ve Kısa Tasfiyeler
After a very active week similar to last week, Bitcoin continues to price above the $96,000 level again. With the deep declines on Ocak 8, 9 and 13, high amounts of liquidations in both long and short positions stand out. When the Liquidation heatmap is analyzed, the liquidation block formed up to 99,000 levels stands out. Although rises up to these levels seem possible, the lack of sufficient spot support and low volume data may indicate that Bitcoin is at a critical decision stage that requires caution.
| Tarih | Uzun Tutar (Milyon $) | Kısa Tutar (Milyon $) |
|---|---|---|
| 08 Ocak | 26.44 | 17.08 |
| Ocak 09 | 21.53 | 5.48 |
| Ocak 10 | 7.21 | 23.29 |
| Ocak 11 | 1.74 | 2.01 |
| Ocak 12 | 12.31 | 1.16 |
| Ocak 13 | 22.69 | 23.06 |
| Ocak 14 | 6.31 | 10.84 |
| Toplam | 98.23 | 82.92 |
Tedarik Dağıtımı
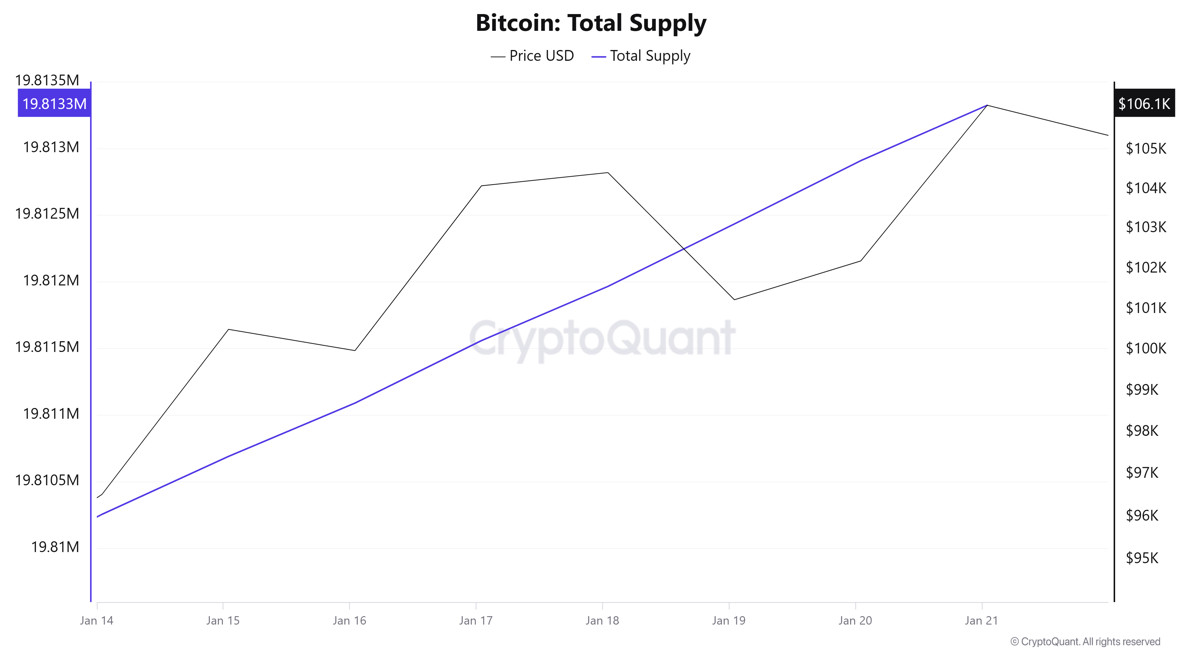
Total Supply: It reached 19,813,324 units, up about 0.0155% from last week.
New Supply: The amount of BTC produced this week was 3,069.
Velocity: Continued decline compared to the previous week.
| Cüzdan Kategorisi | 14.01.2025 | 21.01.2025 | Değişim (%) |
|---|---|---|---|
| < 0.1 BTC | 1.590% | 1.590% | - |
| 0.1 – 1 BTC | 5.417% | 5.409% | -0.148% |
| 1 – 100 BTC | 32.320% | 32.266% | -0.167% |
| 100 – 1k BTC | 22.569% | 22.646% | 0.341% |
| 1k – 100k BTC | 34.835% | 34.818% | -0.049% |
| > 100k BTC | 3.270% | 3.270% | - |
When we look at the supply distribution, the highest change was seen in the “100 – 1k BTC” category with an increase of 0.341%. In addition, there were decreases of 0.148% and 0.167% in the “0.1 – 1 BTC” and “1 – 100 BTC” categories, respectively. A small decrease of 0.049% was recorded in the “1k – 100k BTC” category, while there was no change in the “< 0.1 BTC” and “> 100k BTC” categories.
Döviz Rezervi
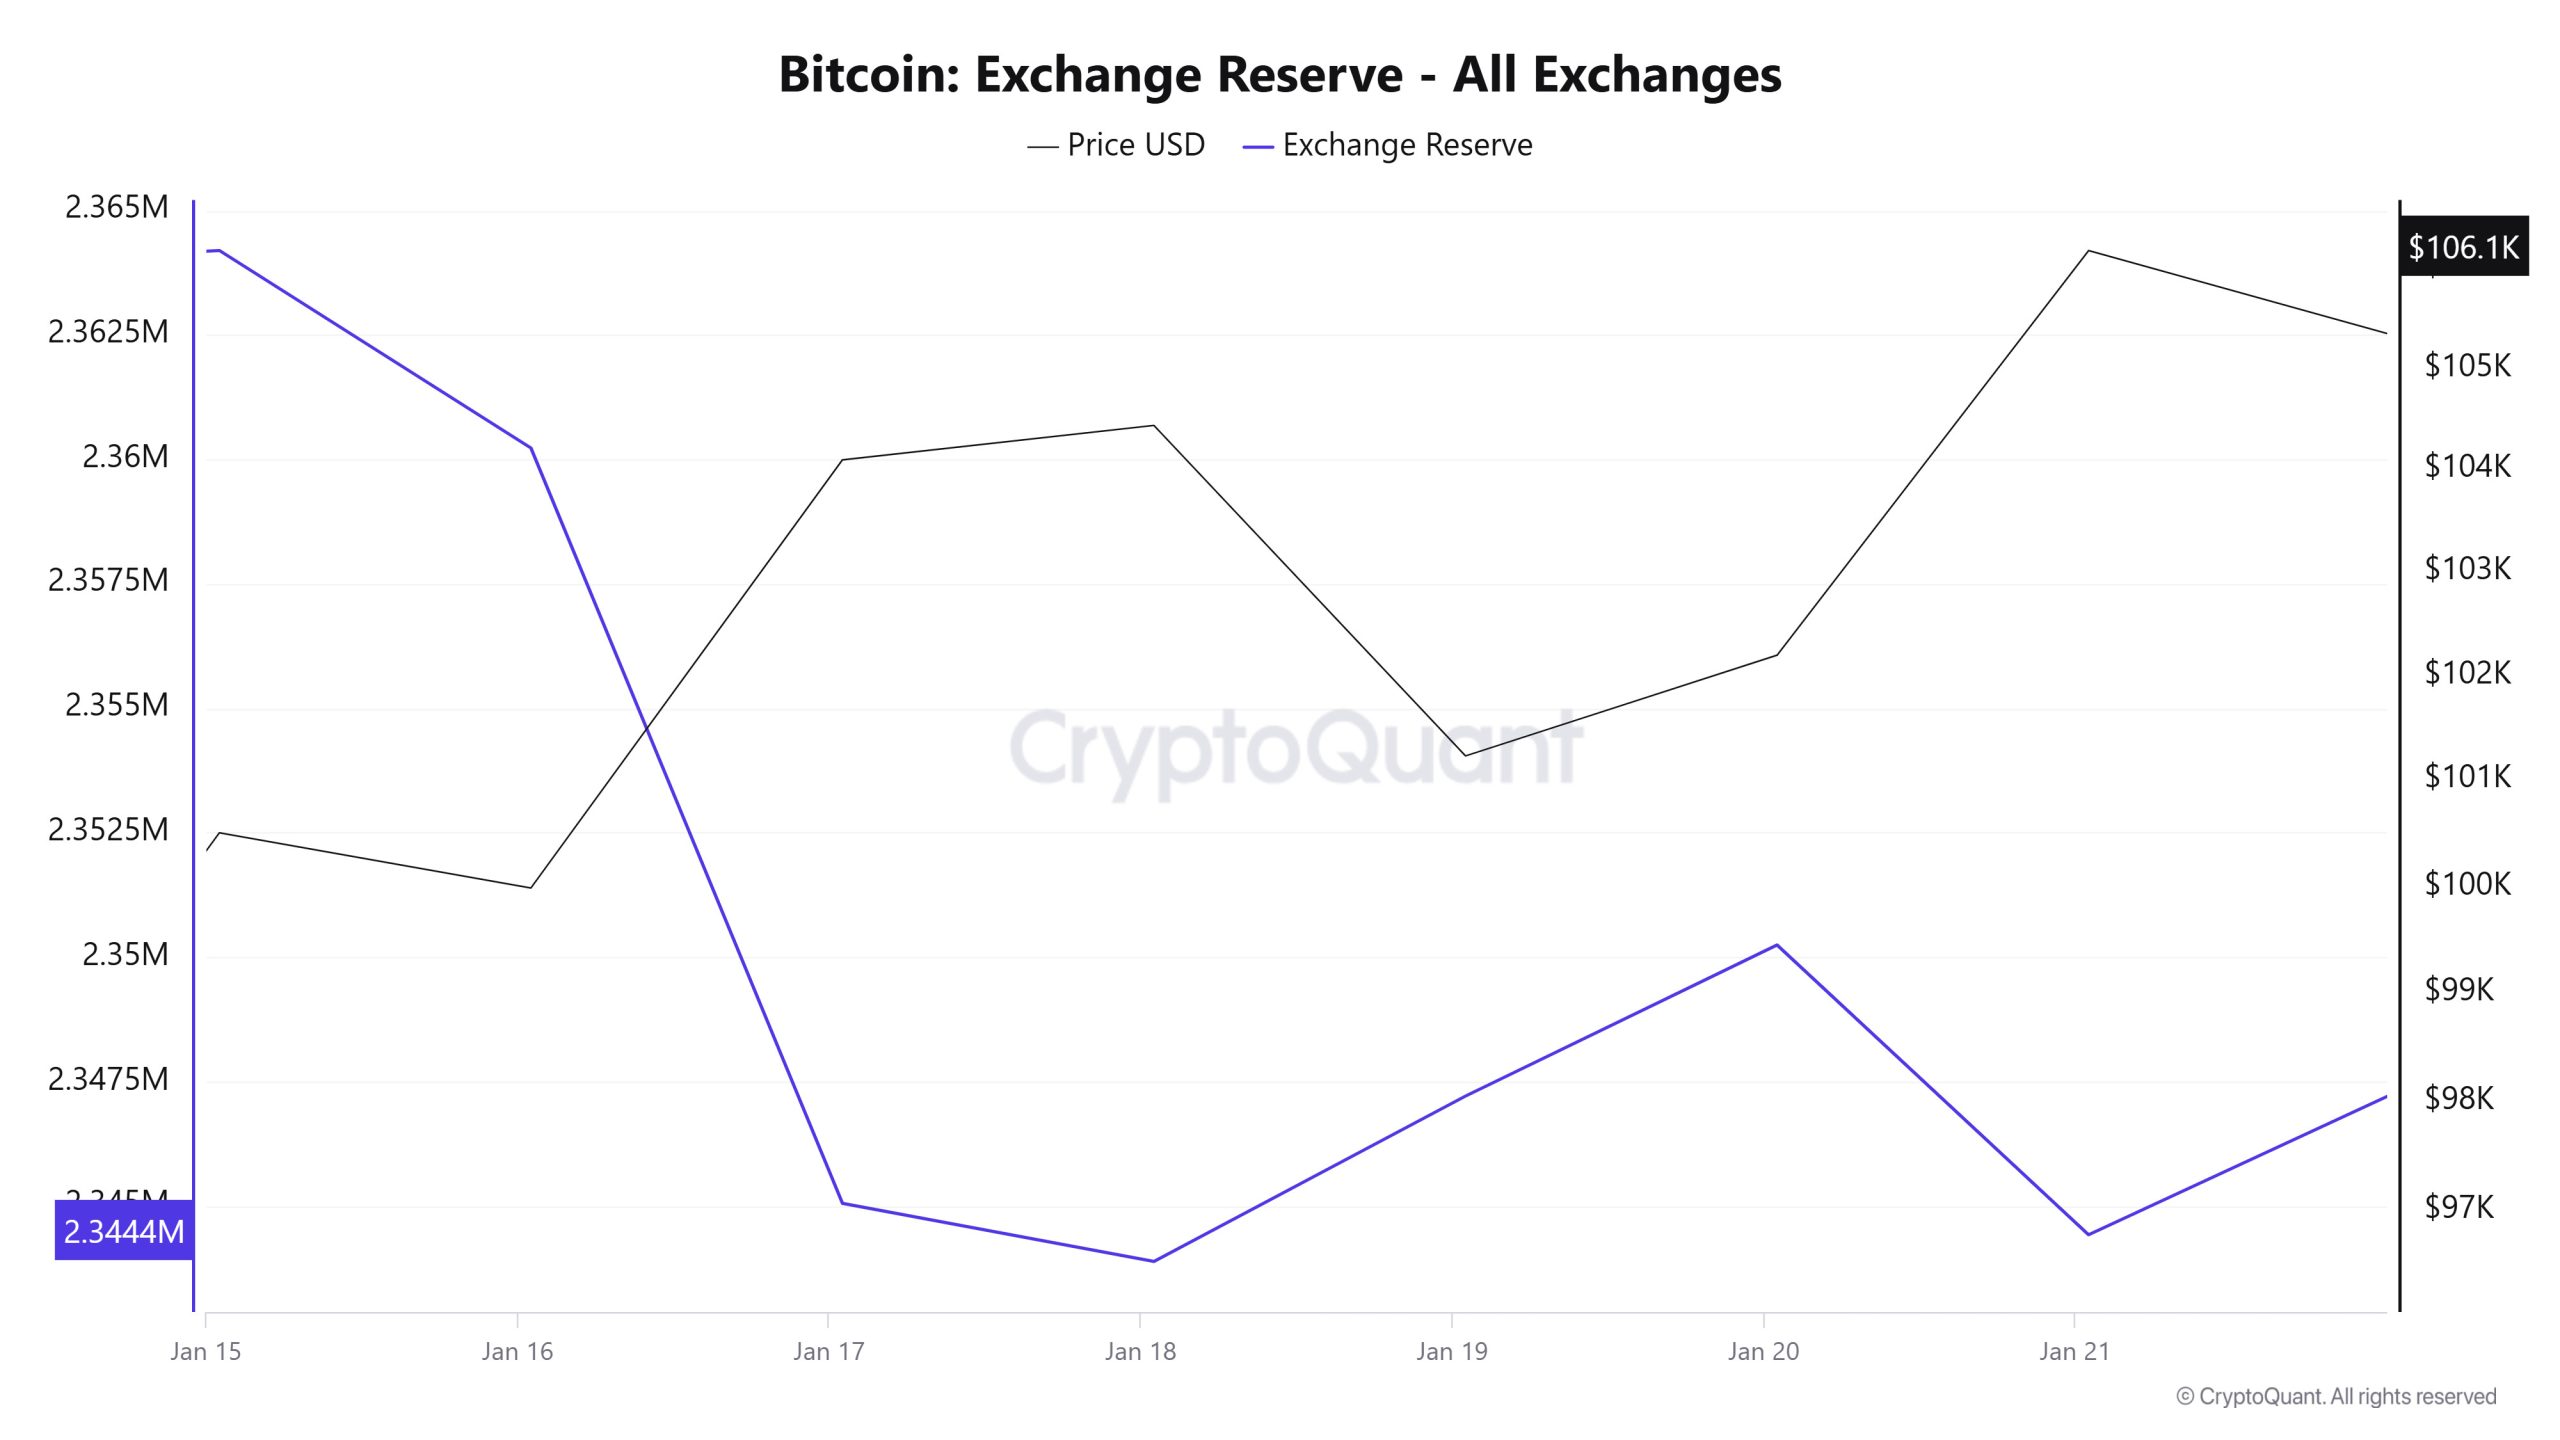 Between Ocak 15-21, 2025, Bitcoin reserves on exchanges decreased from 2,363,886 BTC to 2,344,417 BTC. In total, there was a net outflow of 19,469 BTC during this period and exchanges’ Bitcoin reserves decreased by 0.82%. The most notable movements during this period occurred on Ocak 17, 2025. On this date, exchanges recorded a net outflow of 15,178 BTC and a significant drop in reserves. However, on Ocak 19 and Ocak 20, net inflows of 3,323 BTC and 3,036 BTC, respectively, were noteworthy. The price of Bitcoin increased by approximately 5.6% during this period. Bitcoin, which closed at $100,504 on Ocak 15, 2025, closed at $106,165 on Ocak 21, 2025.
| Tarih | 15-Jan | 16-Jan | 17-Jan | 18-Jan | 19-Jan | 20-Jan | 21-Jan |
|---|---|---|---|---|---|---|---|
| Exchange Inflow | 33,081 | 46,294 | 51,280 | 20,095 | 26,701 | 43,643 | 50,811 |
| Exchange Outflow | 32,772 | 50,262 | 66,457 | 21,263 | 23,378 | 40,608 | 56,634 |
| Exchange Netflow | 309 | -3,968 | -15,178 | -1,168 | 3,323 | 3,036 | -5,823 |
| Döviz Rezervi | 2,364,194 | 2,360,227 | 2,345,049 | 2,343,881 | 2,347,204 | 2,350,240 | 2,344,417 |
| BTC Price* | 100,504 | 99,982 | 104,095 | 104,431 | 101,233 | 102,198 | 106,165 |
Ücretler ve Gelirler
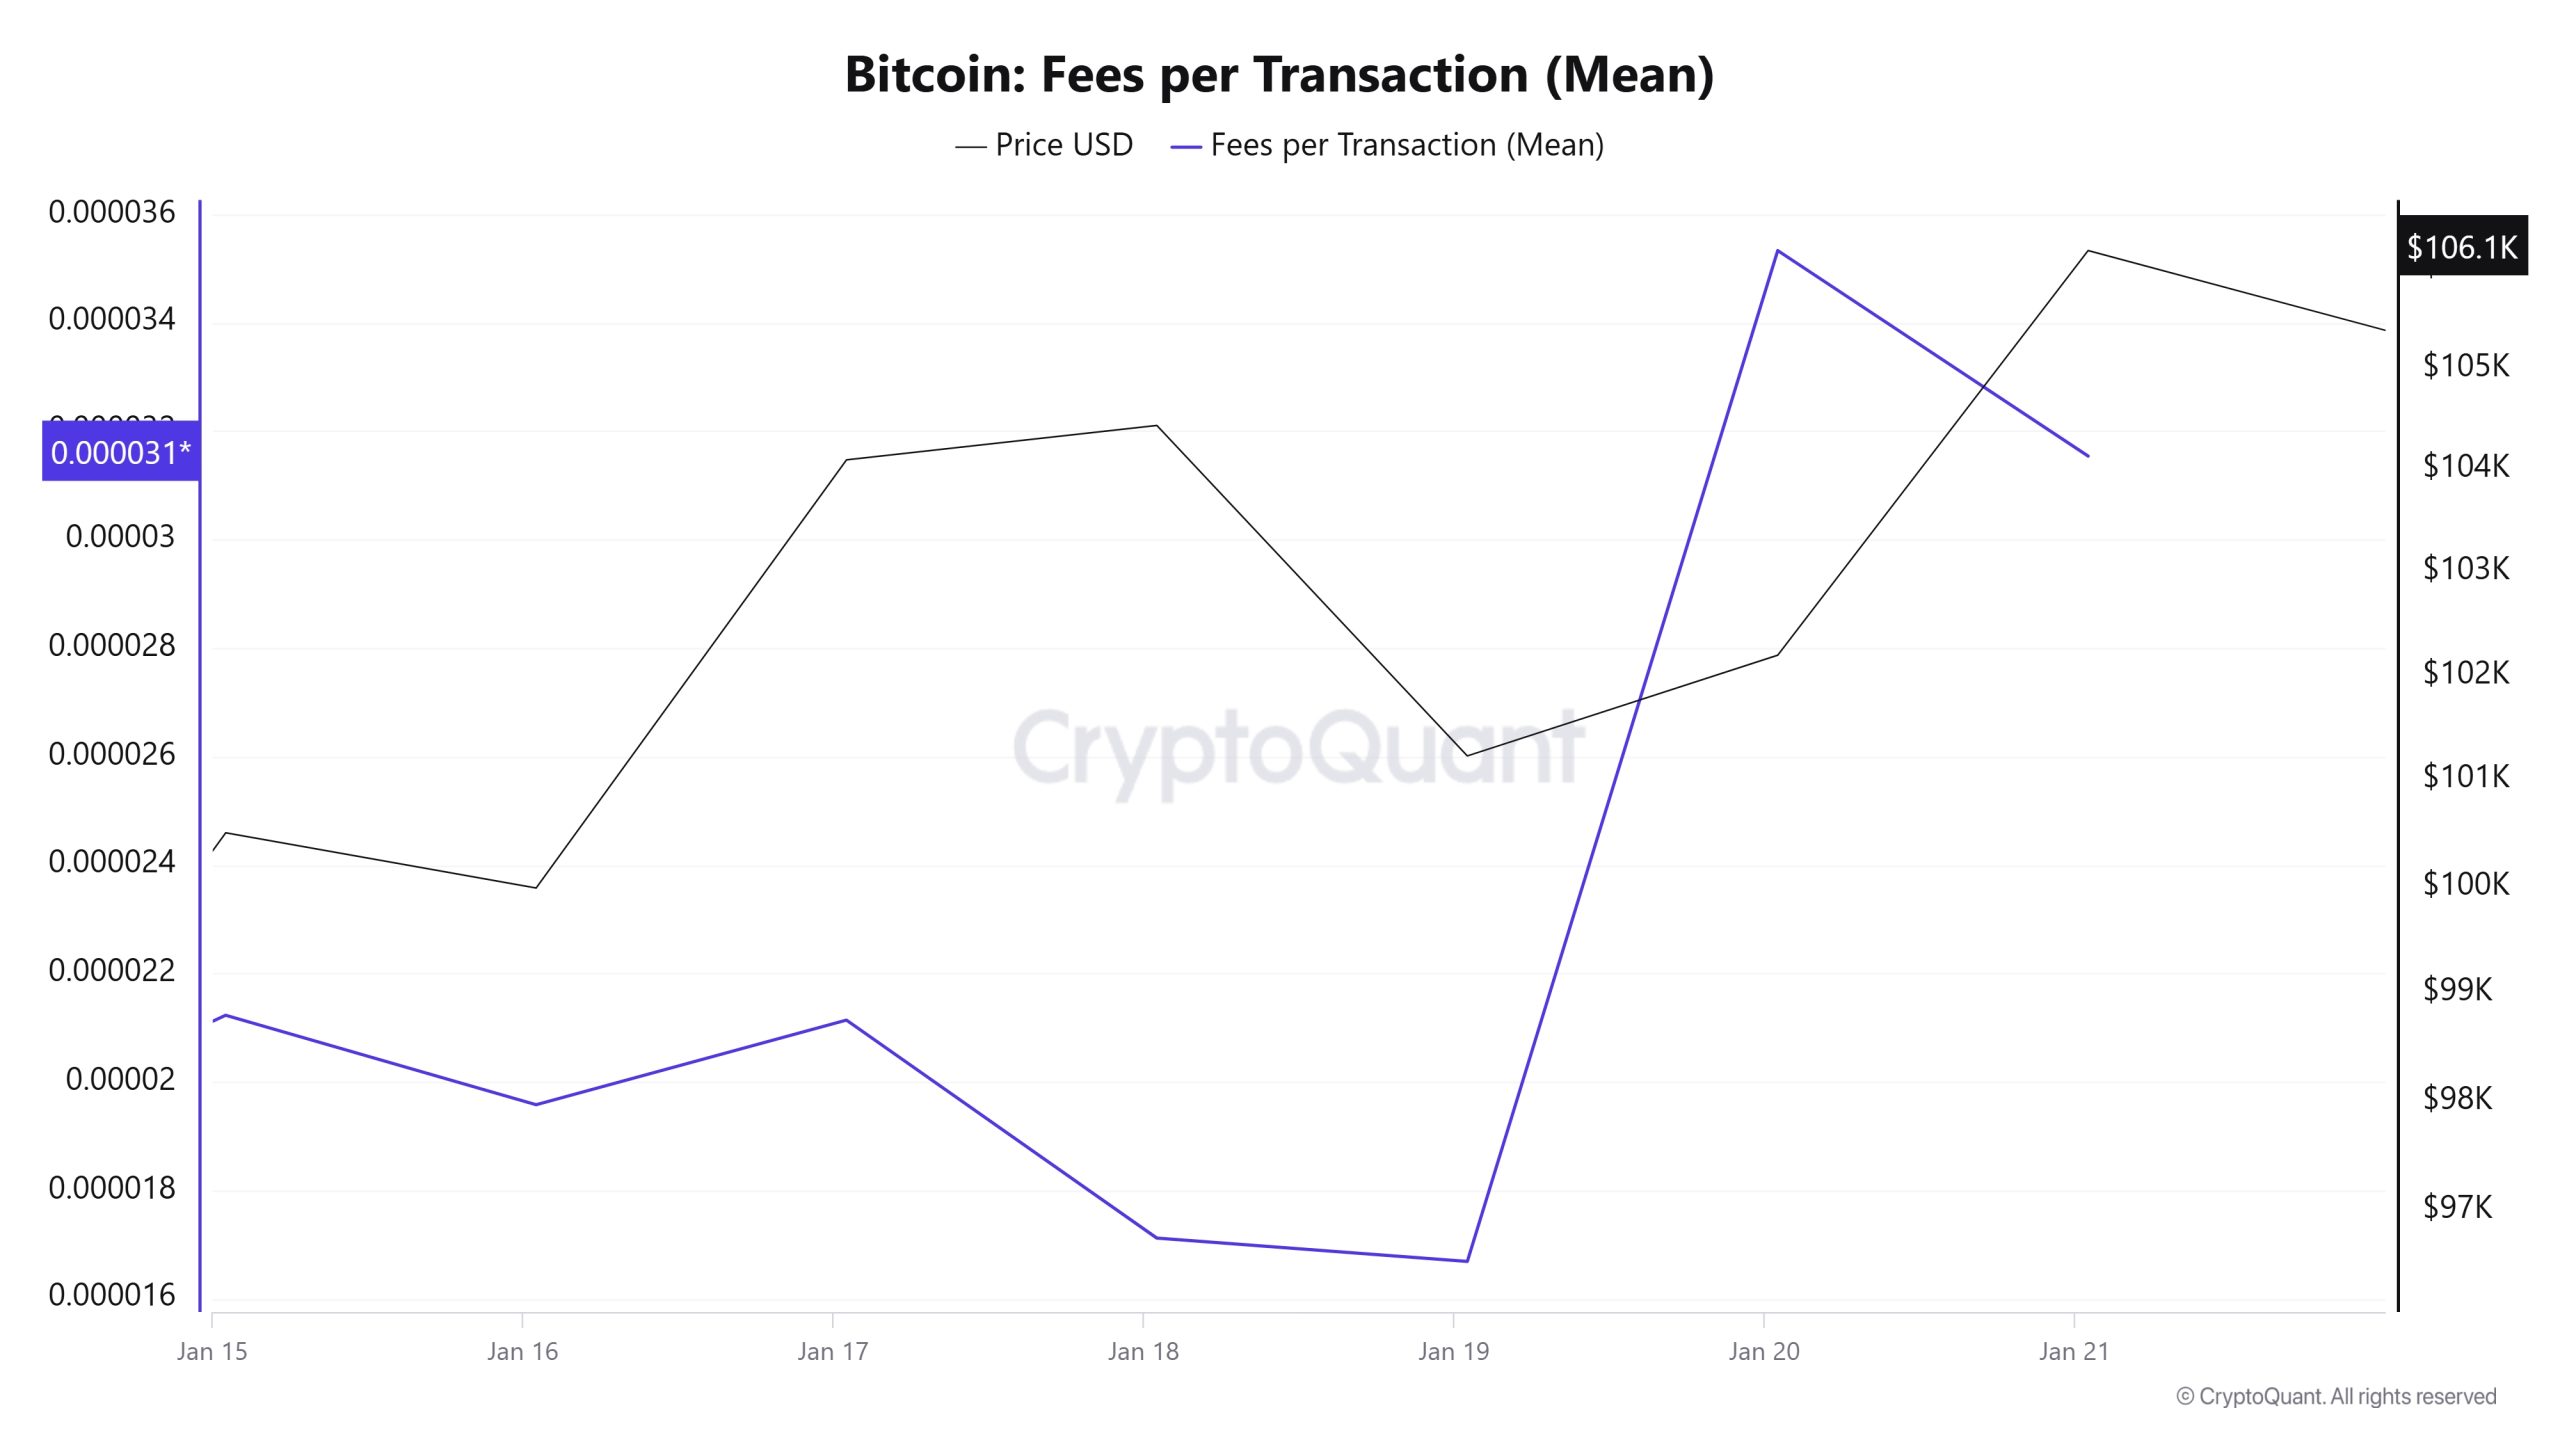 Analysing the Bitcoin Fees per Transaction (Mean) data between Ocak 15-21, it was observed that this value was at 0.00002123 on Ocak 15, the first day of the week. Until Ocak 19, Bitcoin Fees per Transaction (Mean), which followed a parallel course with Bitcoin price, reached its lowest level of the week at 0.00001669 on Ocak 19. Then, a volatile course was observed until the presidential oath of office speech of Donald Trump, who was re-elected as the President of the US on Ocak 20. In this context, it rose to 0.00003533 on Ocak 20, reaching the highest value of the week.
On Ocak 21, the last day of the weekly period, Fees per Transaction (Mean) value started to decline again and fell to 0.00003154 with the relatively calm course and decreasing volatility observed in Bitcoin price.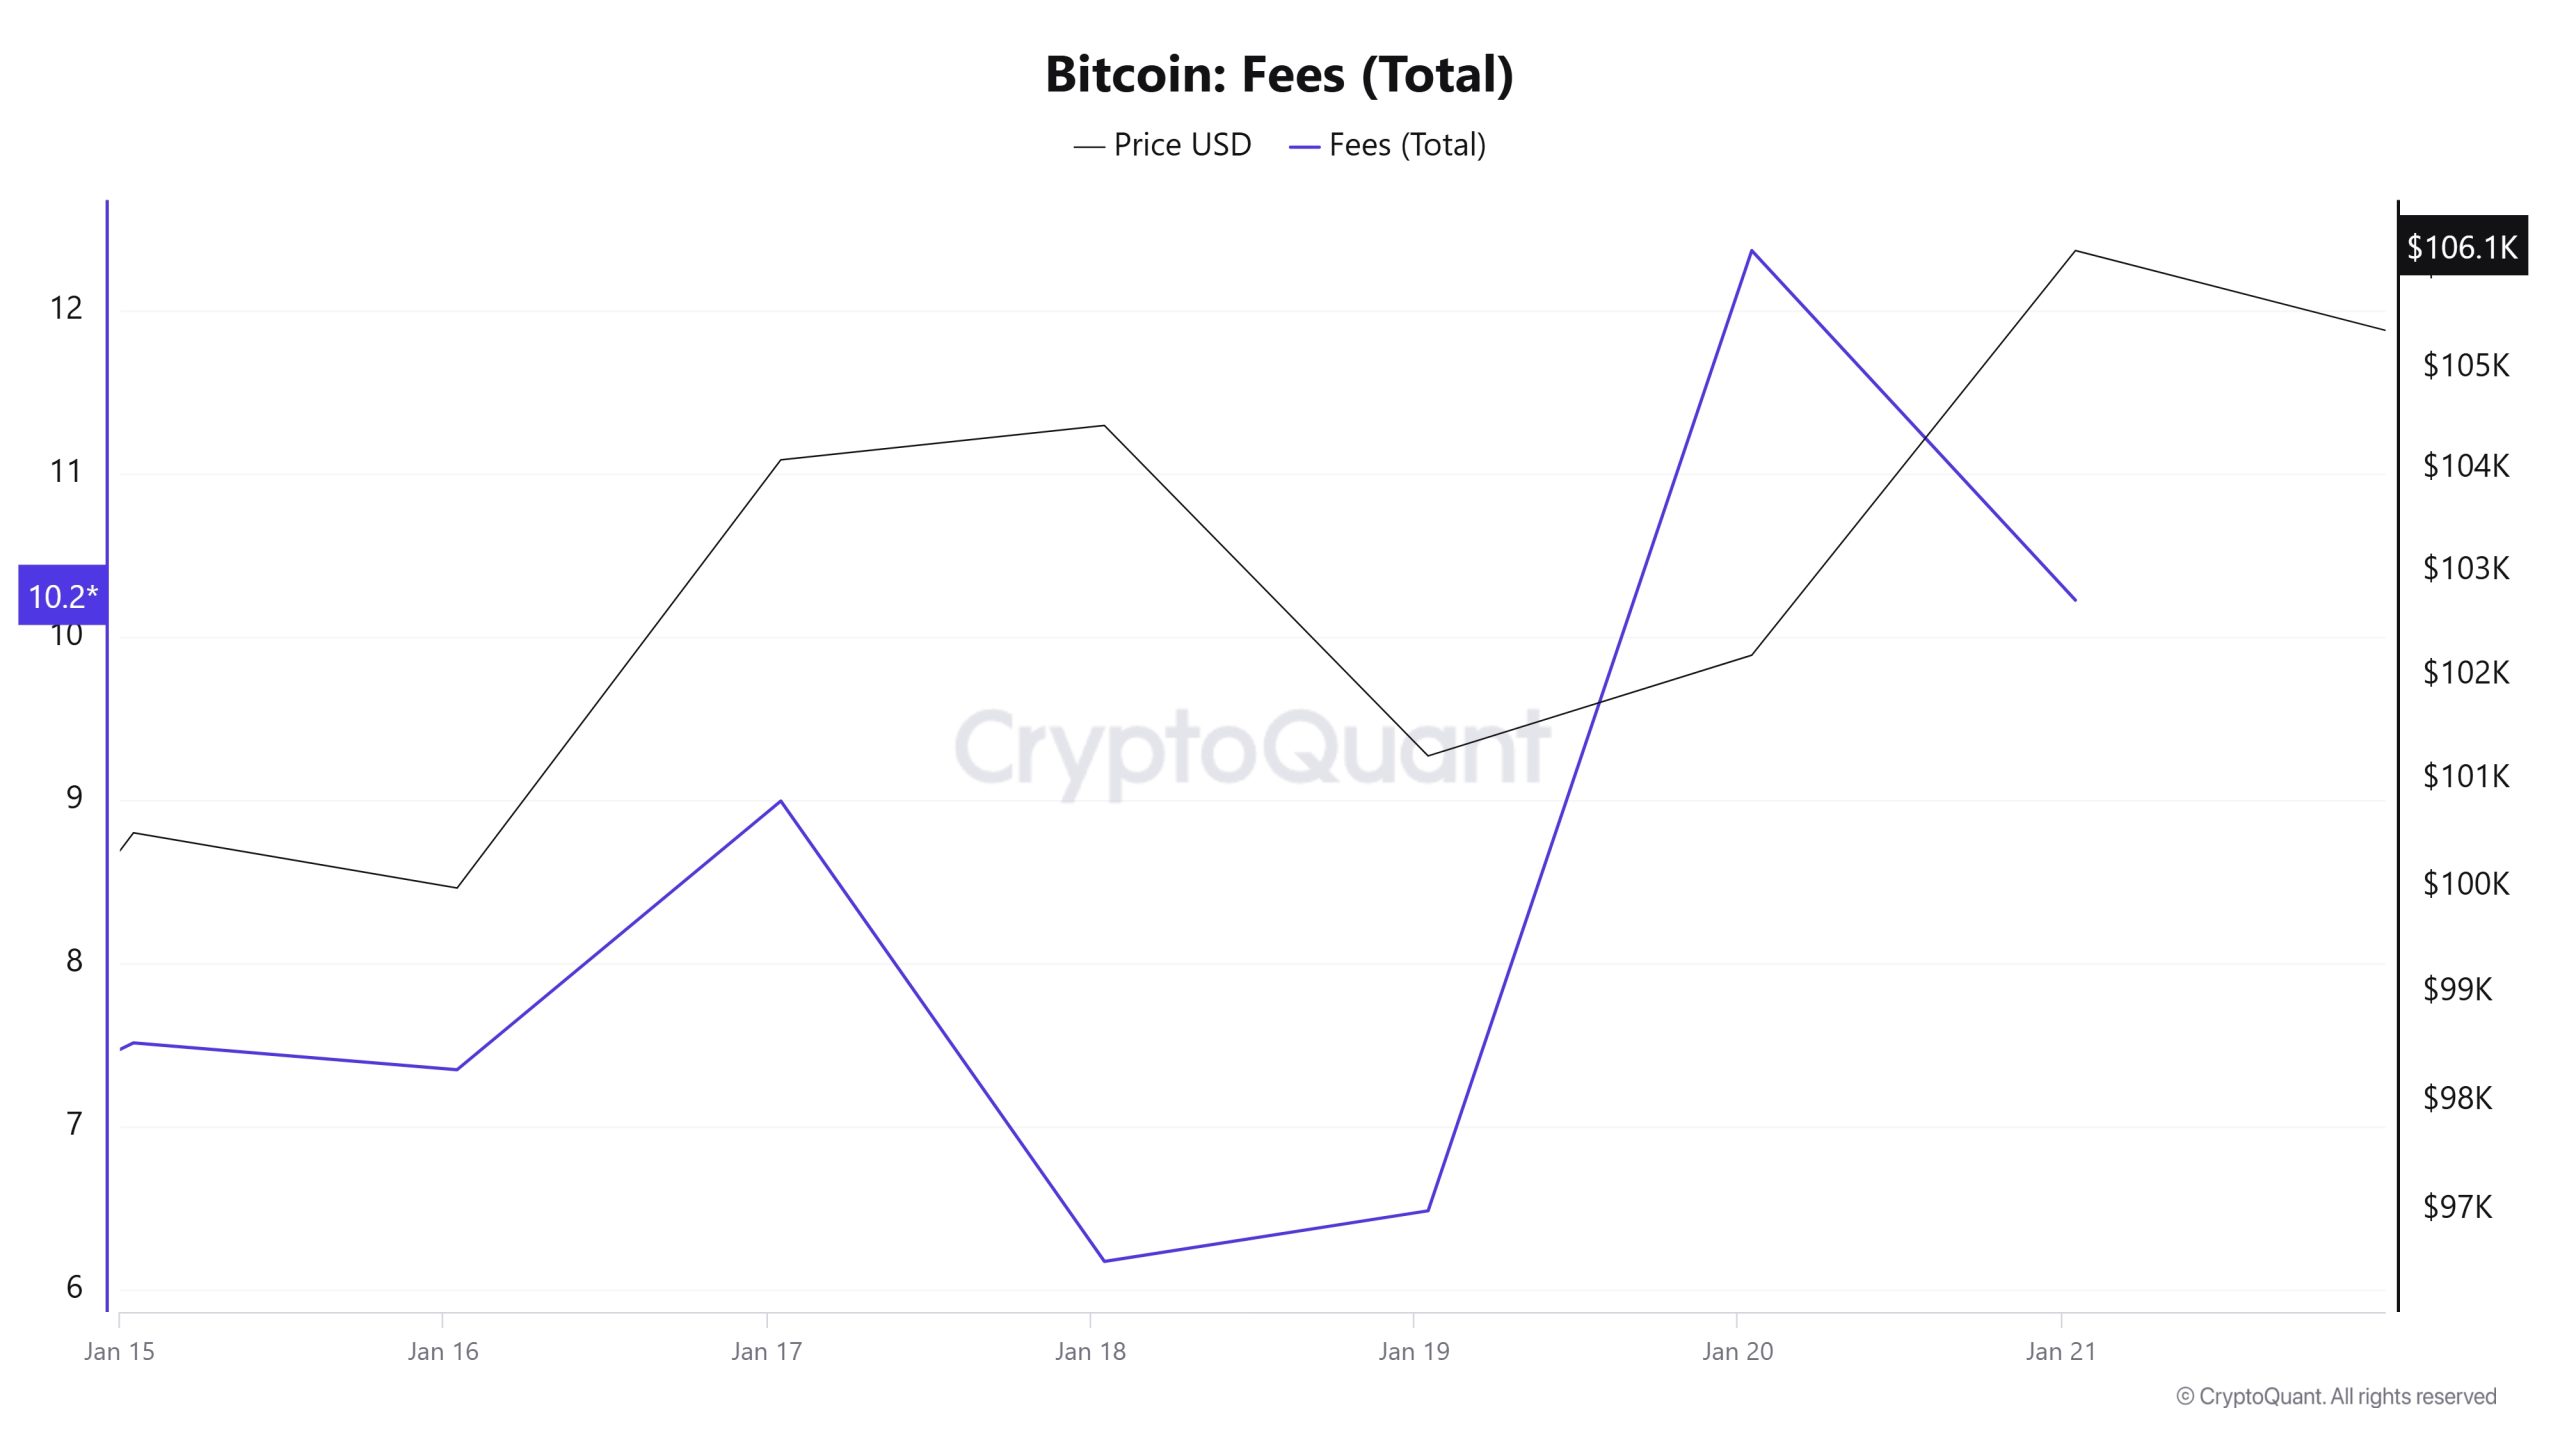 Similarly, when the Bitcoin Fees (Total) data between Ocak 15-21 are analyzed, it is observed that the Bitcoin Fees (Total) value, which was at 7.51249449 on Ocak 15, the first day of the week, showed a gradual decline until Ocak 18 and reached the lowest level of the week with a value of 6.1723701.
However, as of Ocak 19, the Bitcoin Fees (Total) value also started to rise with the increasing volatility in the Bitcoin price. In this context, on Ocak 20, the value reached 12,37123961 and was recorded as the highest value of the week.
Miner Flows
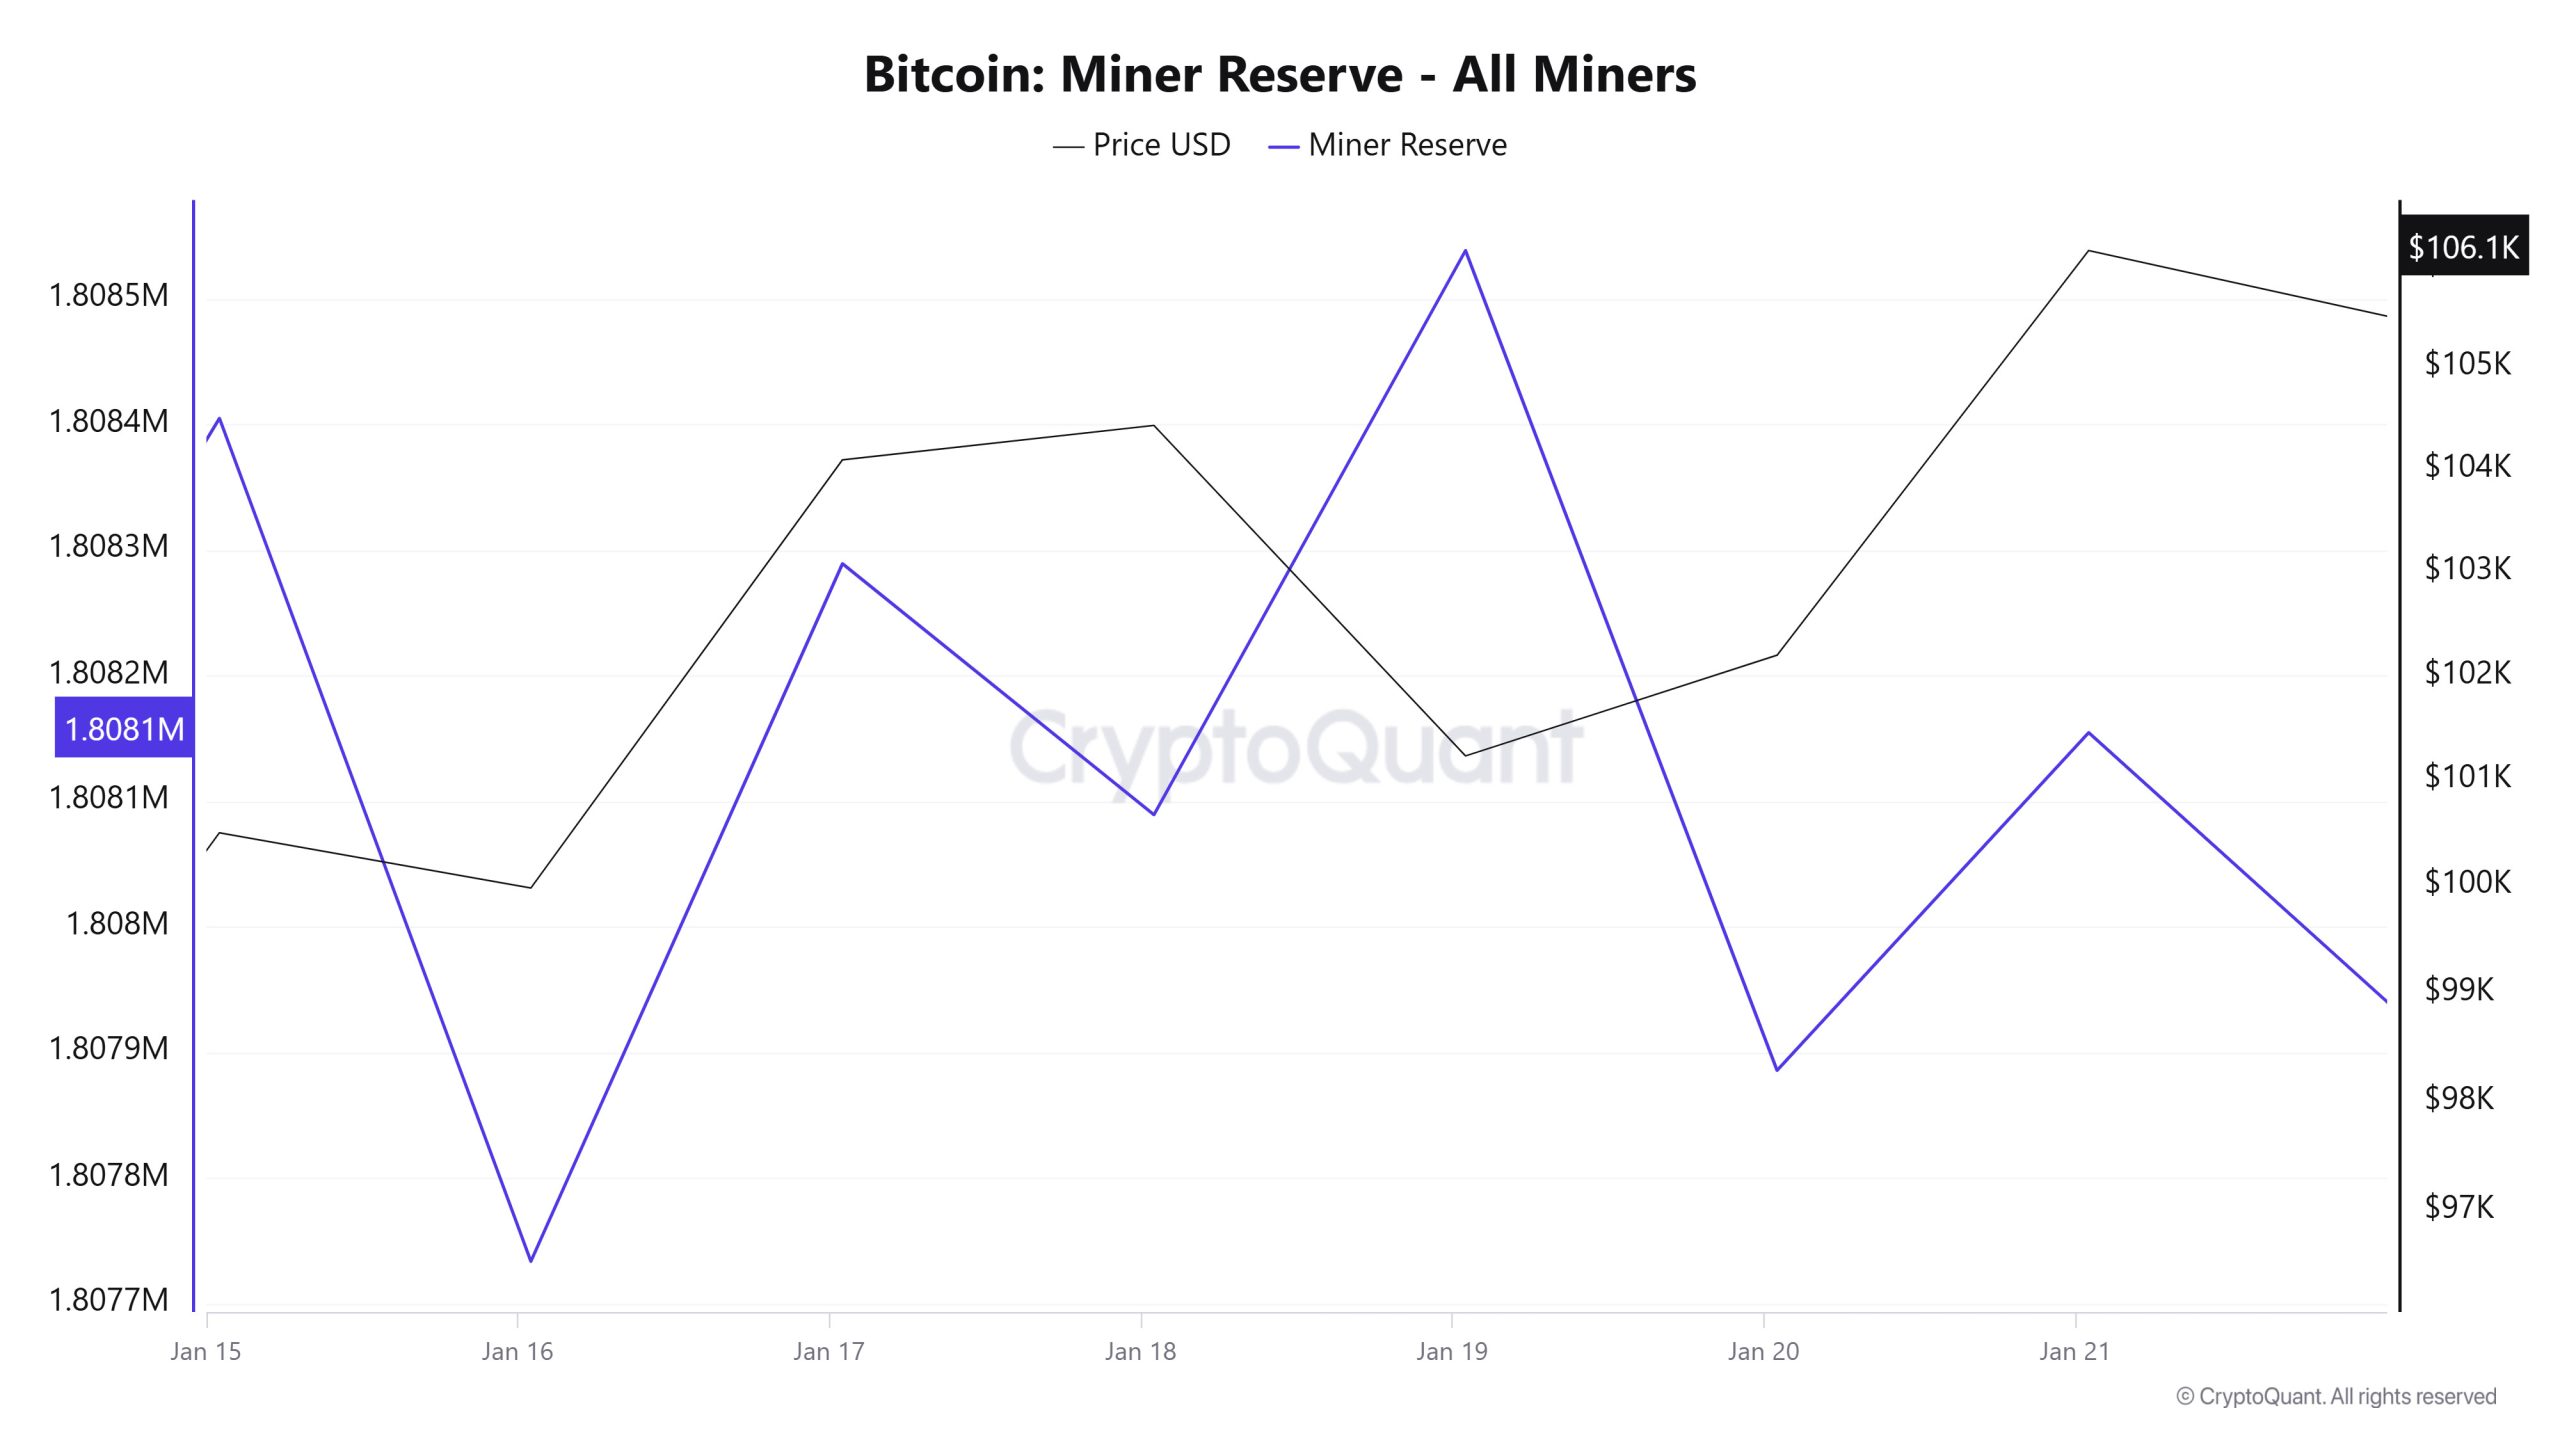
As can be seen in the Miner Reserve table, the number of Bitcoins in miners’ wallets decreased this week. Although the week started with a positive correlation between Miner Reserve and Bitcoin price, this correlation turned negative towards the end of the week.
Miner Inflow, Outflow and NetFlow
Between Ocak 15 and Ocak 21, 59,863 Bitcoins exited miners’ wallets, and 60,025 Bitcoins entered miners’ wallets between the same dates. The Miner NetFlow for this week was 162 Bitcoin. Meanwhile, while the Bitcoin price was $100,503 on Ocak 15, it was observed as $106,164 on Ocak 21.
During the week, the net flow (Miner NetFlow) was generally positive as Bitcoin inflow into miner wallets (Miner Inflow) was higher than Bitcoin outflow from miner wallets (Miner Outflow).
| Tarih | Ocak 15 | Ocak 16 | Ocak 17 | Ocak 18 | Ocak 19 | Ocak 20 | Ocak 21 |
|---|---|---|---|---|---|---|---|
| Miner Inflow | 6,702.90 | 6,677.28 | 9,374.66 | 6,364.79 | 9,187.06 | 11,957.79 | 9,760.73 |
| Miner Outflow | 6,290.94 | 7,348.77 | 8,818.98 | 6,564.68 | 8,737.76 | 12,610.73 | 9,491.72 |
| Miner NetFlow | 411.96 | -671.49 | 555.68 | -199.89 | 449.30 | -652.94 | 269.01 |
İşlem
 Transaction Count
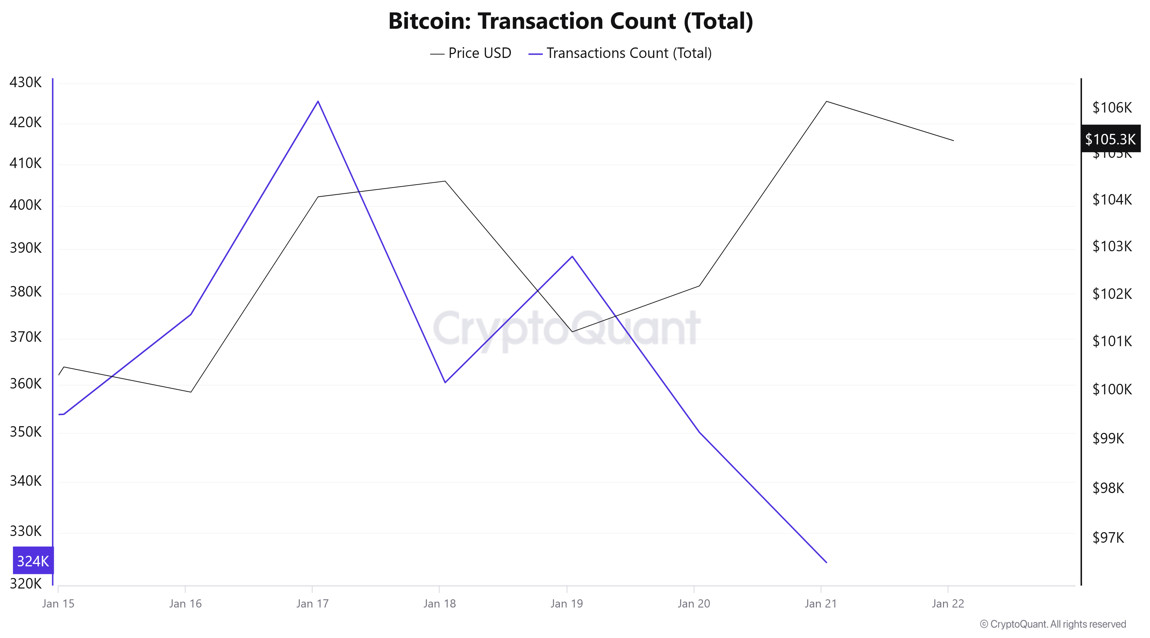
During the week of Ocak 8-14, a total of 3,196,381 transactions took place, while during the week of Ocak 15-21, the number of transactions decreased to 2,578,010, a decrease of approximately 19.35% compared to the previous week. Remarkably, the lowest volume of transactions on the network occurred on Pazartesi and Salı, Ocak 20-21. This marks a departure from the trading declines that are normally characteristic of weekends. The highest number of transactions for the week was 425,511 on Ocak 17. While there was a positive correlation between the number of trades and the price until that date, the relationship reversed for the rest of the week, with an inverse correlation between the price and the number of trades.
Tokens Transferred
In the week of Ocak 8-14, the amount of Bitcoin transferred was 4,760,329, while in the week of Ocak 15-21, this amount increased by 26.16% to 6,005,751. The lowest levels in the amount of Bitcoin transferred were generally observed on Cumartesi and Pazar, as in previous periods. On Ocak 16, 18 and 21, there was an inverse relationship between the amount of Bitcoin transferred and the price, while on Ocak 15, 17, 19 and 20, the relationship was directly proportional.
Whale Activities
 Cryptocurrency analytics firm Alphractal found that whales – large-scale traders – play an important role in shaping price trends, while individual traders provide liquidity but often lag behind the decision-making process. According to Alphractal, whales on exchanges are increasingly favoring short positions and closing long positions. In contrast, individual traders, defined as those with positions ranging from $1,000 to $10,000, have been steadily increasing their long positions.
Whales Data
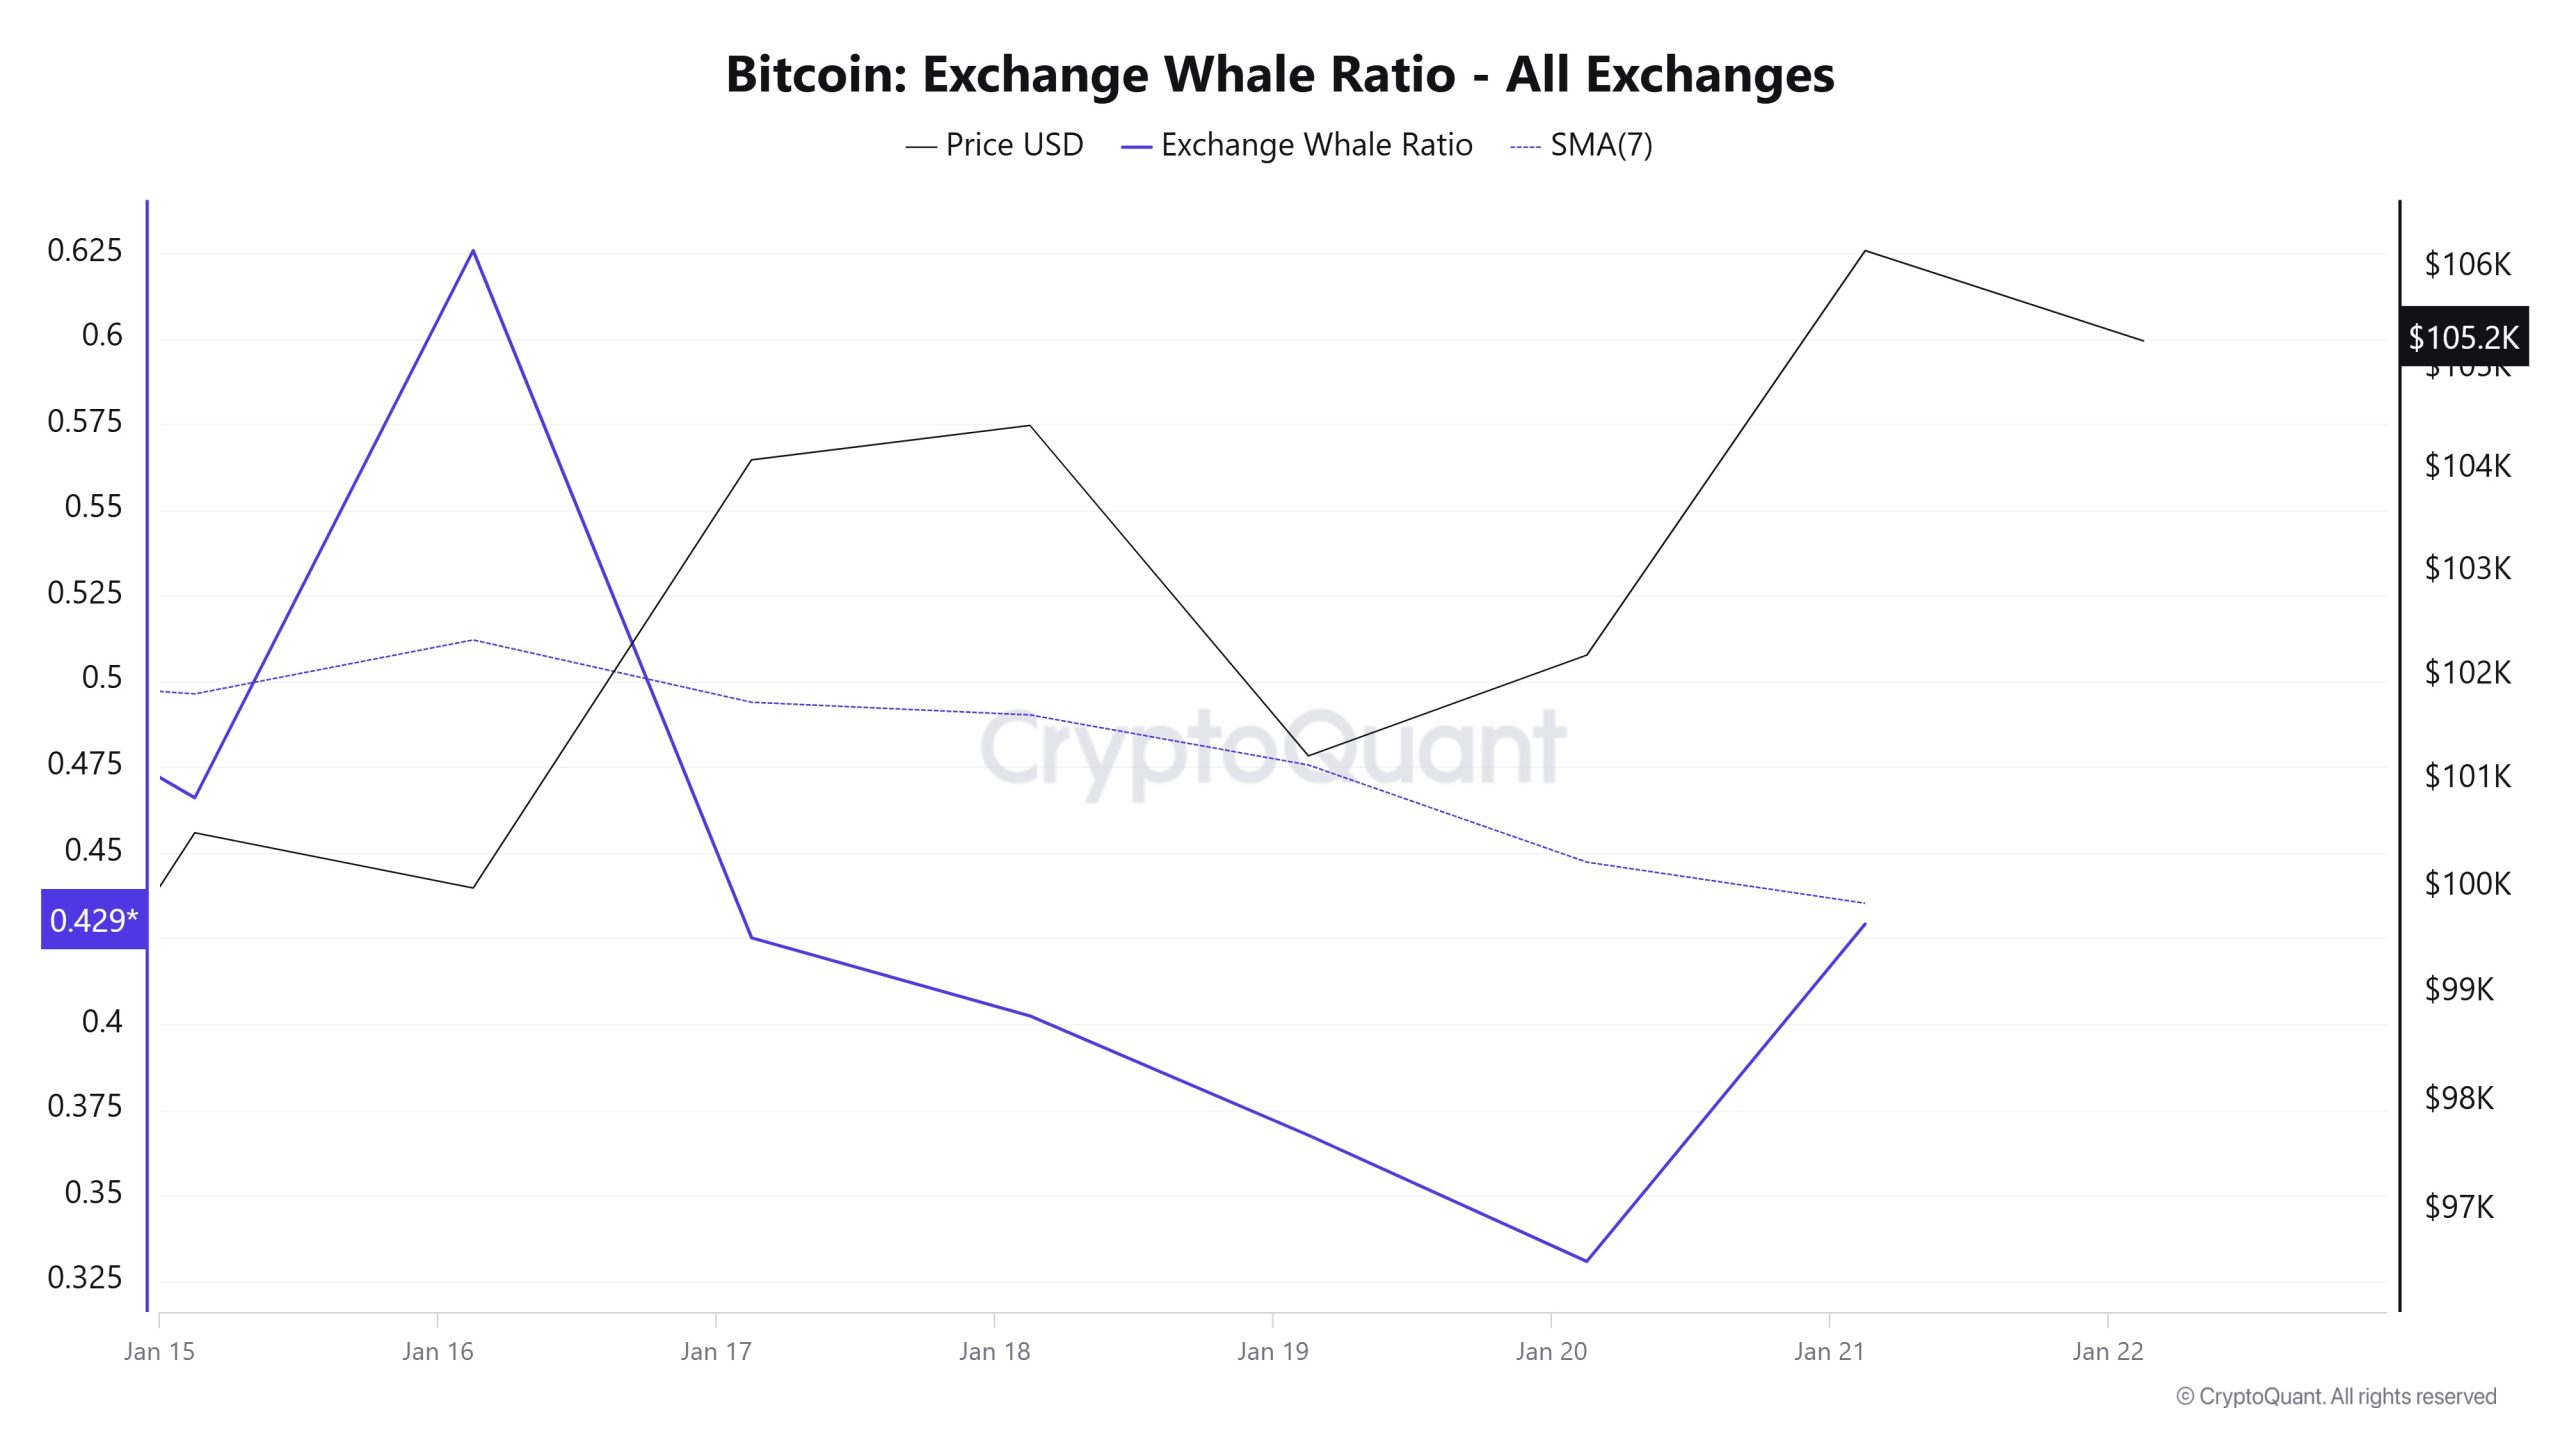
According to the data that has attracted attention in the cryptocurrency market in the last 7 days, whale activity on the central exchange has reached higher levels than ever before. When we look at the last 7 days of whale activity, it shows that centralized exchanges are being used by whales in an excessive way. When we look at the Exchange Whale Ratio metric, this metric, which was 0.62 on Ocak 16, reached historical highs, and now whales have started to withdraw Bitcoin from exchanges. This ratio currently stands at 0.42. When this ratio is above 0.350, it usually means that whales frequently use centralized exchanges. In the first half of this 7-day period, it was seen that mostly BTC sellers used centralized exchanges. However, with Trump taking office in the last days of the process, there has been a strong accumulation of Bitcoin in the wallets of whales. At the same time, when we look at the total BTC transfer, we see that 6,005,751 BTC moved, an increase of about 26% compared to last week.
YASAL BİLDİRİM
Bu dokümanda yer alan yatırım bilgi, yorum ve tavsiyeleri yatırım danışmanlığı hizmeti niteliği taşımamaktadır. Yatırım danışmanlığı hizmeti, yetkili kuruluşlar tarafından kişilerin risk ve getiri tercihleri dikkate alınarak kişiye özel olarak verilir. Bu dokümanda yer alan yorum ve tavsiyeler genel niteliktedir. Bu tavsiyeler mali durumunuz ile risk ve getiri tercihlerinize uygun olmayabilir. Bu nedenle, sadece bu dokümanda yer alan bilgilere dayanarak yatırım kararı vermeniz beklentilerinize uygun sonuçlar doğurmayabilir.
NOT: Bitcoin onchain analizinde kullanılan tüm veriler Cryptoqaunt'a dayanmaktadır.

